Here are the most relevant improvements we’ve made since the last release:
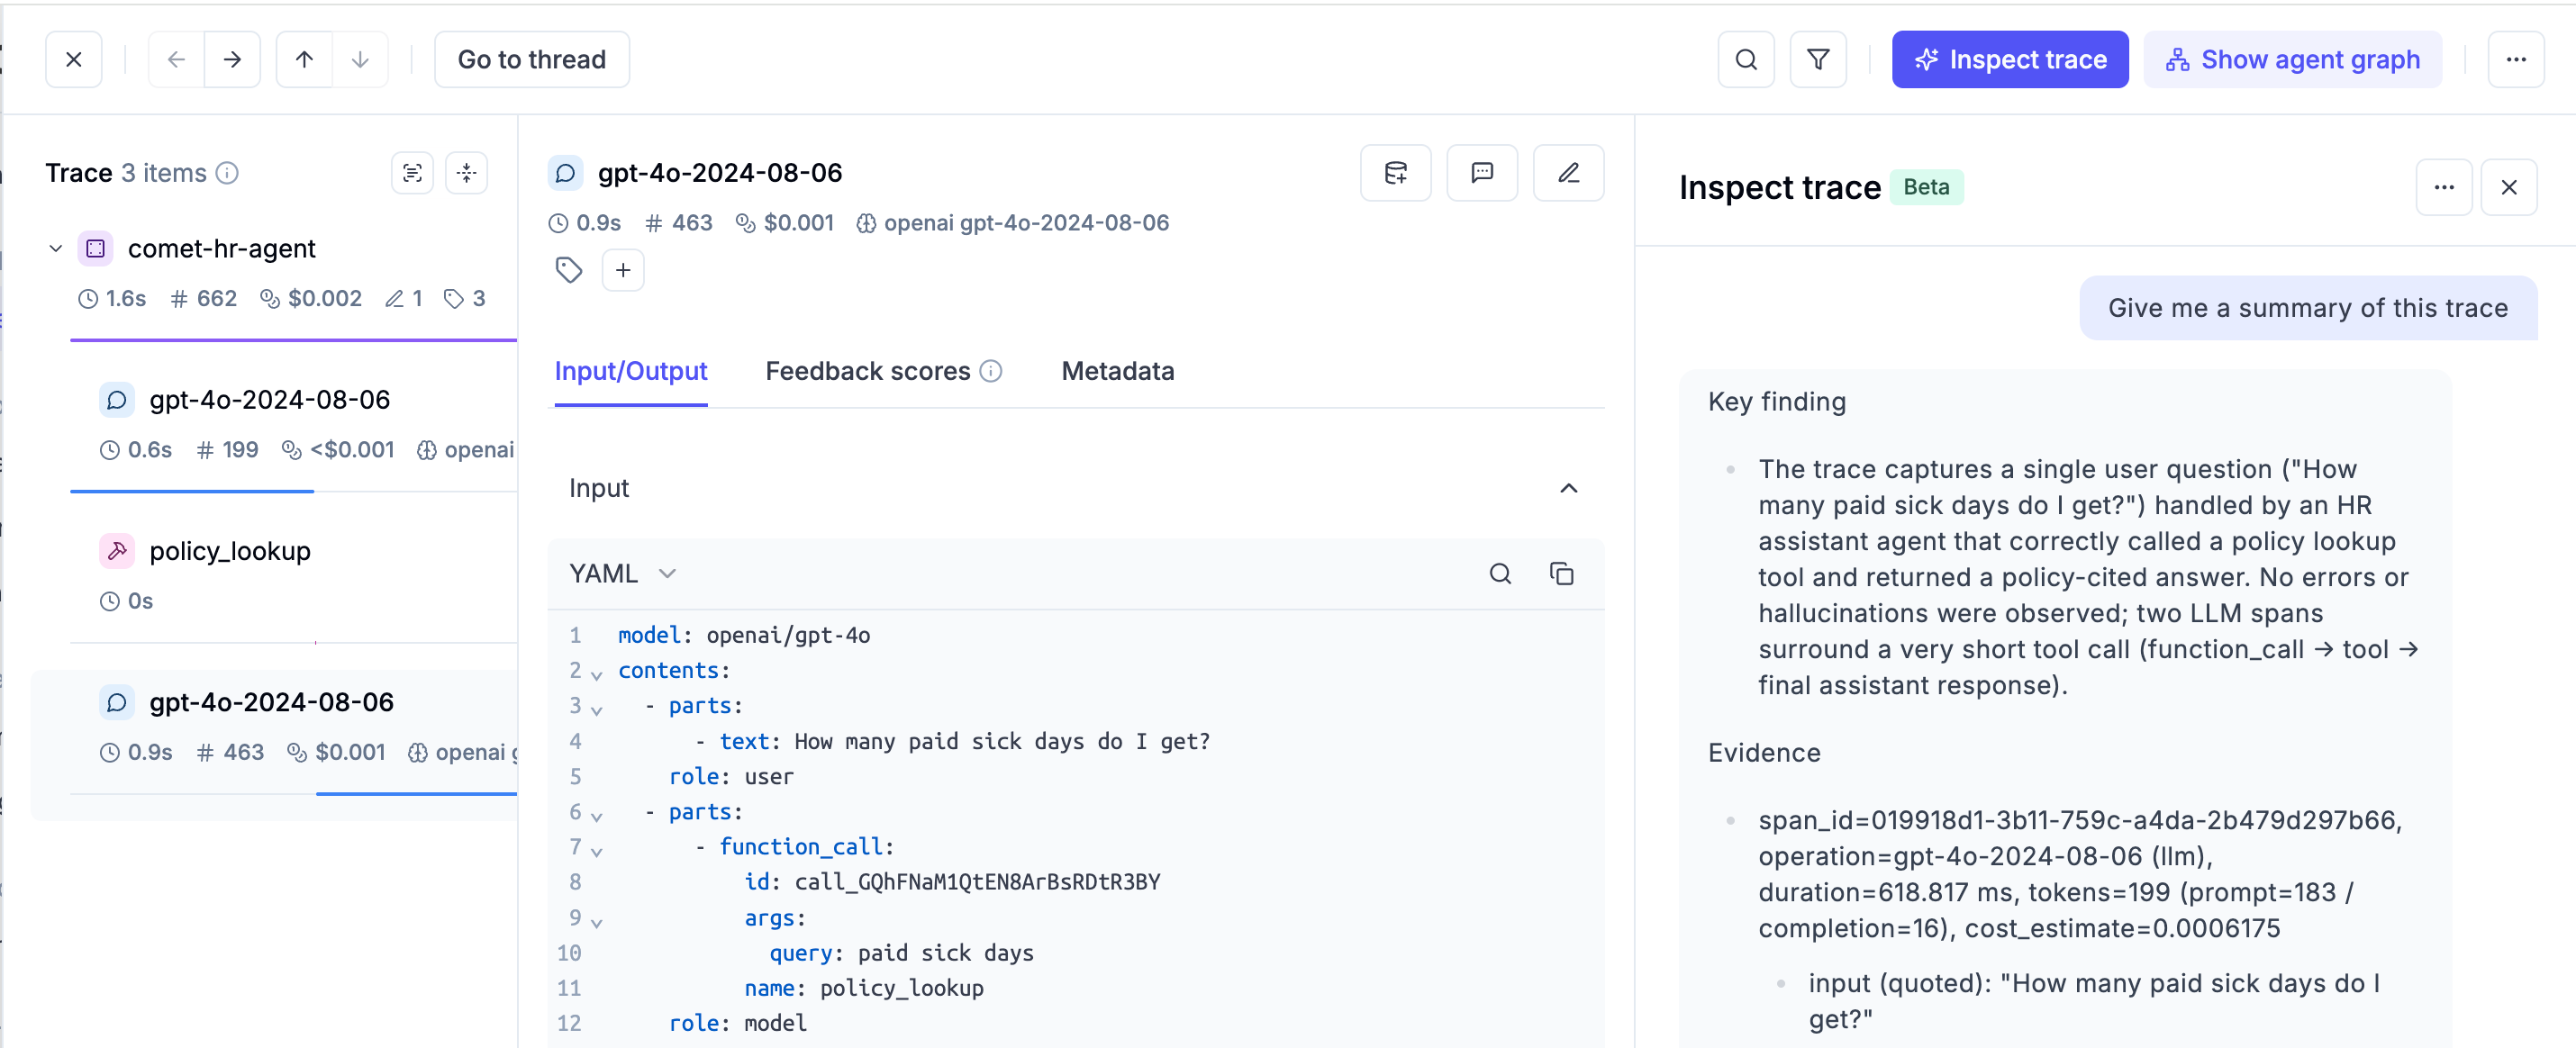
🔍 Opik Trace Analyzer Beta is Live!
We’re excited to announce the launch of Opik Trace Analyzer on Opik Cloud!
What this means: faster debugging & analysis!
Our users can now easily understand, analyze, and debug their development and production traces.
Want to give it a try? All you need to do is go to one of your traces and click on “Inspect trace” to start getting valuable insights.
✨ Features and Improvements
- We’ve finally added dark mode support! This feature has been requested many times by our community members. You can now switch your theme in your account settings.
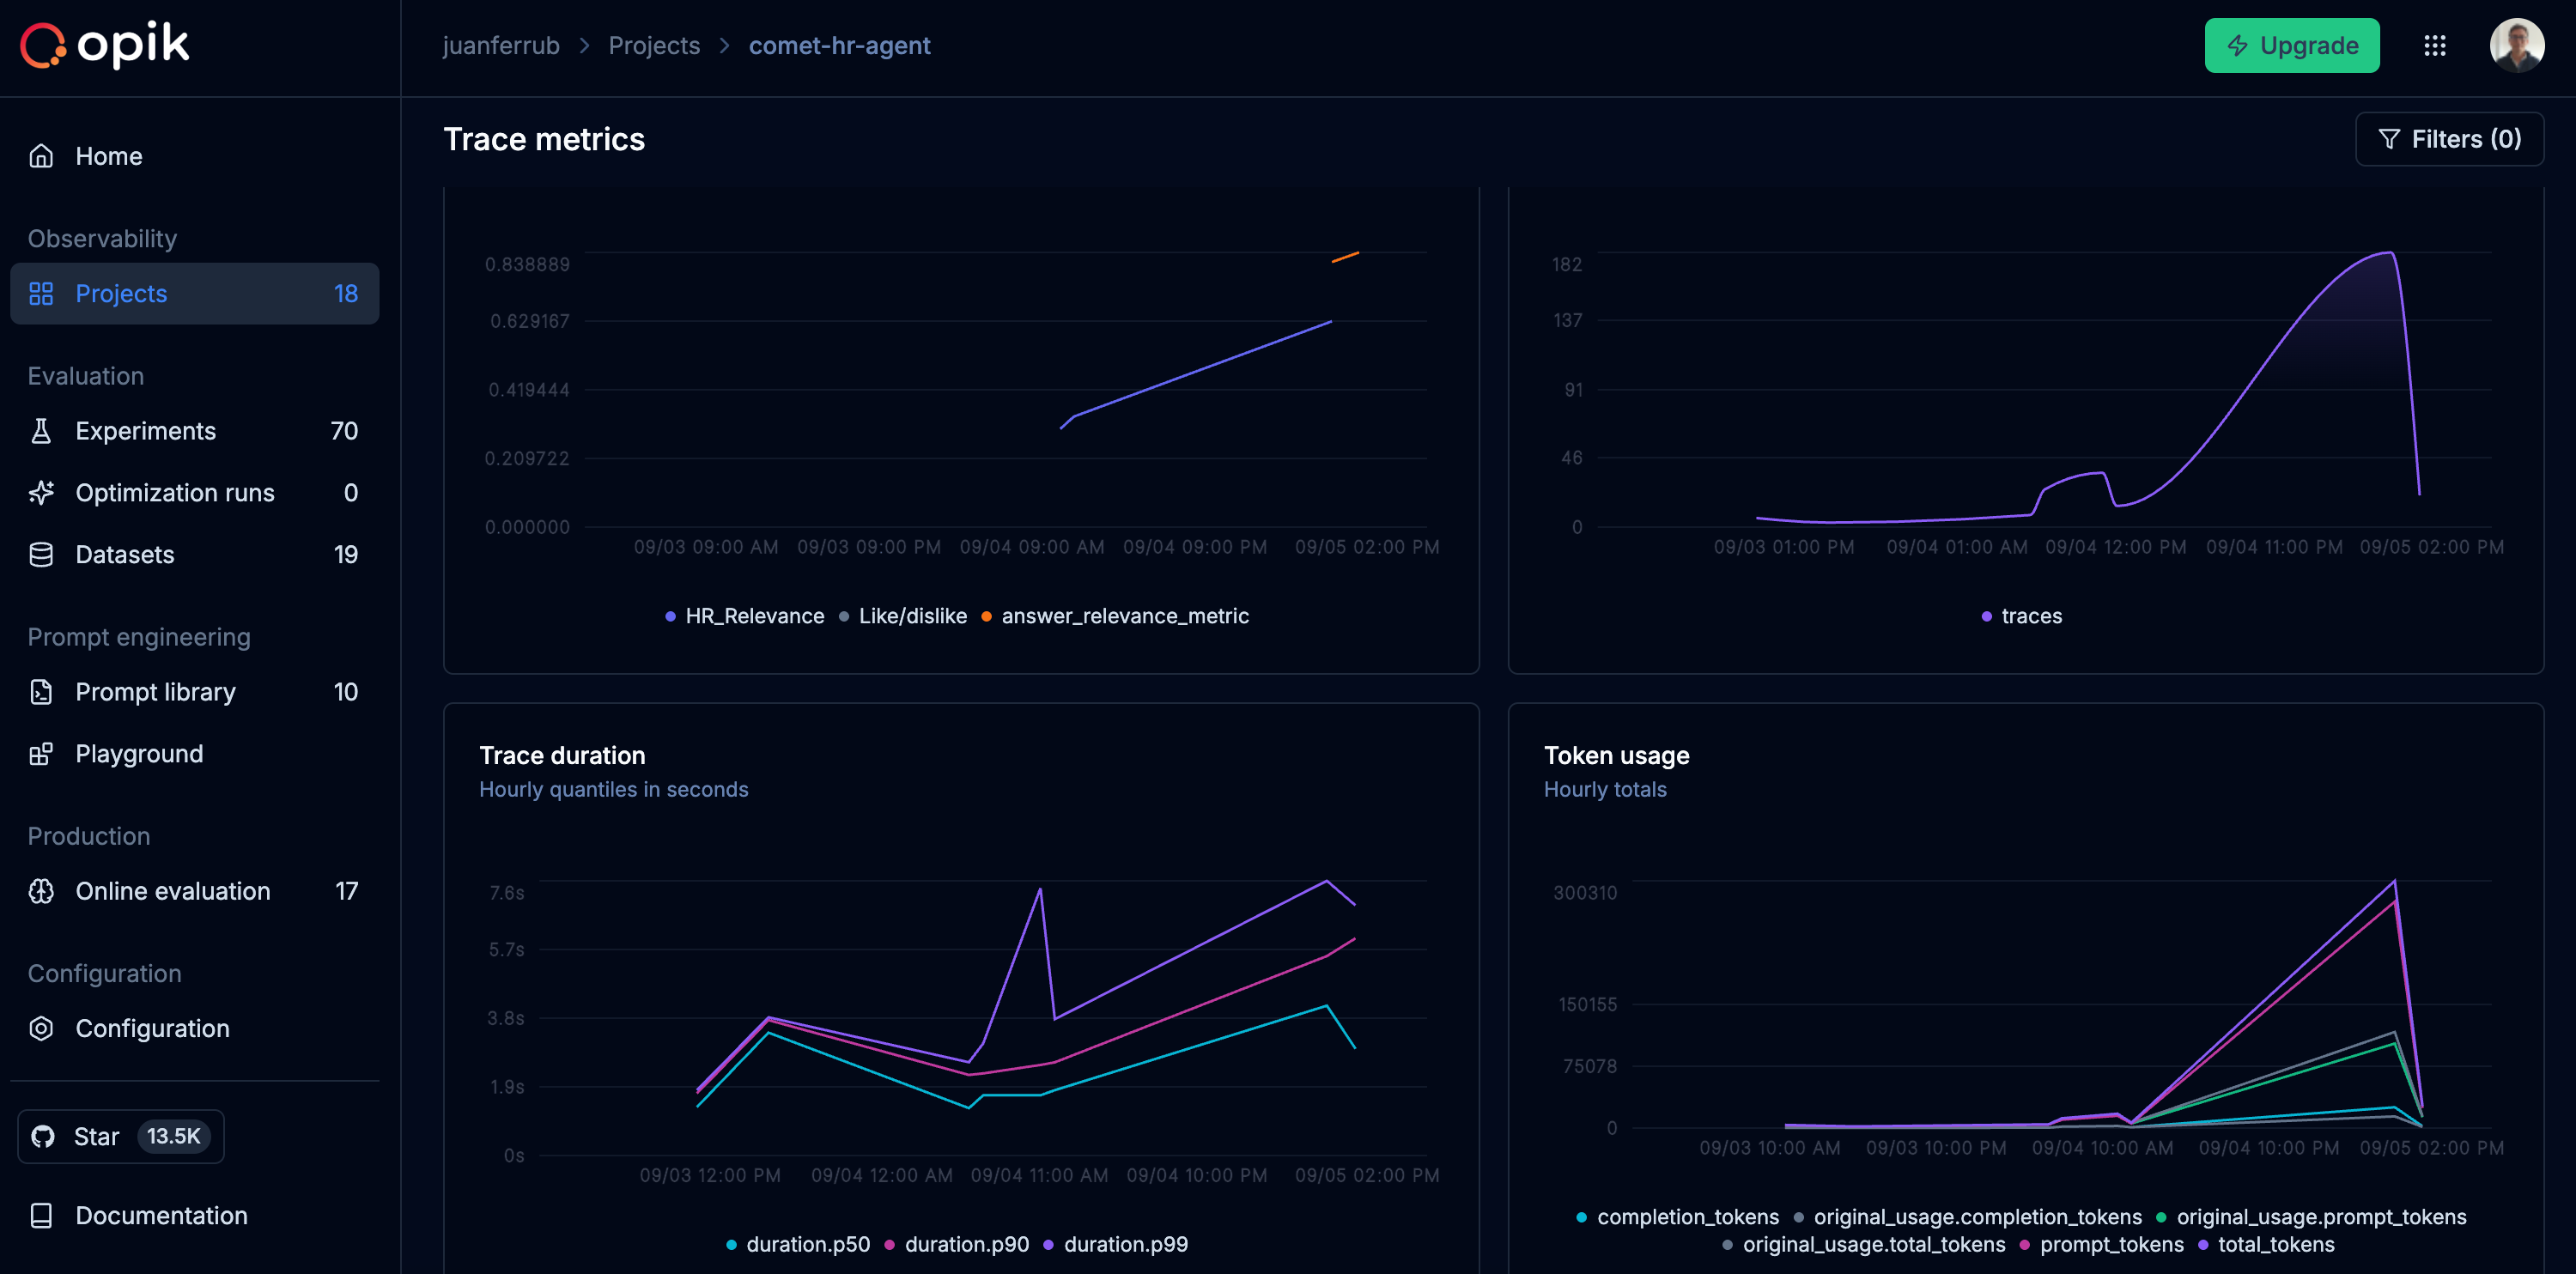
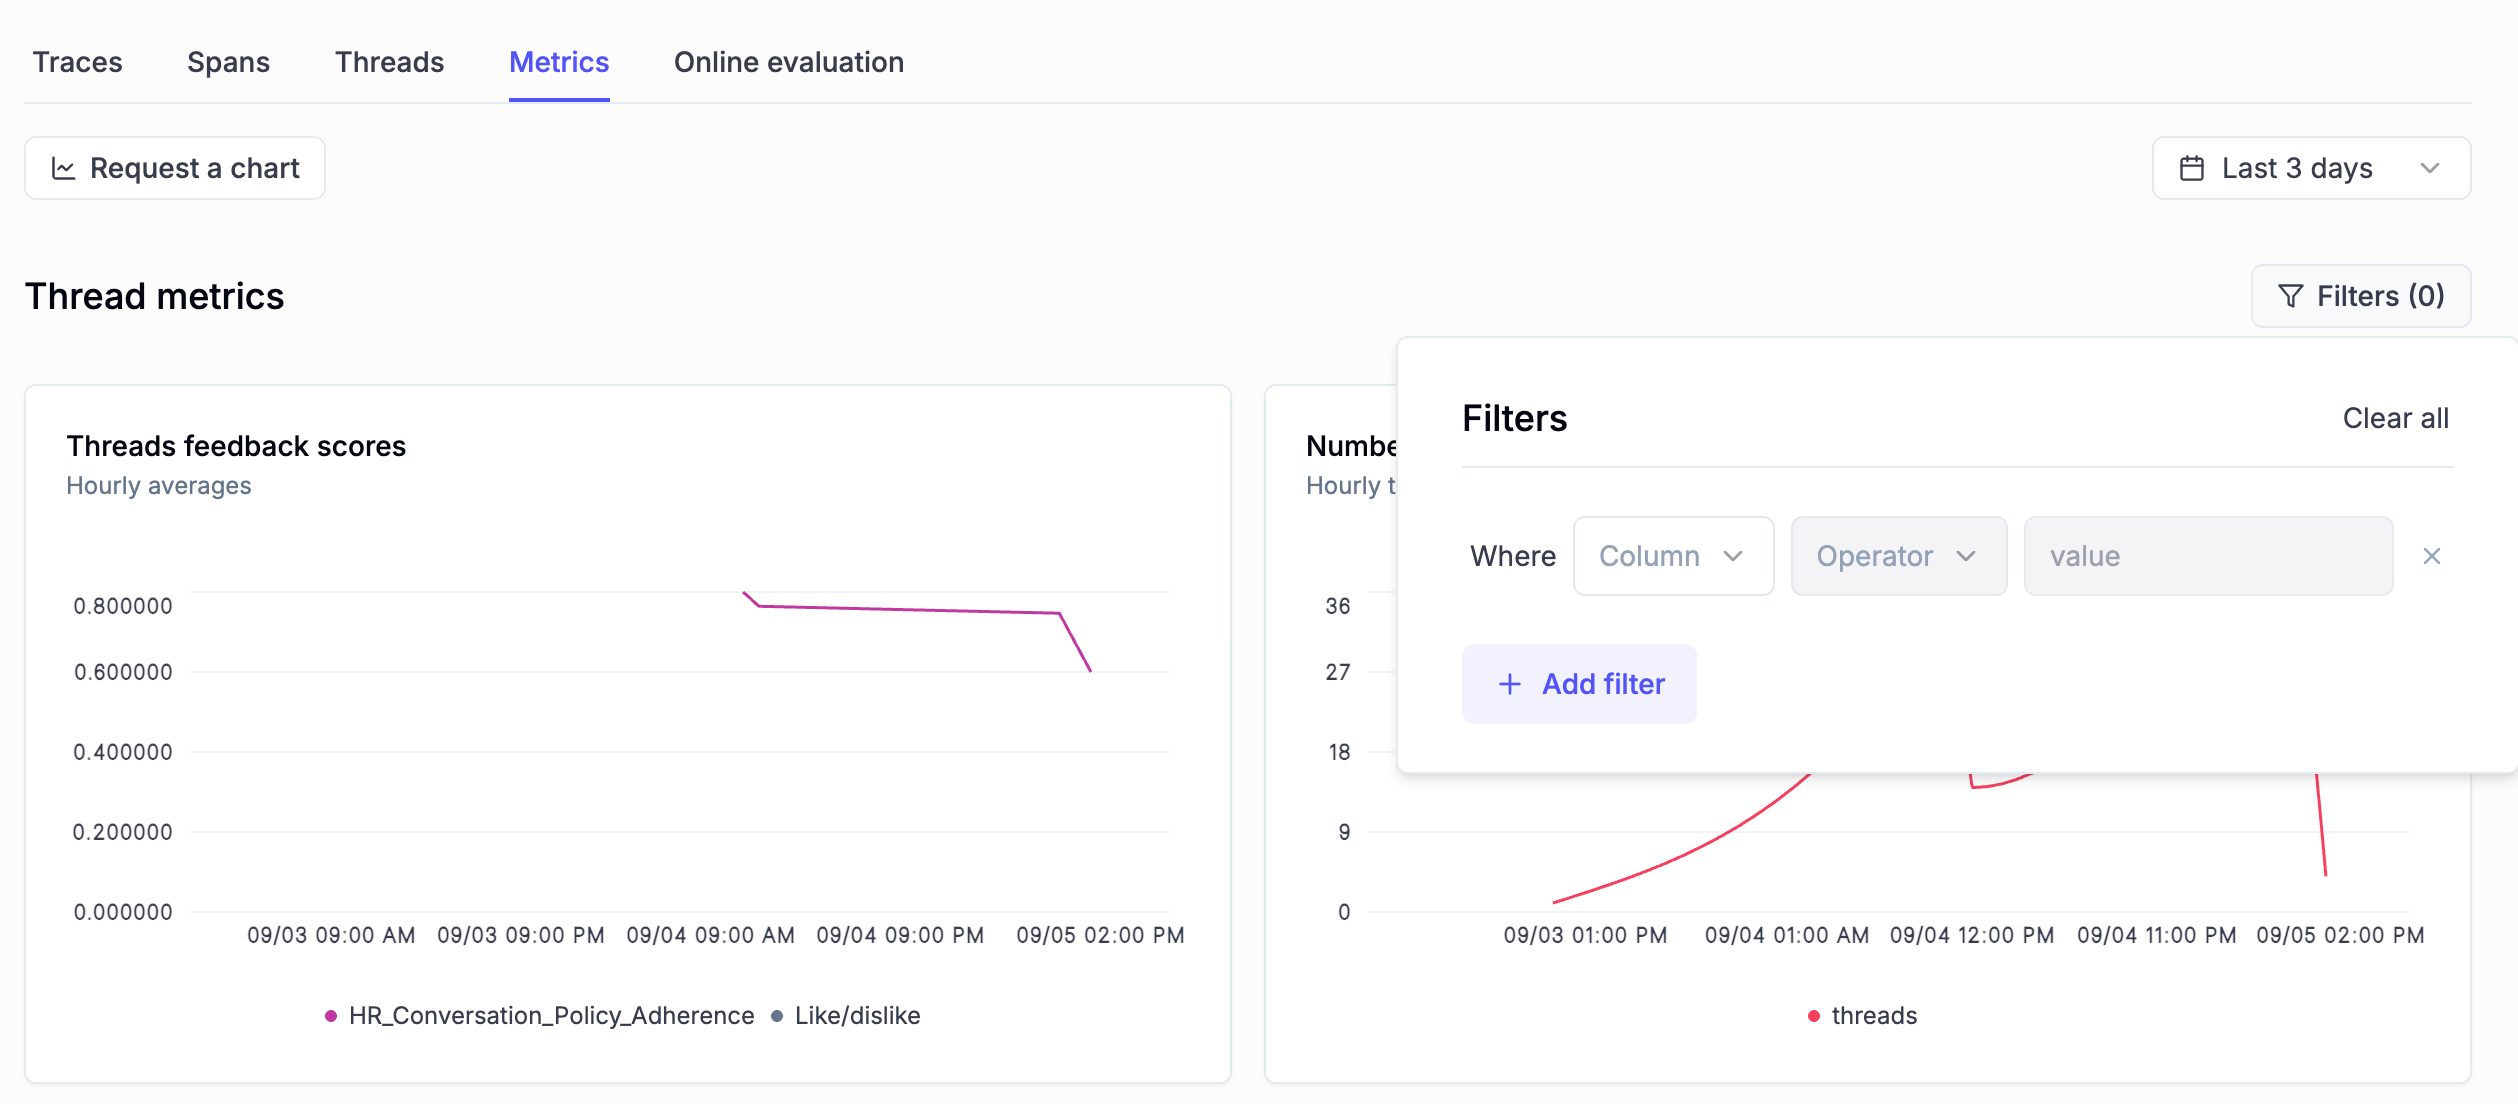
- Now you can filter the widgets in the metrics tab by trace and threads attributes
- Annotating tons of threads? We’ve added the ability to export feedback score comments for threads to CSV for easier analysis in external tools.
- We have also improved the discoverability of the experiment comparison feature.
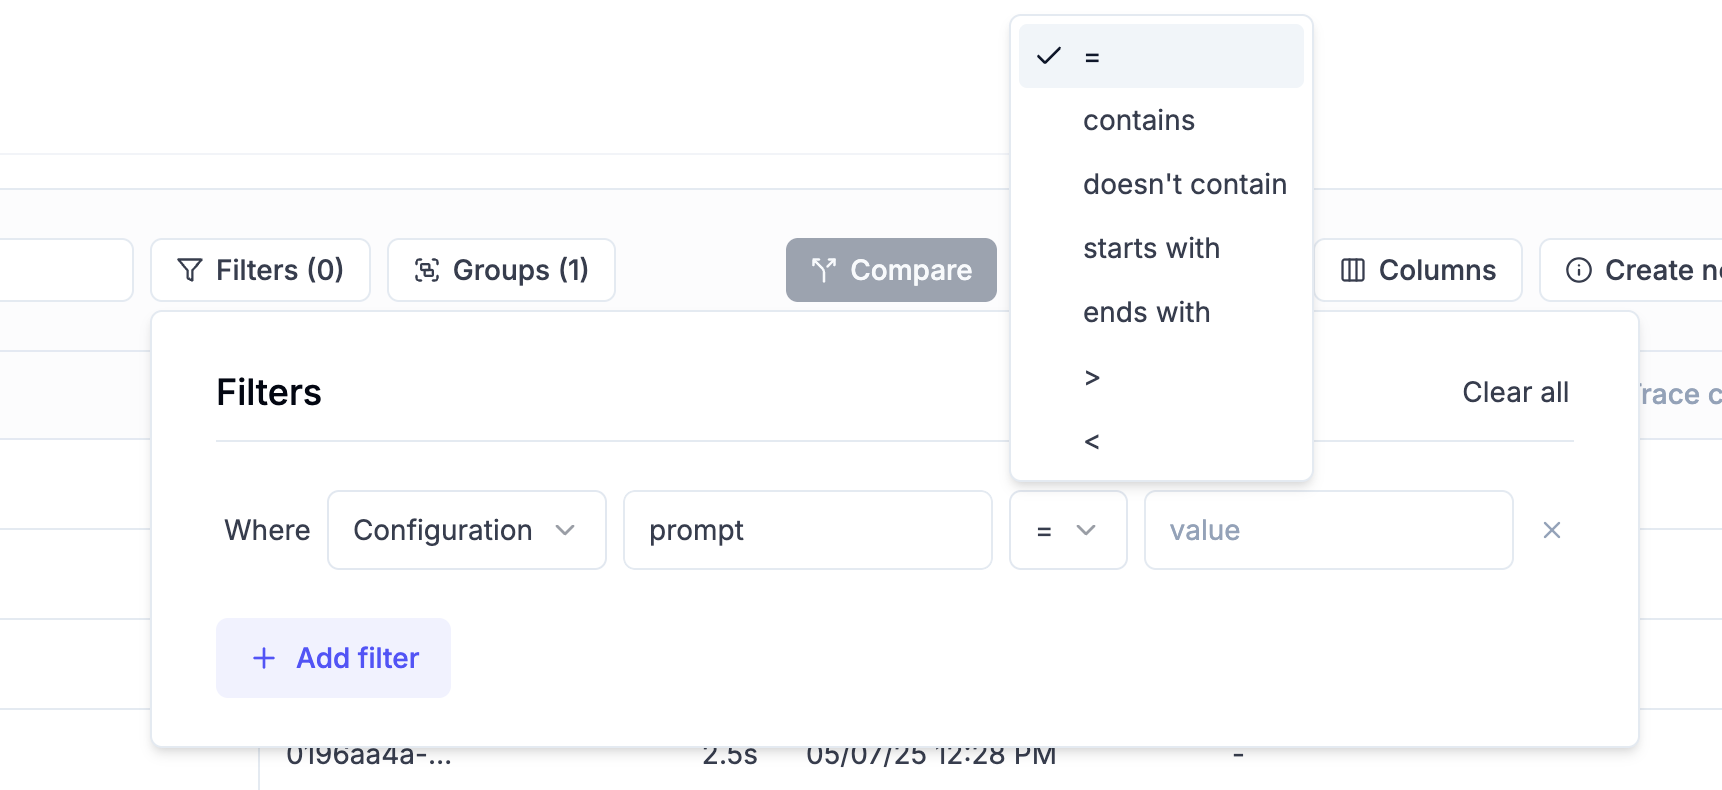
- Added new filter operators to the Experiments table
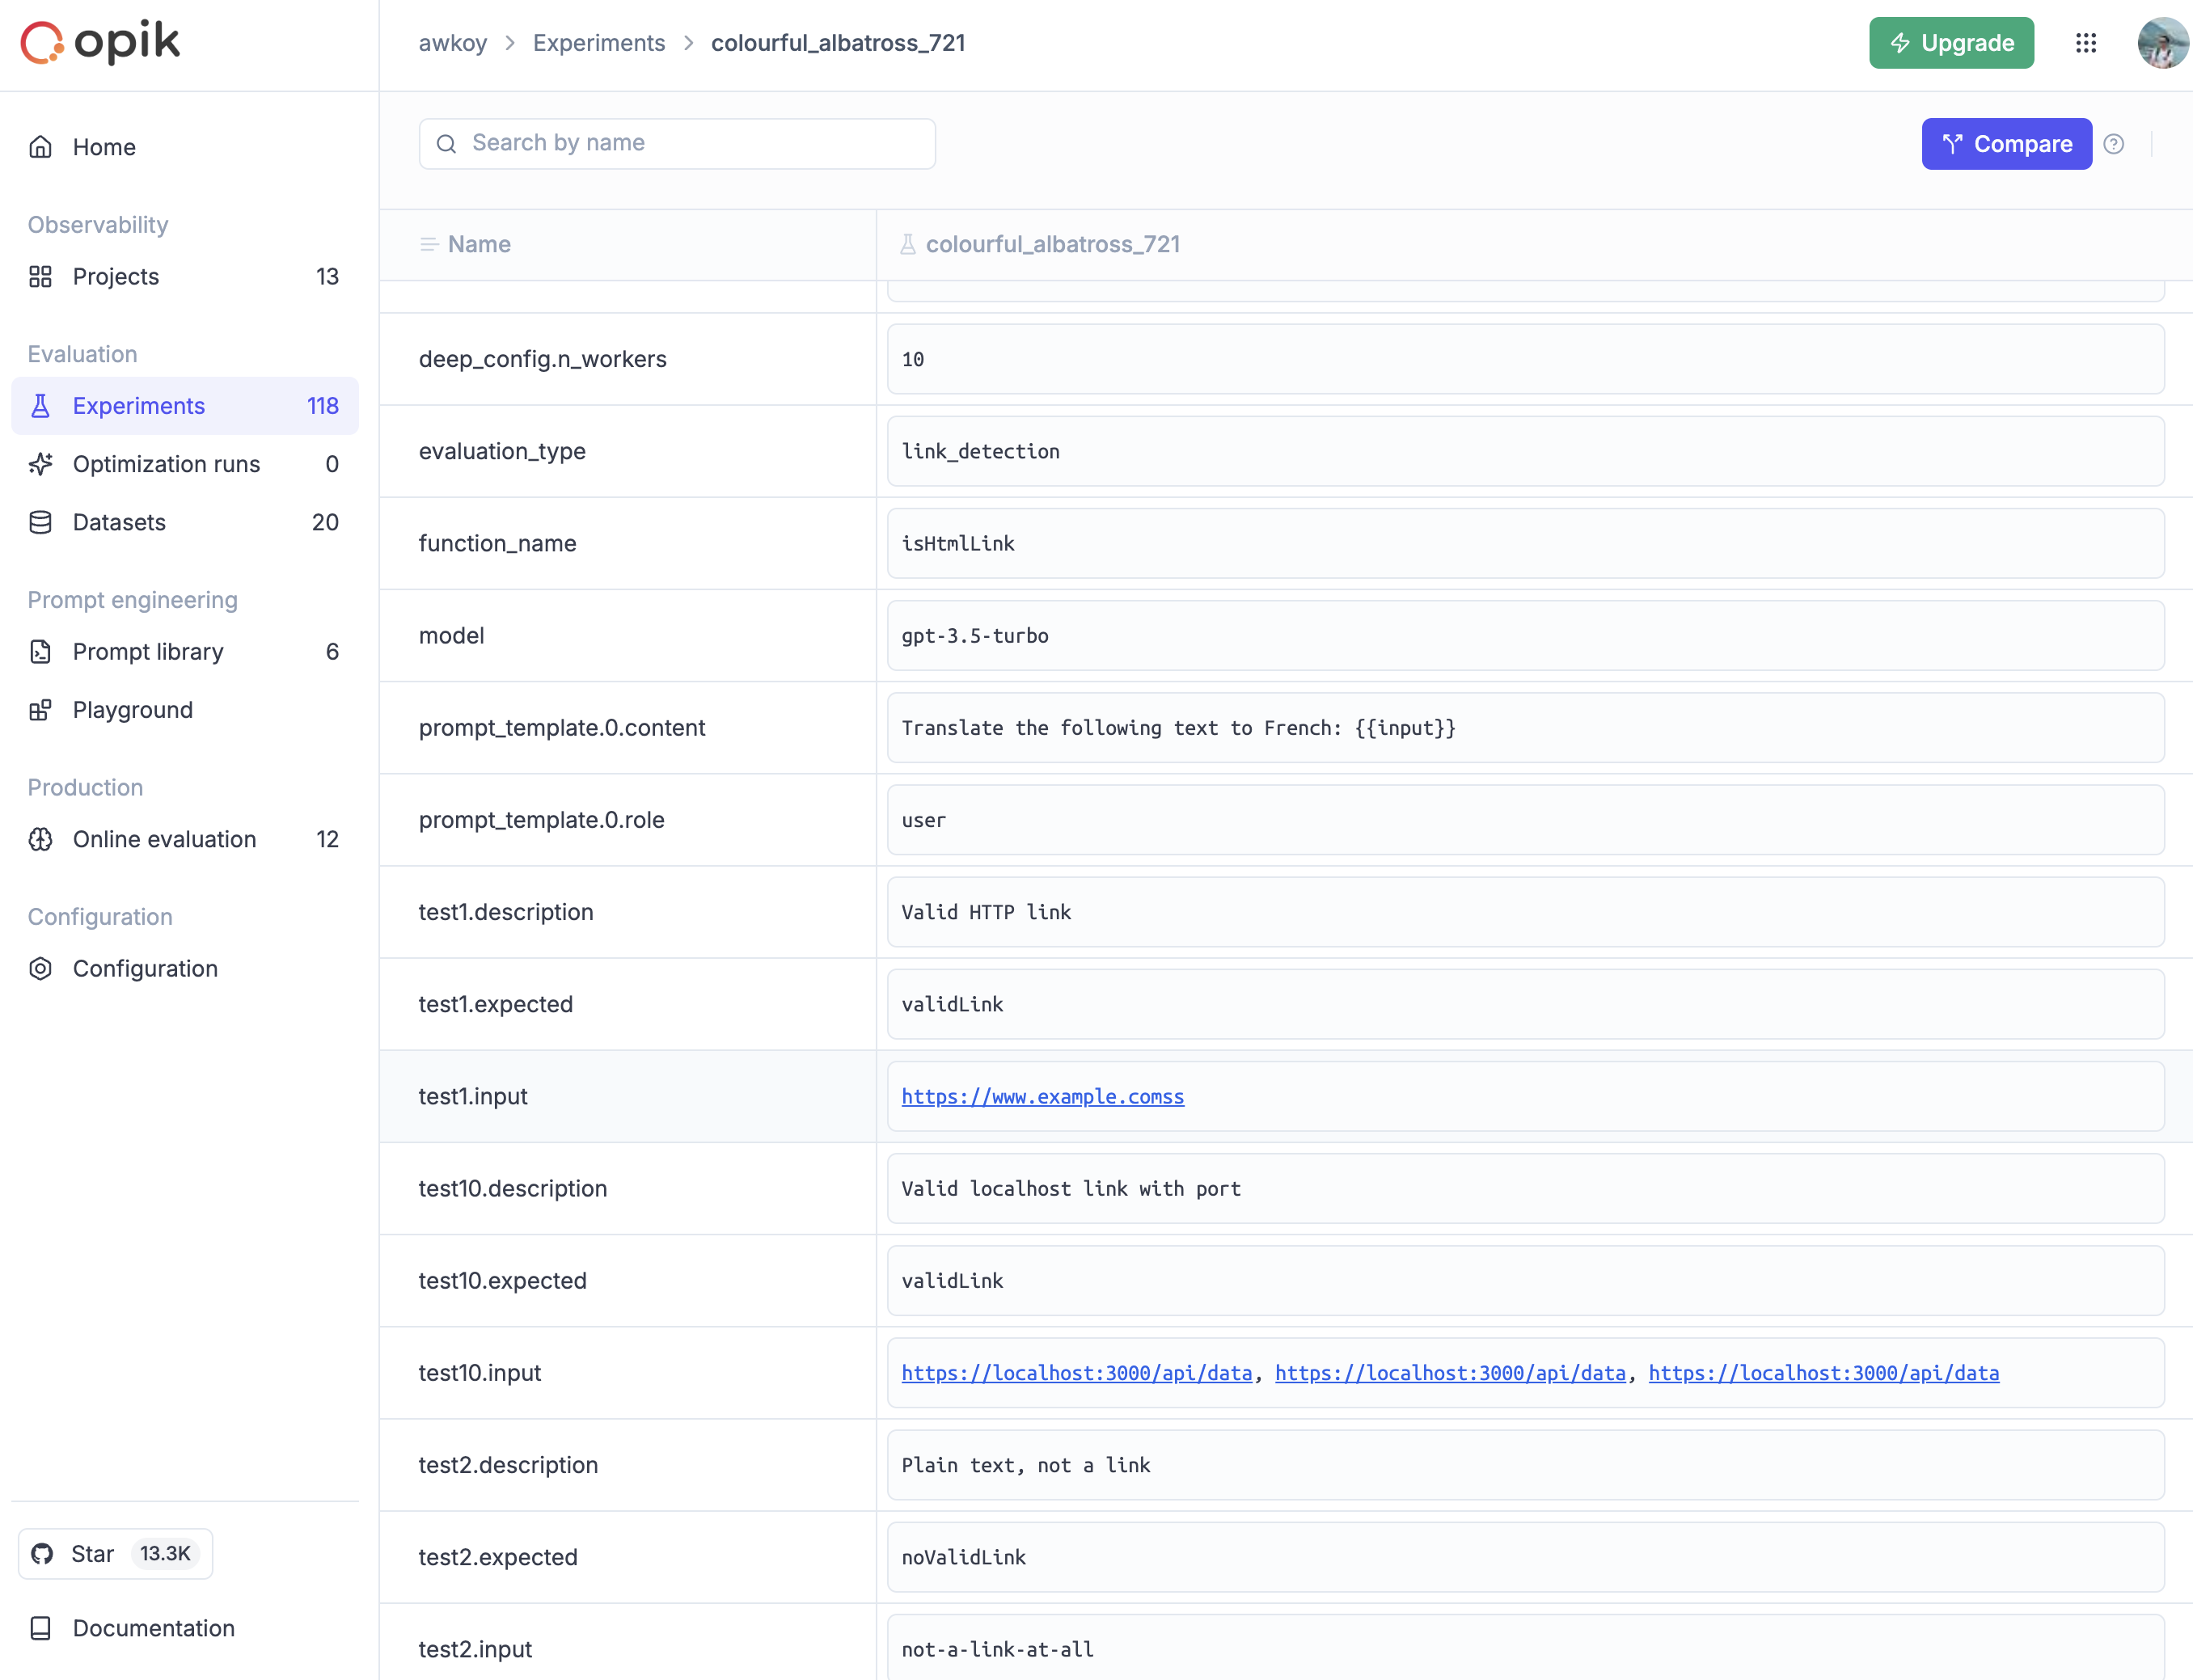
- Adding assets as part of your experiment’s metadata? We now display clickable links in the experiment config tab for easier navigation.
📚 Documentation
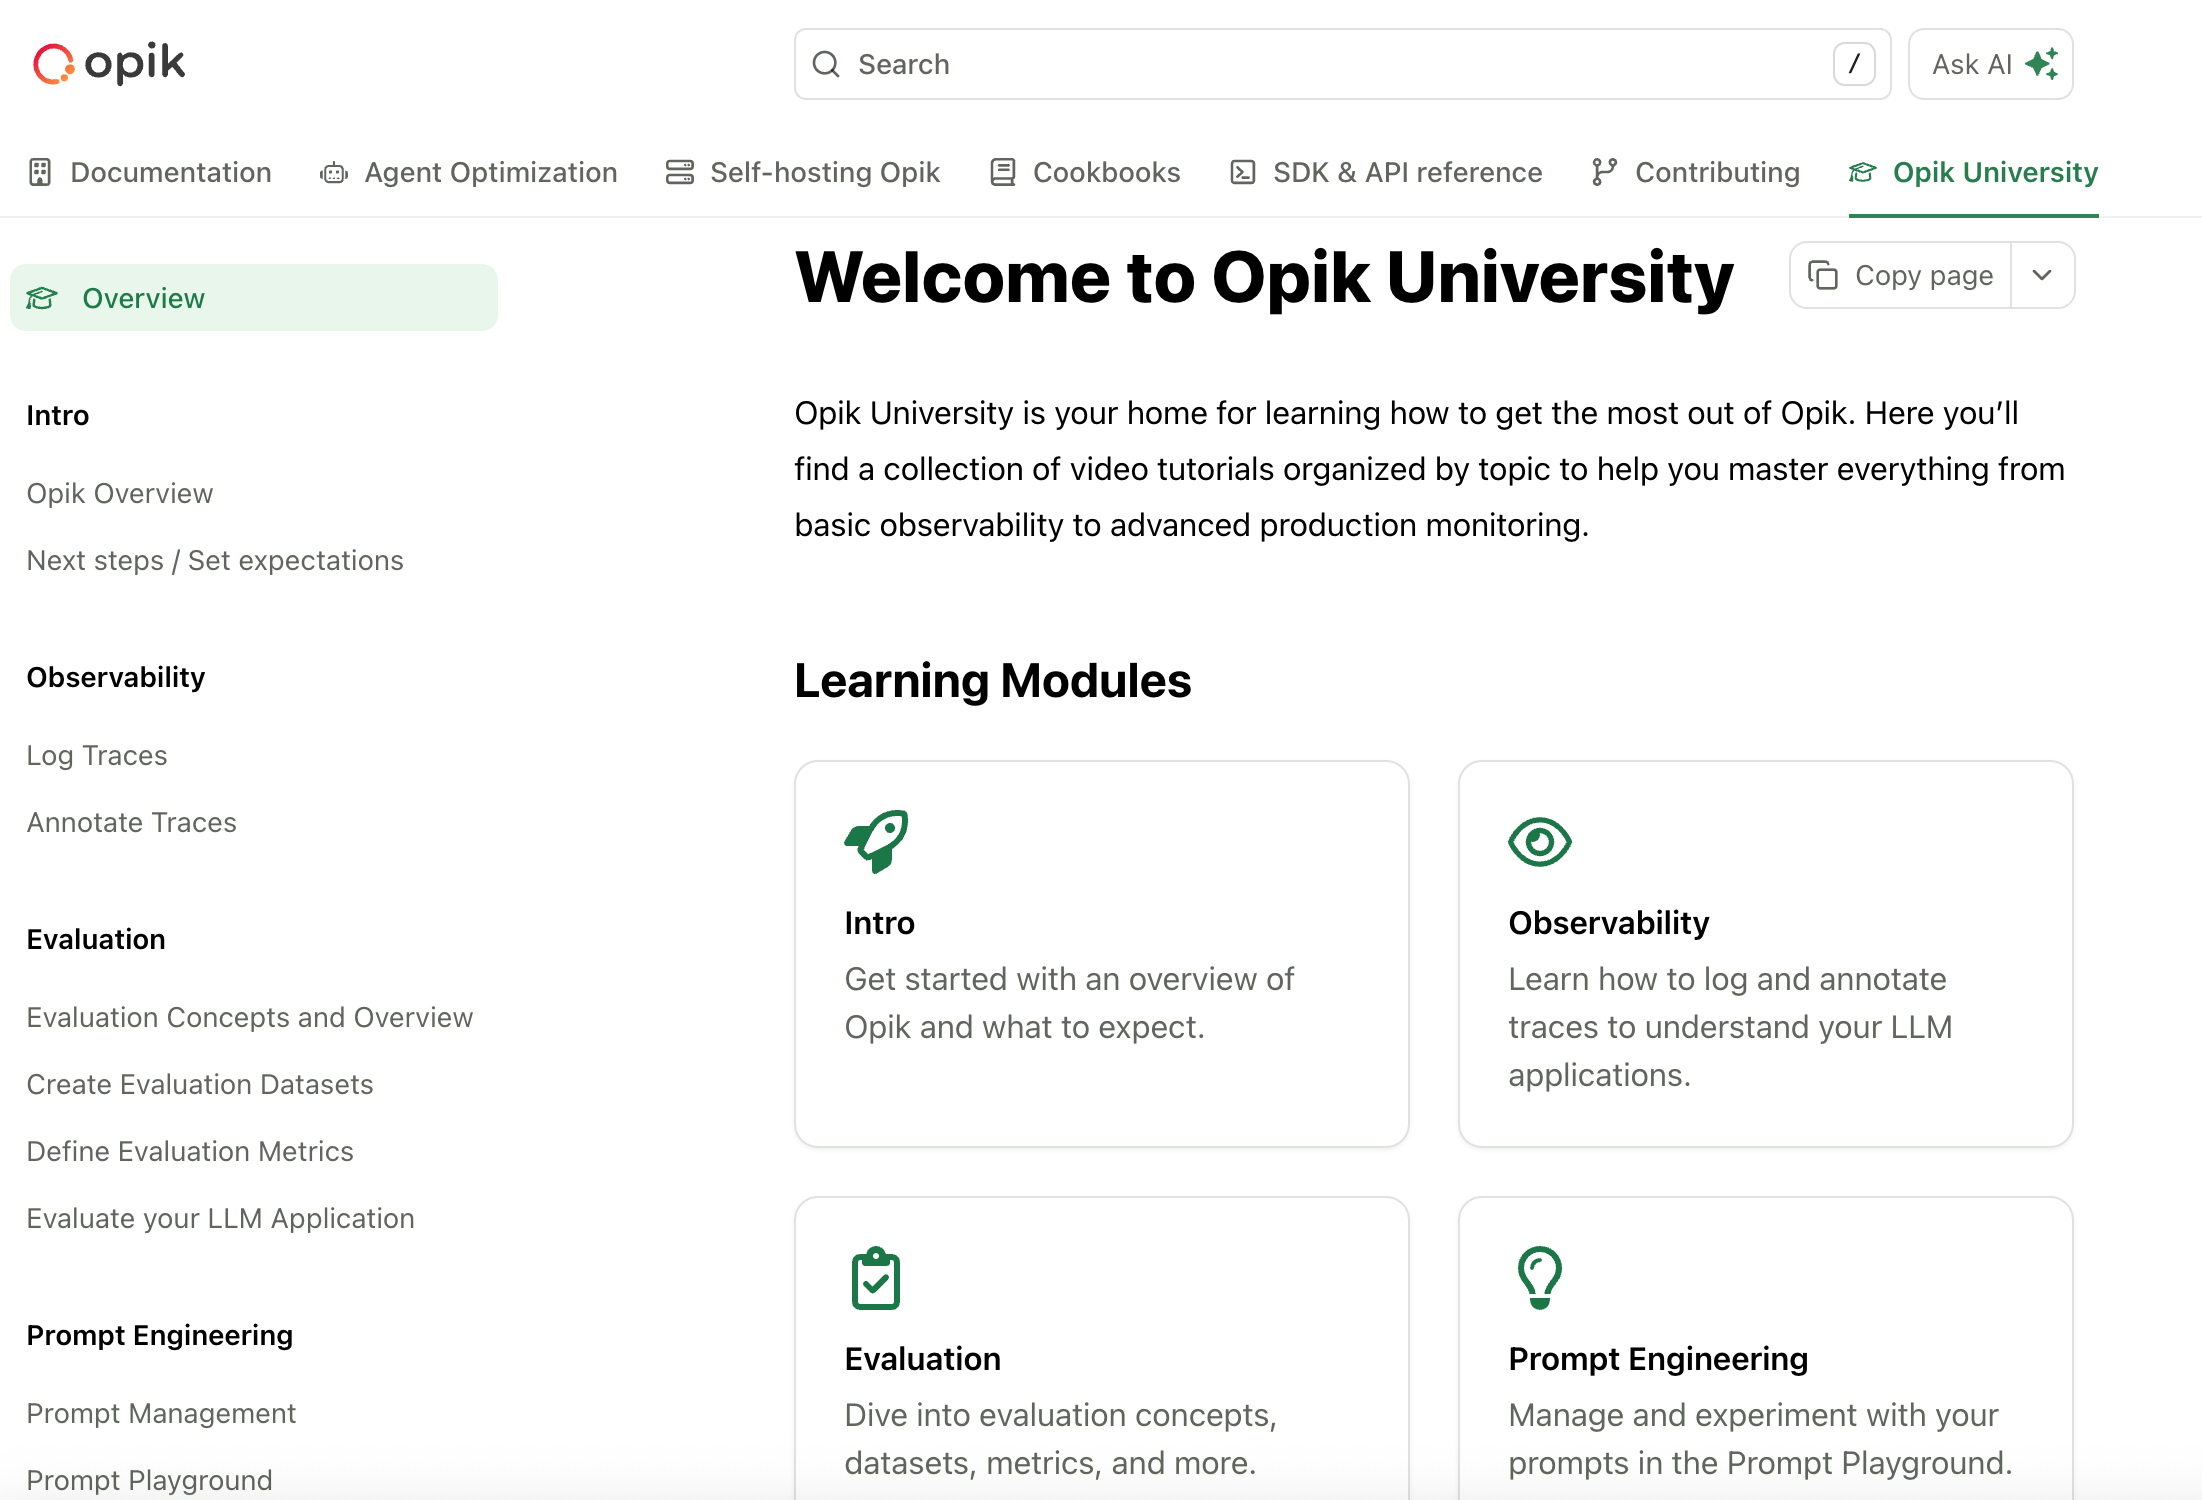
- We’ve released Opik University! This is a new section of the docs full of video guides explaining the product.
🔌 SDK & Integration Improvements
- Enhanced LangChain integration with comprehensive tests and build fixes
- Implemented new search_prompts method in the Python SDK
- Added documentation for models, providers, and frameworks supported for cost tracking
- Enhanced Google ADK integration to log error information to corresponding spans and traces
And much more! 👉 See full commit log on GitHub
Releases: 1.8.34, 1.8.35, 1.8.36, 1.8.37, 1.8.38, 1.8.39, 1.8.40, 1.8.41, 1.8.42