Debugging agents with Ollie
Your agent returned the wrong answer, ignored context it was given, or took twice as long as it should. The trace is right there in Opik — but tracing alone doesn’t tell you why it happened or how to fix it. That’s where Ollie comes in.
What Ollie has access to
Ollie is more than a chatbot — it has tools that let it act on your workspace and your code.
- Read and analyze traces — Ollie reads full span trees including inputs, outputs, latencies, token counts, and feedback scores. It can drill into individual spans, compare traces side by side, and search across your project for patterns.
- Search your workspace — Traces, threads, datasets, experiments, and prompts are all queryable. Ollie can aggregate data, find outliers, and surface trends you’d otherwise need to query manually.
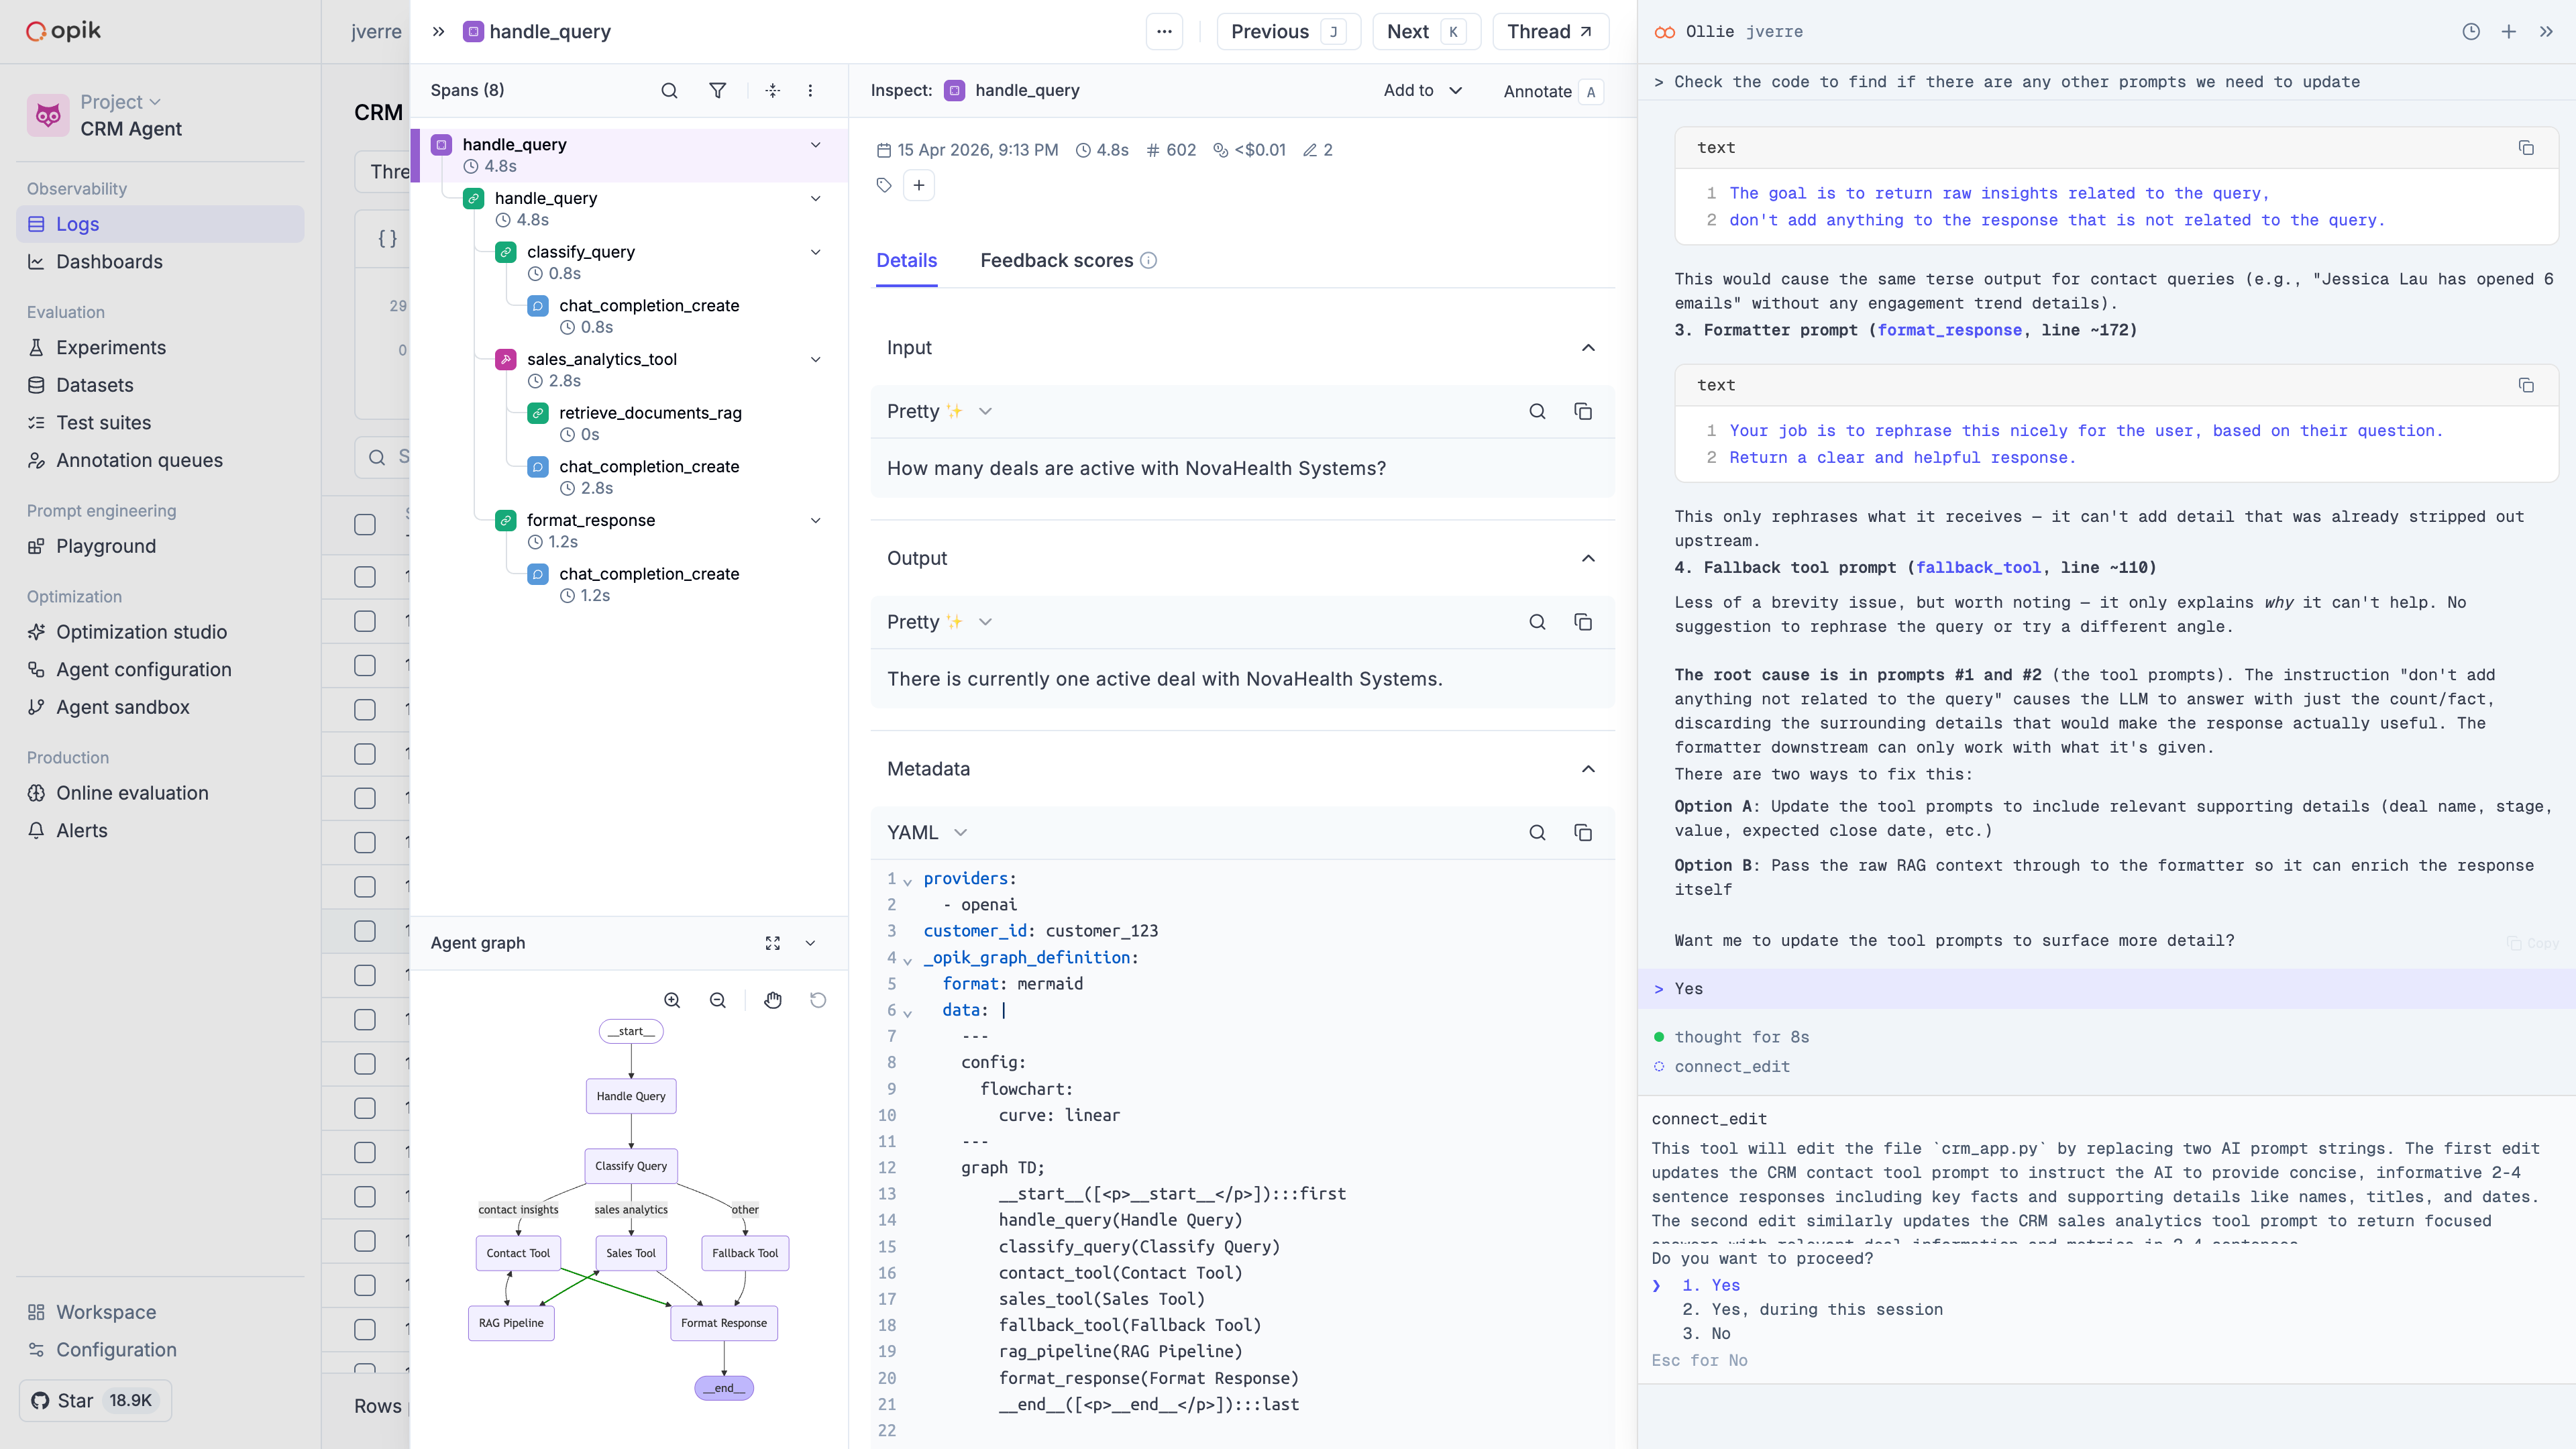
- Read and edit your code — When you connect your repository with
opik connect, Ollie gains secure, read-only access to your source files. It can propose edits that you review and approve before anything changes on disk. - Run your agent — With
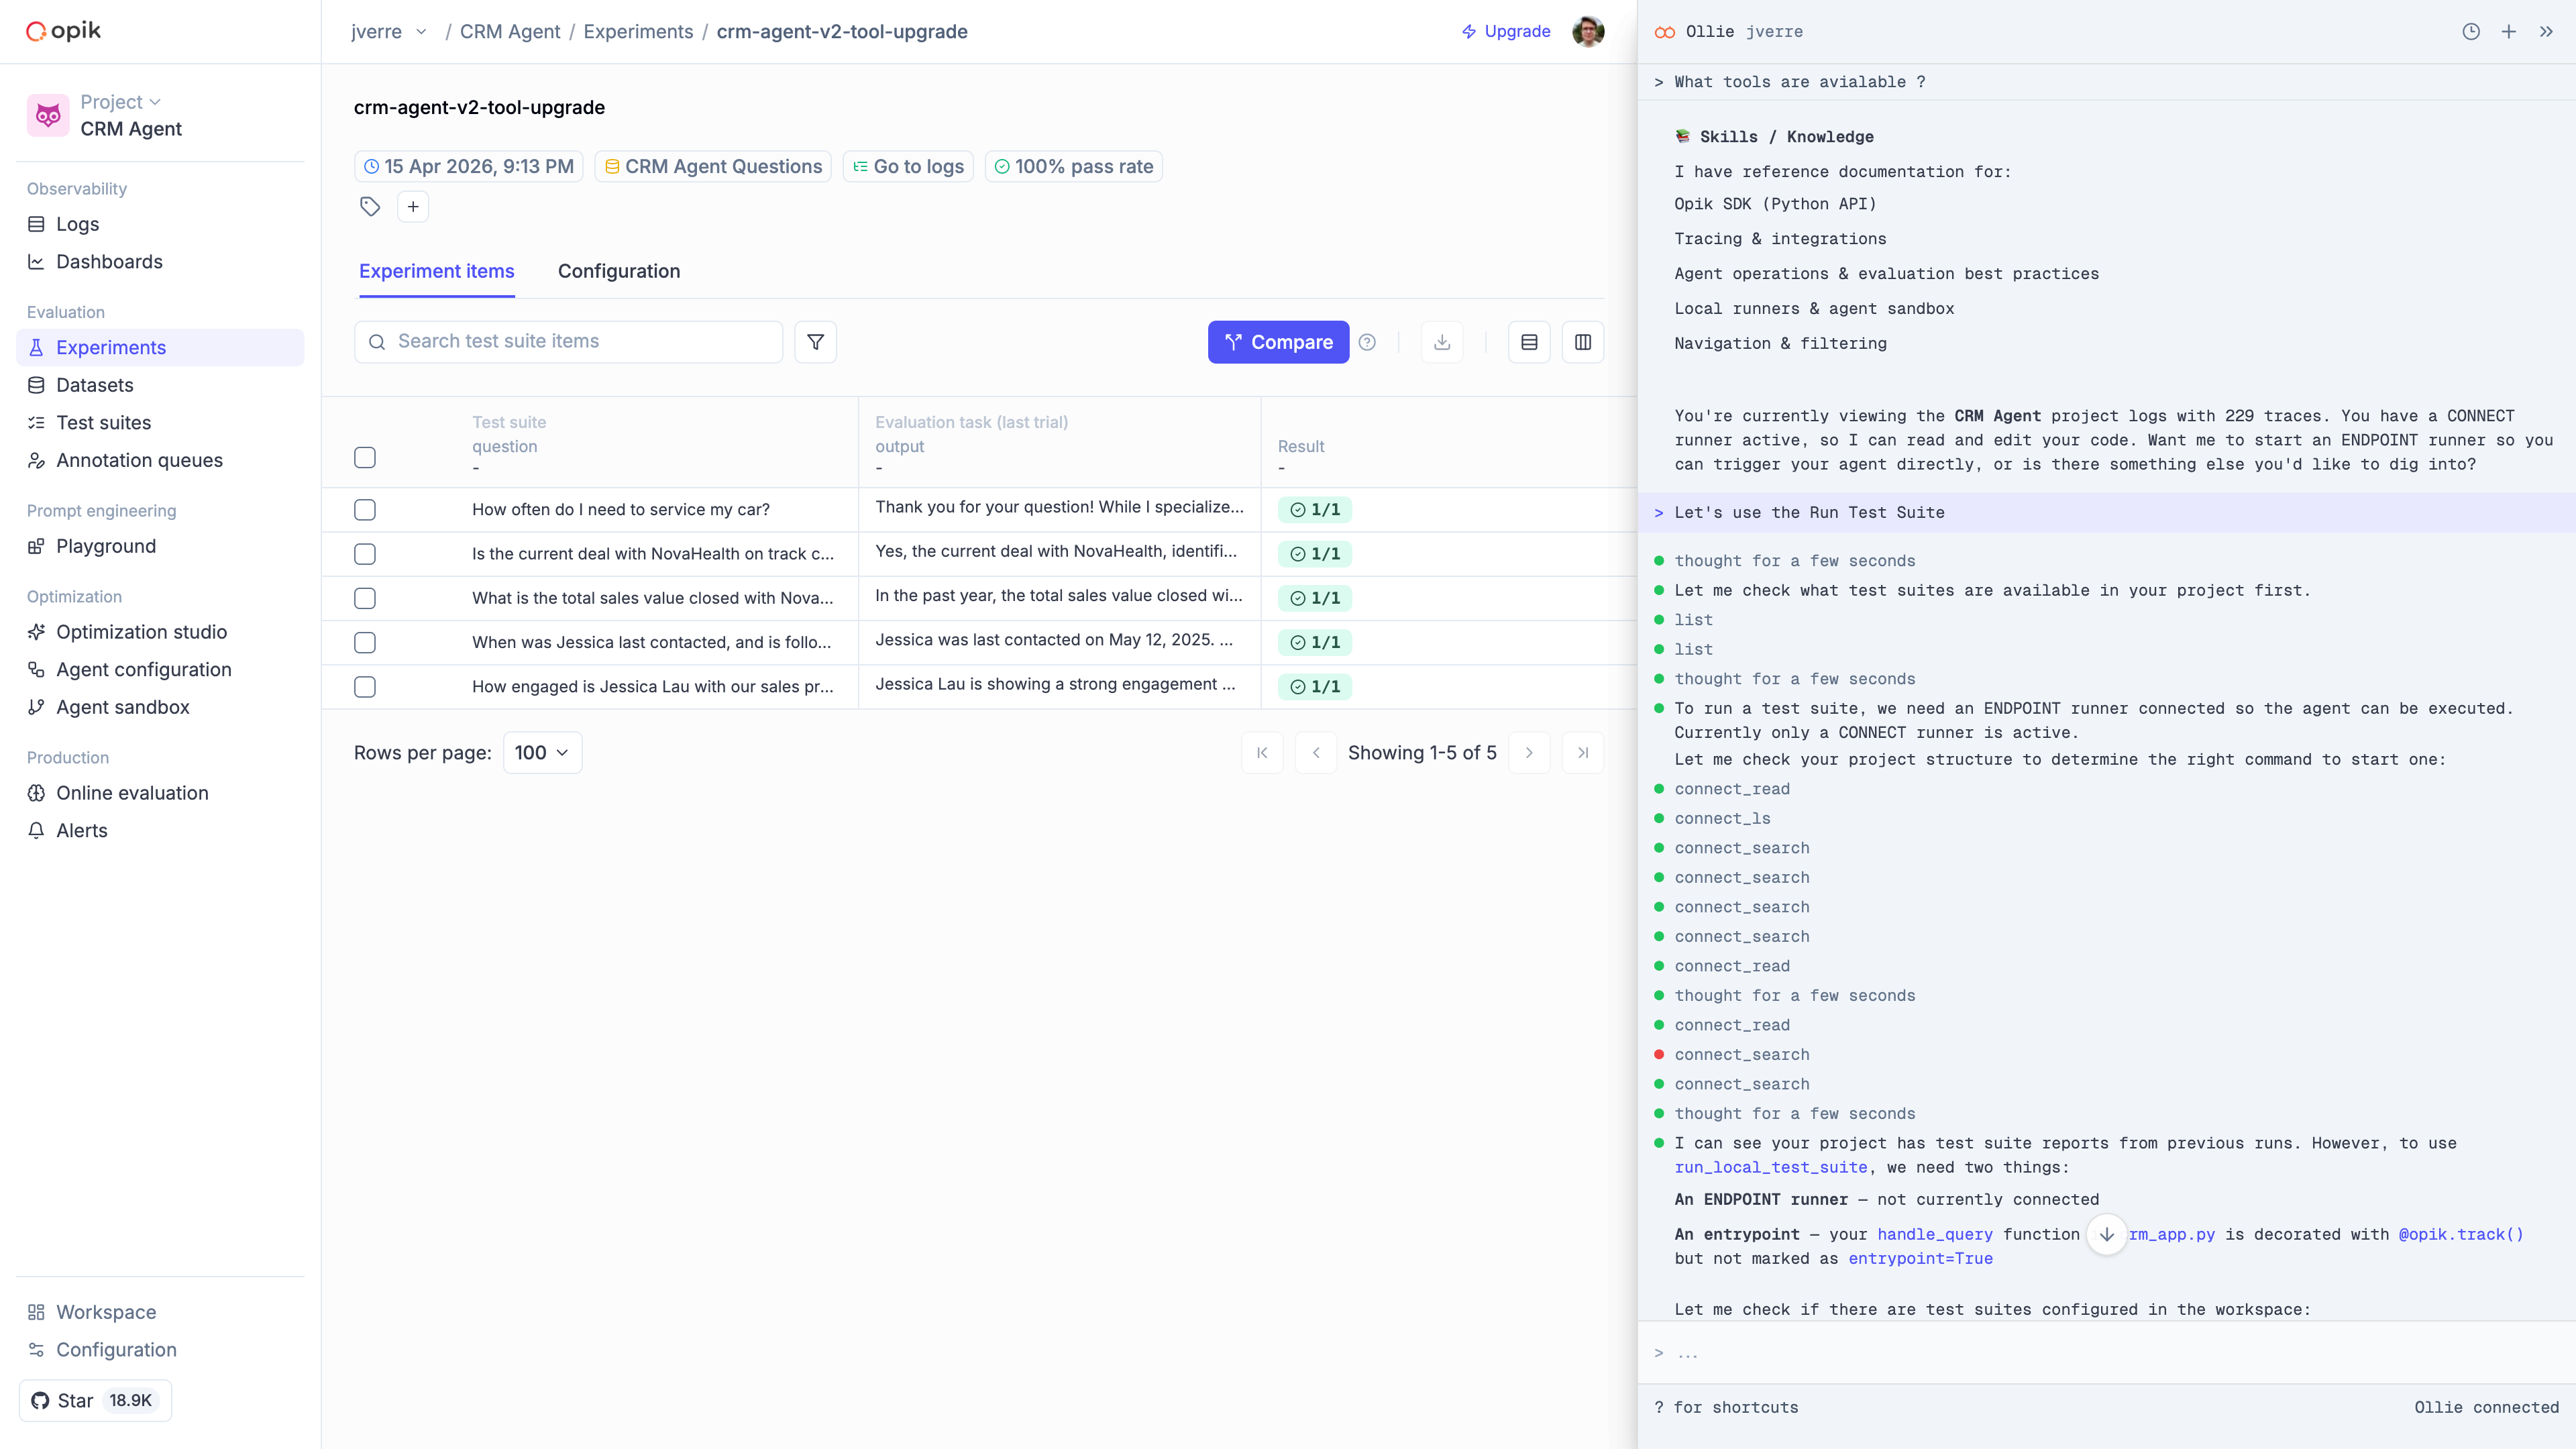
opik connectactive, Ollie can rerun your agent using inputs from a failing trace to verify a fix in real time. New traces stream back into Opik automatically. - Manage test suites — Ollie can add traces as test cases to test suites, define assertions, trigger evaluation runs, and summarize pass/fail results.
- Navigate the Opik UI — Ollie can link you directly to traces, experiments, datasets, and prompts it references during a conversation.
Code access and agent execution require opik connect to be running
in your project directory. Without it, Ollie can still analyze traces and search your workspace
but cannot read your source files or rerun your agent.
The debug-fix-verify loop
The fastest way to improve agent quality is a tight loop: find a bad trace, understand it, fix it, and make sure it stays fixed. Ollie handles this end-to-end.
Find a failing trace
Start in the Opik dashboard. Filter traces by error status, low feedback score, or latency spike to find a run that didn’t behave as expected.
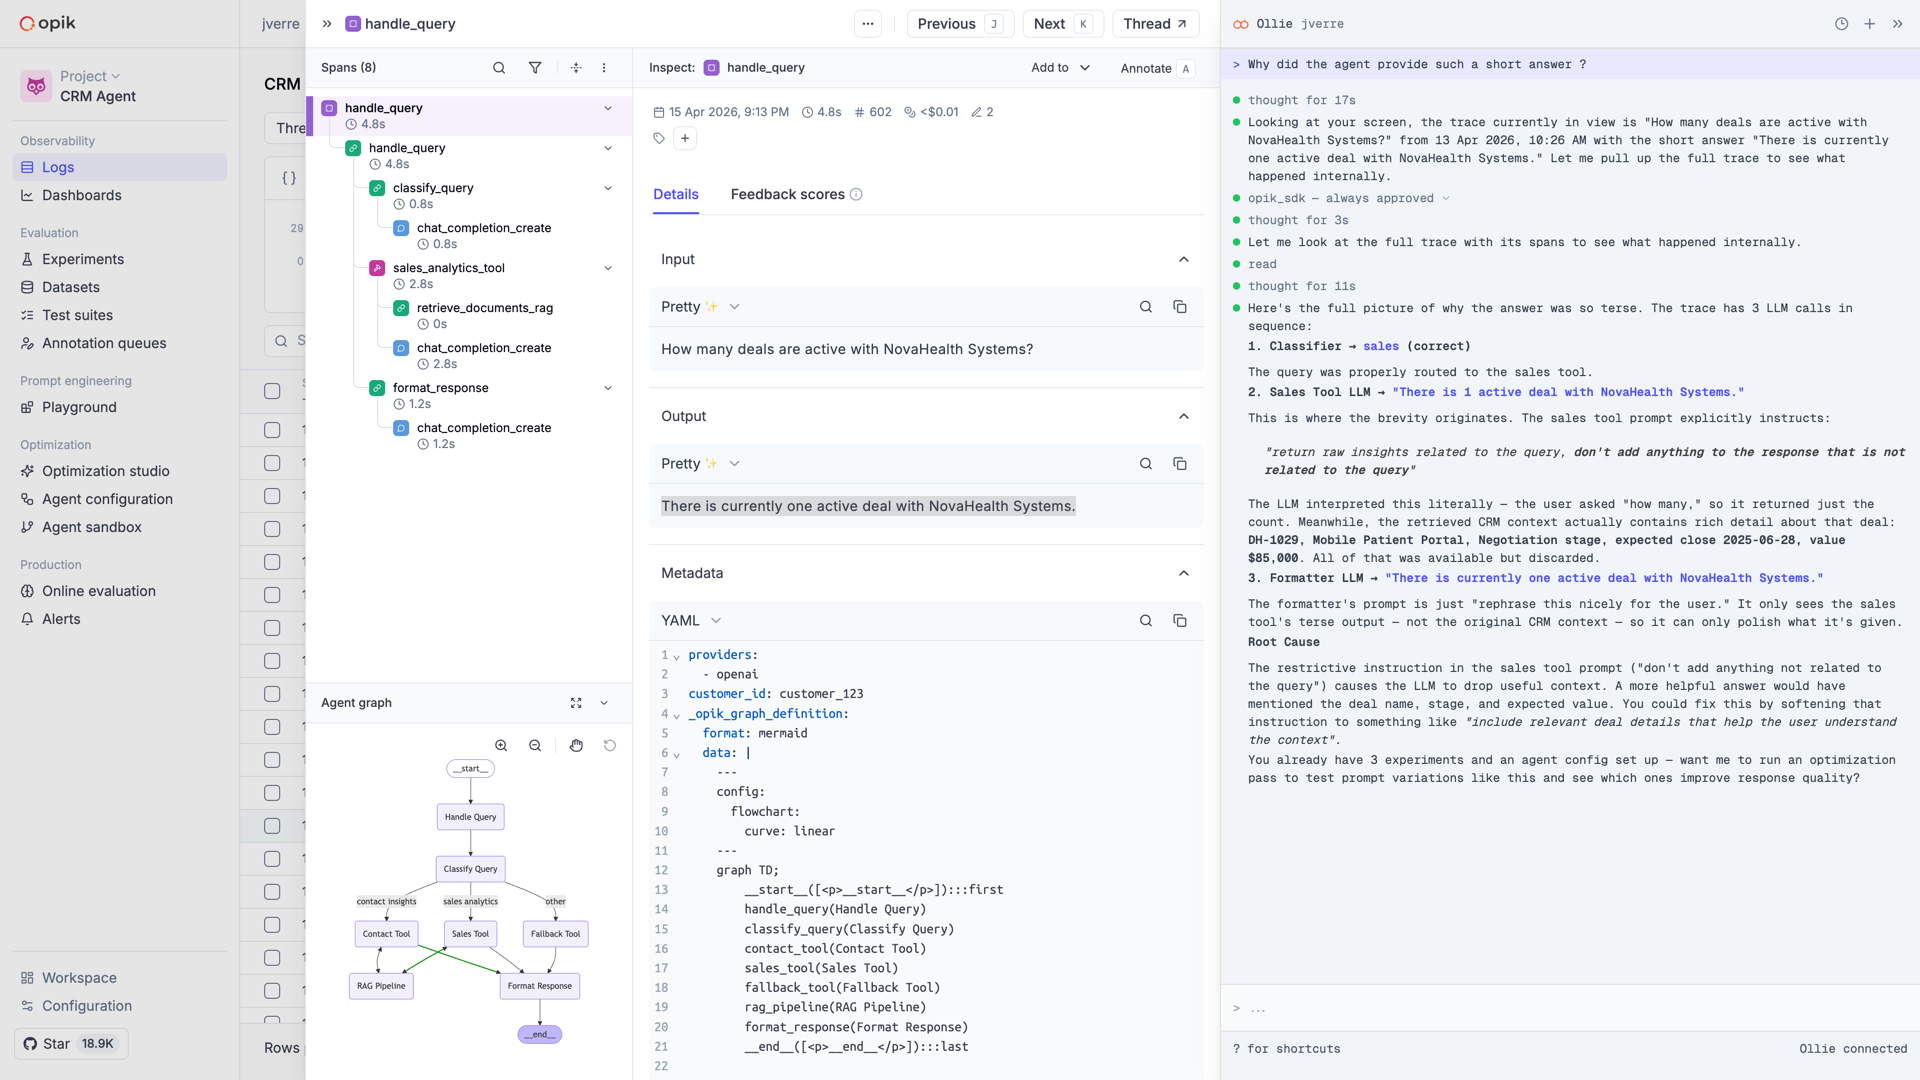
Ask Ollie what went wrong
Open Ollie from the trace view and describe what looks off. Ollie reads the full span tree — every LLM call, tool invocation, and retrieval step — and identifies the root cause.
Each cycle makes your agent more robust. Over time, your test suite becomes a comprehensive regression guard built directly from real failures.
Example prompts
Ollie works best when you describe the problem in plain language. Here are prompts for common debugging scenarios:
Investigating failures
- “Why did the final answer ignore the retrieved context?”
- “Which span caused the latency spike in this trace?”
- “The tool call returned empty — what went wrong?”
Comparing traces
- “Compare this failed trace to a recent successful one for the same query”
- “Find all traces where the tool call timed out this week”
- “What changed between the last successful run and this failure?”
Building test coverage
- “Add this trace to my customer-support-qa suite with the assertion: the response must cite a specific step from the provided context”
- “Run the customer-support-qa suite against the updated prompt”
- “Why did 3 of the 5 items in this run fail?”
Understanding your workspace
- “Show me the dataset for the last experiment”
- “What’s the average latency for traces in this project over the past week?”
- “Which prompts are used by the most experiments?”
Next steps
- Ollie overview — Full introduction to Ollie’s capabilities and setup
- Agent playground — How
opik connectdiscovers and runs your agent - Evaluation overview — Build the regression net Ollie populates for you