

Diagnostics
Skimming traces for recurring failures doesn’t scale once your agent is handling real traffic. Diagnostics scans your project’s traces on a schedule, groups repeated failures into a single issue, and surfaces a root cause, a suggested fix, and the traces to prove it, so you catch problems before your users report them.
How it works
Diagnostics is powered by Ollie, so it doesn’t rely on fixed rules or thresholds. It reads full traces the same way you would, looking for patterns like tool-call loops, malformed API calls, hallucinated outputs, or latency regressions.
- Daily scans: once enabled, Opik automatically scans each project’s traces from the last 24 hours every day at 00:05 UTC.
- On-demand scans: click Run diagnostic at any time to analyze the last 24 hours immediately, without waiting for the daily schedule.
- Deduplicated issues: matching failures across traces are grouped into a single issue rather than reported one by one, so a bug that shows up in 40 traces still only needs one fix.
Diagnostics requires the Ollie AI assistant to be enabled for your workspace. Scans run on your Ollie tokens, see the settings dialog for billing details.
Turning on diagnostics
The first time you open a project’s Diagnostics page, you’ll be prompted to turn it on. Once enabled, a scan kicks off immediately, and then runs automatically every day.
Reviewing issues
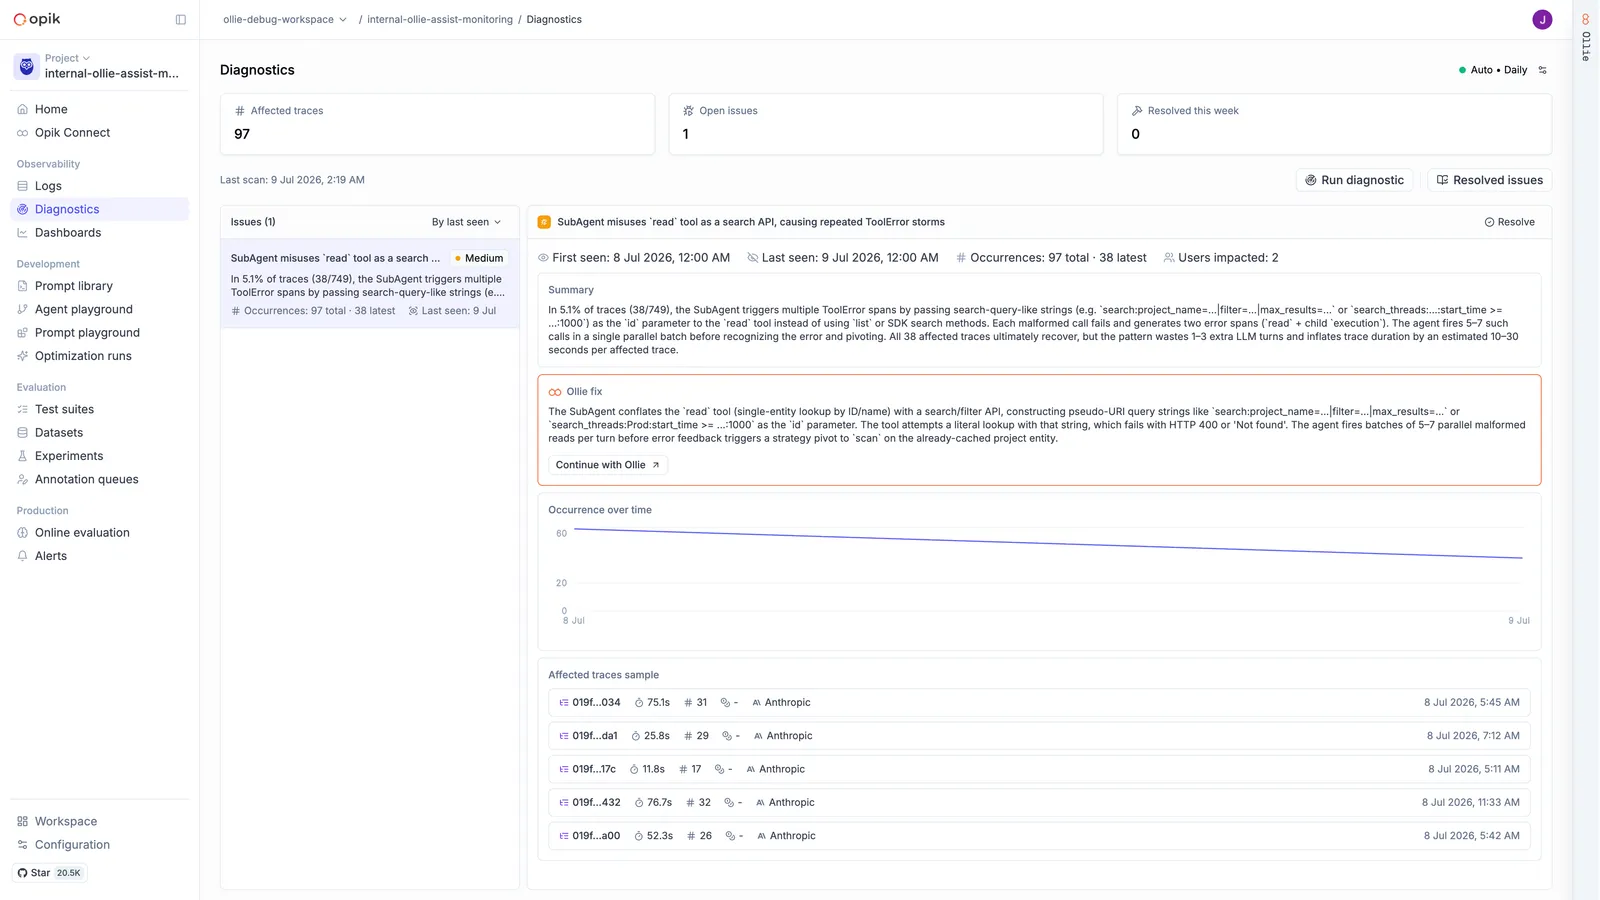
Each issue in the list shows its severity (critical, high, medium, or low), how many times
it’s occurred, and when it was last seen, so you can sort and prioritize before opening any single
issue.
Opening an issue shows:
- First seen / last seen and occurrences (total and in the latest scan)
- Users impacted
- Summary: what Ollie found, in plain language
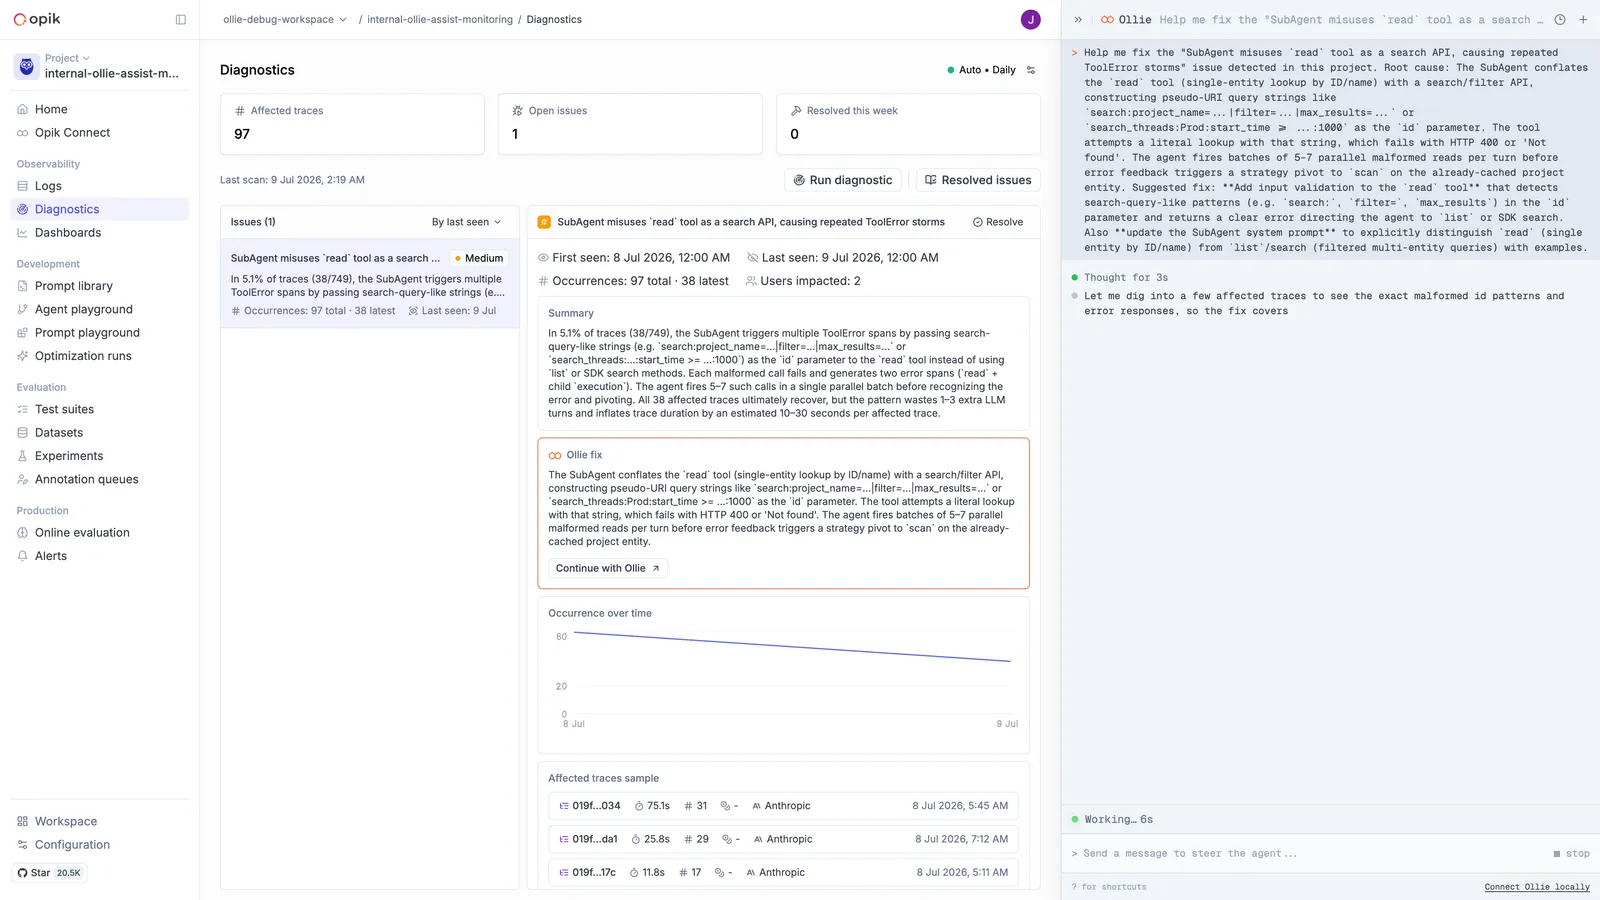
- Ollie fix: the likely root cause and a suggested fix, with a Continue with Ollie button that hands off to the Ollie chat sidebar to dig deeper or apply a code fix directly
- Occurrence over time: a chart of how often the issue has fired since it was first detected
- Affected traces sample: a handful of traces that show the issue, linking directly to the trace view
Resolving issues
Once you’ve fixed the underlying problem, click Resolve on the issue. Resolved issues move to the Resolved issues page, where you can reopen them at any time if the pattern comes back.
Settings
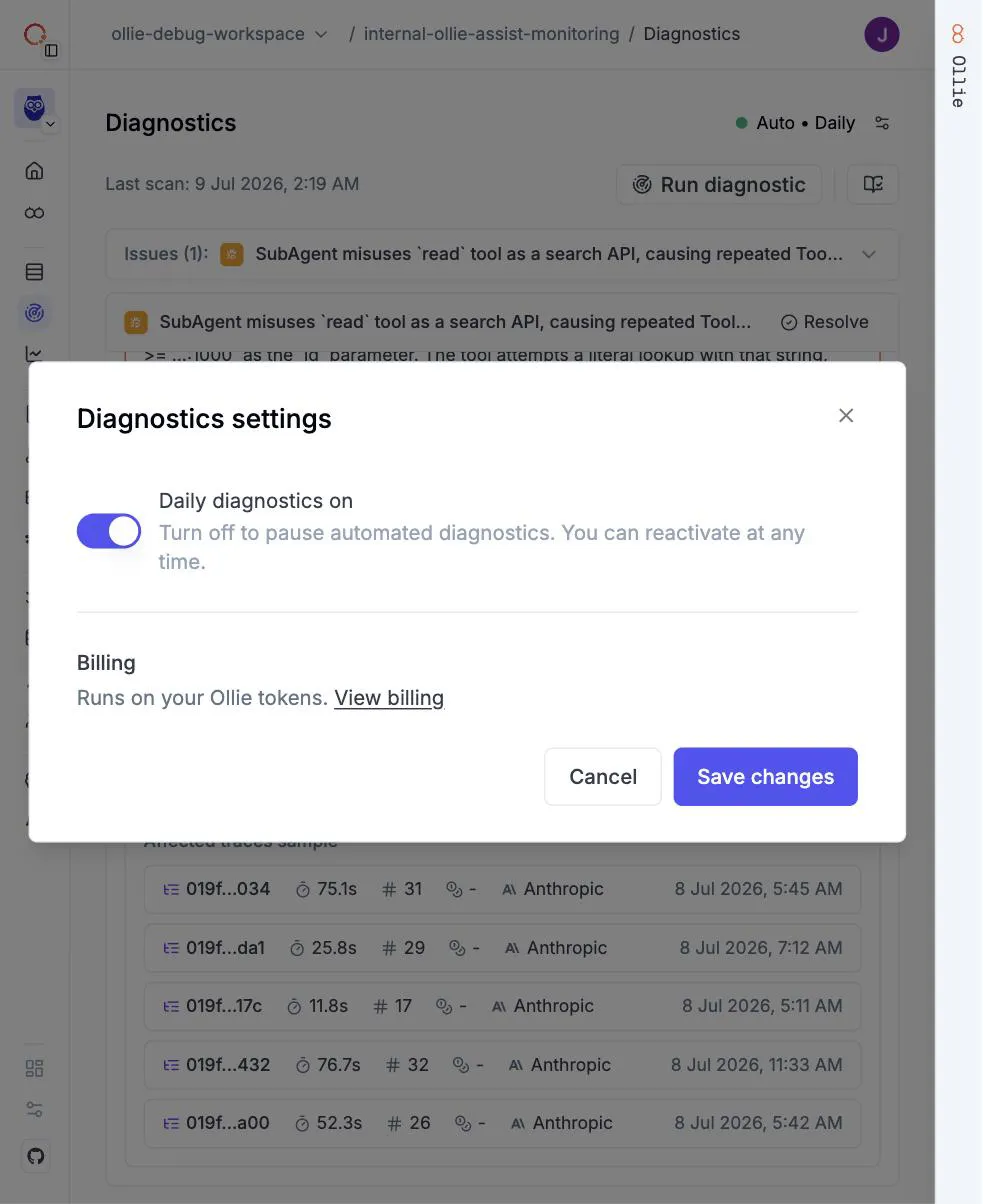
Use the settings icon next to Run diagnostic to turn the daily automated scan on or off. This doesn’t affect on-demand scans: you can still click Run diagnostic manually while automated scans are paused.
Next steps
- Ollie overview: what Ollie can do and how to set it up
- Debugging agents with Ollie: take a single failing trace from root cause to verified fix
- MCP server: give your AI coding assistant full visibility of your application, so it can pick up a detected issue, fix it in your editor, and verify with your test suite
- Alerts: get notified in Slack, PagerDuty, or a custom webhook for specific events