

Export data
Opik gives you several ways to export the data you’ve logged — pick the one that fits your workflow.
SDK
The Python and TypeScript SDKs let you search and export traces, spans, and threads programmatically.
Traces
Python
TypeScript
Spans
Threads
Filtering with OQL
All search methods accept a filter_string / filterString using the Opik Query Language (OQL):
- String values must be wrapped in double quotes
- Multiple conditions can be combined with
AND(OR is not supported) - DateTime fields require ISO 8601 format (e.g.,
"2024-01-01T00:00:00Z") - Use dot notation for nested fields:
metadata.model,feedback_scores.accuracy
Common filter examples:
The full list of supported columns per entity type is documented below.
Exporting at scale
Read operations are rate limited per workspace. The search and listing endpoints used for export — search_traces and search_spans (and the underlying GET /traces and GET /spans endpoints) — are capped at 30 requests per minute per workspace. Exceeding a limit returns 429 Too Many Requests with a RateLimit-Reset header telling you how long to wait. See the rate-limit FAQ for the full list.
That budget is small, so how you fetch matters:
- Fetch in bulk, not item-by-item. A single
search_spanscall streams up to 2,000 rows per underlying request, auto-paginates, and backs off on429, so one call can return thousands of spans without ever erroring. Avoid making one request per trace. - Filter on the server with
filter_string(e.g. a time window) so you only transfer the data you need. - Go easy on concurrency. Limits are shared per workspace, so parallel requests compete for the same budget and hit
429sooner without finishing faster.
REST API
Use the /traces and /spans endpoints to export data. Both endpoints are paginated.
The REST API filter parameter has limited flexibility as it was designed for use with the Opik UI.
For complex queries, use the SDK instead. These endpoints are also rate limited and do not back off
on their own — for large exports, prefer the SDK (see Exporting at scale) or
implement your own retry on 429 that honors the RateLimit-Reset header.
UI
Select the traces or spans you want to export in the Opik dashboard and click Export CSV in the Actions dropdown.
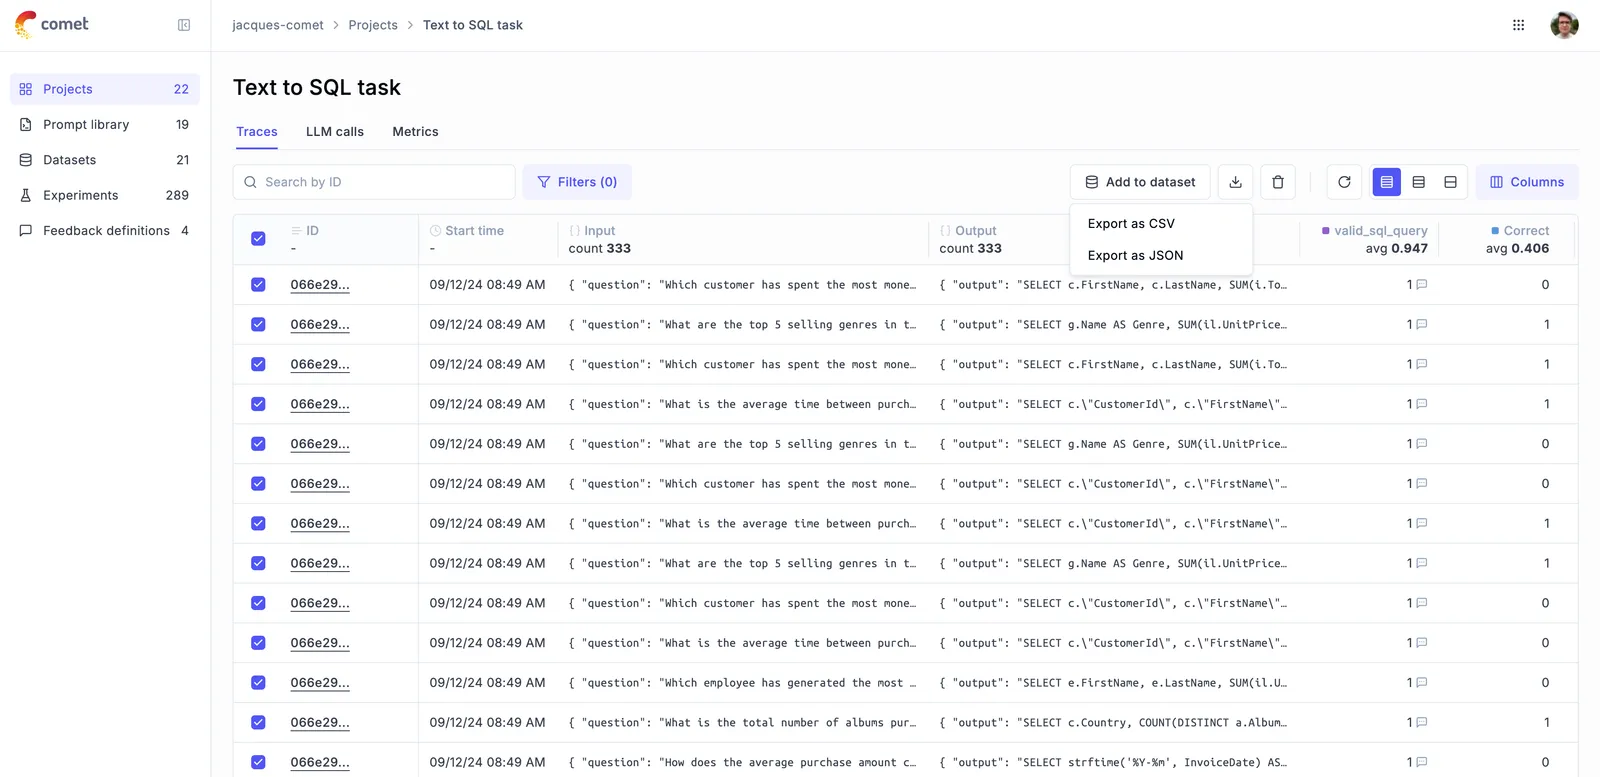
The UI exports up to 100 traces or spans at a time. For larger exports use the SDK or CLI.
Command-line tools
The opik export and opik import commands let you export traces, spans, datasets, prompts, and experiments for a project to local JSON or CSV files, and import them back — useful for migrations, backups, and cross-environment syncs. Every command is scoped to a single project, named right after the workspace.
On disk, folders and files are keyed by ID: data lands under <path>/<workspace>/projects/<project_id>/, with a project.json ({"id", "name"}) and id-named item files (dataset_<id>.json, prompt_<id>.json, experiment_<id>.json, trace_<id>.json). Human names are stored as data inside the files — this keeps paths free of /, :, and spaces. You still pass project and item names on the command line; the CLI resolves names ↔ IDs for you.
Export
ITEM is one of: all, dataset, traces, experiment, prompt
Import
WORKSPACE is the source workspace — used to locate the exported files under <path>/WORKSPACE/projects/. Use --to-workspace to write into a different destination workspace.
The project name is matched against the name recorded in each exported project.json. Import uses the same --path as export (both resolve <path>/<workspace>/projects/<id>/), so no path juggling is needed. Use --to-project <NAME> to import into a different destination project, or --to-workspace <NAME> to import into a different workspace (the source WORKSPACE argument is still used to locate the files on disk).
Imports are automatically resumable — if interrupted, re-run the same command and it picks up where it left off using a local migration_manifest.db.
Imported trace and span IDs
Imported traces and spans are created under new IDs. The same export can therefore be imported repeatedly, and into any project or workspace, without colliding with the originals — IDs are expected to be unique across an Opik deployment, and much of Opik’s behaviour, aggregation included, relies on that.
Nothing else about the trace changes. start_time and end_time keep their original values, span hierarchies and feedback scores are remapped onto the new IDs, and each imported trace records the ID it came from in its metadata as _import_id, so you can map an imported trace back to the source one. Traces are imported in the order the source project listed them, so the destination trace list and thread view keep that order.
A new ID also carries the current time in its UUIDv7 prefix. That matters because Opik validates that an ingested ID’s embedded timestamp falls inside an ingestion window around now — 24 hours by default on Opik Cloud — which is what keeps its storage layer partitioned correctly. Minting IDs at import time is what lets you import exported data of any age.
One consequence is worth knowing before a large import: the time-bucketed project metrics key off the ID timestamp, so imported traces are counted at the time of the import rather than when they originally ran. The traces themselves are unaffected — start_time still holds the original time, and filtering or sorting on it behaves as you would expect.
If an import fails with an error like this one:
you are running an older SDK, which derived the new trace ID from the exported trace’s original timestamp. Check your version and upgrade:
Migrating between environments
See the CLI help (opik export --help / opik import --help) for all options and troubleshooting.