client.get_prompt() and client.get_chat_prompt() now cache results in-process, so repeated calls inside a hot path skip the network round-trip entirely. Pinned commits are cached indefinitely; latest-version lookups use a 5-minute TTL that refreshes in the background so your code always gets a reasonably fresh value without blocking.
What’s new:
OPIK_PROMPT_CACHE_TTL_SECONDS to adjust the freshness window (default: 300 s)no_cache=True / noCache: true to force a live fetch from the backend@track context, the prompt ID and commit are automatically recorded in the trace metadata so you know which version was used at inference timeopik connect CLI ImprovementsThe opik connect and opik endpoint CLI commands have been reorganized with a much better error experience:
~/.opik.config file exists, opik connect now offers to run opik configure automatically (skipped in non-interactive / headless environments)OpikADKOtelTracer was killing all active OpenTelemetry spans and re-patching the ADK exporter on every request; the patcher is now idempotent and preserves user-configured OTel pipelinesspan.end(), span.update(), trace.end(), or trace.update() no longer clears the environment field set at creation time/datasets/items/stream call; under high request volume this was pushing database CPU to 80–99%, it now uses a direct primary-key lookup insteadAnd much more! 👉 See full commit log on GitHub
Releases: 2.0.32, 2.0.33, 2.0.34, 2.0.35, 2.0.36, 2.0.37
Here are the most relevant improvements we’ve made since the last release:
You can now tag traces, spans, and threads with an environment field — production, staging, dev, or any label you define. This makes it easy to separate signal from noise: filter your project’s trace view to only production issues, or compare behavior between environments without spinning up separate projects.
What’s new:
production vs staging in a single projectenvironment to @track, opik.trace(), or opik.span() — and it’s preserved through .end() and .update() callsenvironment on trace and span creationTest suite assertions can now look inside a trace — not just the top-level input/output — to reason about tool calls, intermediate LLM steps, and sub-agent behavior. The evaluator LLM gets access to two on-demand tools: get_trace_spans (lists all sub-spans for the trace) and read (fetches a specific span by ID) — so it can drill into exactly what happened at each step.
Why it matters: Previously, an assertion could only see what went in and came out of the agent. Now it can check whether the right tool was called, which model was used in an intermediate step, or whether a specific span had an error — enabling far more meaningful correctness checks for complex agents.
Traces and spans tables no longer download attachment bytes (images, PDFs) when loading a list — attachments are lazy-loaded only when you open an individual trace. In our benchmarks with image and PDF attachments, this reduced the per-page payload from 85 MB → 0.13 MB and load time from 3.4 s to 0.1 s.
Why it matters: If any of your traces include file attachments, the table was silently fetching all that binary data on every page load. The experience is now fast regardless of attachment size or count.
The Playground’s reasoning_effort control now tracks OpenAI’s actual per-model capability matrix. Models like gpt-5.1 that support a "none" option show it; models that don’t support reasoning effort have the control hidden automatically. Previously, the UI could get out of sync with what the backend supported.
Several reliability fixes and small improvements to the Python (and TypeScript) SDKs:
search_traces() and search_spans() now automatically wait and retry on 429 responses instead of raising an error, so large bulk searches complete reliably under API rate limitsAnd much more! 👉 See full commit log on GitHub
Releases: 2.0.25, 2.0.26, 2.0.27, 2.0.28, 2.0.29, 2.0.30, 2.0.31
This is our biggest release yet! A fundamental rethink of how you build, debug, and improve AI agents with Opik. Three major new feature groups (Ollie, Test Suites, and the Agent Playground) work together to close the loop from observing a problem to shipping a fix, all without leaving the platform. Alongside them, we’ve reorganized everything around projects, redesigned the core trace experience, and rebuilt the navigation to match. Here’s what’s new:
Ollie is a powerful coding agent built into the Opik UI. It has full access to your project’s traces and logs, and can analyze patterns across hundreds of interactions, diagnose issues, and take action to fix them, all without leaving the platform.

Highlights:
opik connect, with support for --workspace and --api-key flagsTest Suites bring structured regression testing to agent development. Each suite has global rules that every test case must pass, plus item-level assertions for specific scenarios. Define rules in plain English for what your agent should and shouldn’t do, and get clear pass/fail results when you run them.

Highlights:
The Agent Playground connects to your agent so you can run it directly from the Opik UI. Experiment with different prompts, models, and parameters to see how your whole agent responds, without touching your code. Agent Configurations track and version the full set of prompts, models, and variables as a single unit, so you always know what combination worked.

Highlights:
AgentConfigManager and TypeScript AgentConfig with Zod schema validation and blueprint cachingProjects now map directly to your agents. Test suites, experiments, optimizations, prompts, datasets, alerts, and dashboards are all scoped to the project, giving you a focused view of everything related to a single agent, paired with a redesigned navigation and trace experience.

What’s new:
project_name scoping for datasets, experiments, optimizations, prompts, alerts, and dashboardsAnd much more! 👉 See full commit log on GitHub
Releases: 1.10.24 through 2.0.21
Here are the most relevant improvements we’ve made since the last release:
We’ve released opik-openclaw, a native OpenClaw plugin that gives you full-stack observability for your agents, powered by Opik. This brings enterprise-grade tracing, evaluation, and monitoring to the fastest-growing open-source agent framework.
What you get:
Get started in two minutes: install the plugin with openclaw plugins install @opik/opik-openclaw, configure your API key, and traces start flowing immediately. Works with both Opik Cloud and self-hosted instances.
👉 Visit the GitHub repository here
We’ve broadened the range of models and providers you can use across the platform, giving you more flexibility in how you build and evaluate your LLM applications.
What’s new:
openrouter/free is directly selectable, and openrouter/* route models including /auto are supported and prioritized in model selectionWe’ve continued to expand the capabilities of both the TypeScript and Python SDKs, making it easier to integrate Opik into your workflows programmatically.
What’s new:
searchThreads functionality in the TypeScript SDKWe’ve made the Optimization Studio more powerful and flexible, with new metrics, persistence, and a major Optimizer SDK update.
What’s new:
We’ve made several improvements to make your day-to-day workflow smoother and more intuitive.
What’s improved:
We’ve introduced prompt version tags, giving you a lightweight way to label and organize your prompt versions across the platform.
What’s new:
👉 Prompt Version Tags Documentation
And much more! 👉 See full commit log on GitHub
Releases: 1.10.11, 1.10.12, 1.10.13, 1.10.14, 1.10.15, 1.10.16, 1.10.17, 1.10.18, 1.10.19, 1.10.20, 1.10.21, 1.10.22, 1.10.23
Here are the most relevant improvements we’ve made since the last release:
We’ve significantly expanded the capabilities of both our Python and TypeScript SDKs, making it easier to integrate Opik into your workflows programmatically.
What’s new:
searchThreads functionality👉 Annotation Queues | Opik Query Language | Dataset Versioning
We’ve expanded our LLM provider support and improved integrations to give you more flexibility in your AI workflows.
What’s new:
We’ve made several improvements to make your day-to-day workflow smoother and more intuitive.
What’s improved:
And much more! 👉 See full commit log on GitHub
Releases: 1.9.102, 1.9.103, 1.9.104, 1.10.0, 1.10.1, 1.10.2, 1.10.3, 1.10.4, 1.10.5, 1.10.6, 1.10.7, 1.10.8, 1.10.9, 1.10.10
Here are the most relevant improvements we’ve made since the last release:
We’re excited to introduce Optimization Studio — a powerful new way to improve your prompts without writing code. Bring a prompt, define what “good” looks like, and Opik tests variations to find a better version you can ship with confidence.
What’s new:
For teams that prefer a programmatic workflow, we’ve also released Opik Optimizer SDK v3 with improved algorithms, better performance, and more intuitive APIs.
👉 Optimization Studio Documentation
We’ve enhanced the dashboard with new widgets and visualization capabilities to help you track and compare experiments more effectively.

What’s new:

We’ve added support for the latest video generation models, enabling you to track and log video outputs from your AI applications.
What’s new:
We’ve made it easier to organize and navigate your experiments with new filtering and tagging capabilities.
What’s improved:
We’ve made several improvements to make your day-to-day workflow smoother.
What’s improved:
We’ve improved our SDK integrations with better tracing and performance metrics.
What’s improved:
And much more! 👉 See full commit log on GitHub
Releases: 1.9.79, 1.9.80, 1.9.81, 1.9.82, 1.9.83, 1.9.84, 1.9.85, 1.9.86, 1.9.87, 1.9.88, 1.9.89, 1.9.90, 1.9.91, 1.9.92, 1.9.95, 1.9.96, 1.9.97, 1.9.98, 1.9.99, 1.9.100, 1.9.101
Here are the most relevant improvements we’ve made since the last release:
We’ve expanded the Playground with new provider support and enhanced functionality to make prompt experimentation more powerful.
What’s new:


We’ve made online evaluation more flexible and easier to manage across your projects.
What’s improved:

We’ve refined the user experience across the platform with improved responsiveness and dashboard polish.
What’s improved:
We’ve updated our SDKs with new capabilities and modernized dependencies.
What’s new:
evaluate() methodAnd much more! 👉 See full commit log on GitHub
Releases: 1.9.57, 1.9.58, 1.9.59, 1.9.60, 1.9.61, 1.9.62, 1.9.63, 1.9.64, 1.9.65, 1.9.66, 1.9.67, 1.9.68, 1.9.69, 1.9.70, 1.9.71, 1.9.72, 1.9.73, 1.9.74, 1.9.75, 1.9.76, 1.9.77, 1.9.78
Here are the most relevant improvements we’ve made since the last release:
Custom Dashboards are now live! 🎉

Our new dashboards engine lets you build fully customizable views to track everything from token usage and cost to latency, quality across projects and experiments.
📍 Where to find them?
Dashboards are available in three places inside Opik:
🧩 Built-in templates to get started fast
We ship dashboards with zero-setup pre-built templates, including Performance Overview, Experiment Insights and Project Operational Metrics.
Templates are fully editable and can be saved as new dashboards once customized.
🧱 Flexible widgets
Dashboards support multiple widget types:
Widgets support filtering, grouping, resizing, drag-and-drop layouts, and global date range controls.
Span-Level Metrics
Span-level metrics are officially live in Opik supporting both LLMaaJ and code-based metrics!
Teams can now EASILY evaluate the quality of specific steps inside their agent flows with full precision. Instead of assessing only the final output or top-level trace, you can attach metrics directly to individual call spans or segments of an agent’s trajectory.
This unlocks dramatically finer-grained visibility and control. For example:
New Support accessing full tree, subtree, or leaf nodes in Online Scores
This update enhances the online scoring engine to support referencing entire root objects (input, output, metadata) in LLM-as-Judge and code-based evaluators, not just nested fields within them.
Online Scoring previously only exposed leaf-level values from an LLM’s structured output. With this update, Opik now supports rendering any subtree: from individual nodes to entire nested structures.
You can now tag individual prompt versions (not just the prompt!).
This provides a clean, intuitive way to mark best-performing versions, manage lifecycles, and integrate version selection into agent deployments.
Now you can pass audio as part of your prompts, in the playground and on online evals for advanced multimodal scenarios.

Thread-level insights
Added new metrics to the threads table with thread-level metrics and statistics, providing users with aggregated insights about their full multi-turn agentic interactions:
Experiment insights
Added additional aggregation methods in headers for experiment items.
This new release adds percentile aggregation methods (p50, p90, p99) for all numerical metrics in experiment items table headers, extending the existing pattern used for duration to cost, feedback scores, and total tokens.
Support for GPT-5.2 in Playground and Online Scoring
Added full support for GPT 5.2 models in both the playground and online scoring features for OpenAI and OpenRouter providers.
Harbor Integration
Added a comprehensive Opik integration for Harbor, a benchmark evaluation framework for autonomous LLM agents. The integration enables observability for agent benchmark evaluations (SWE-bench, LiveCodeBench, Terminal-Bench, etc.).
👉 Harbor Integration Documentation
And much more! 👉 See full commit log on GitHub
Releases: 1.9.41, 1.9.42, 1.9.43, 1.9.44, 1.9.45, 1.9.46, 1.9.47, 1.9.48, 1.9.49, 1.9.50, 1.9.51, 1.9.52, 1.9.53, 1.9.54, 1.9.55, 1.9.56
Here are the most relevant improvements we’ve made since the last release:
We’ve enhanced dataset functionality with several key improvements:
Edit Dataset Items - You can now edit dataset items directly from the UI, making it easier to update and refine your evaluation data.
Remove Dataset Upload Limit for Self-Hosted - Self-hosted deployments no longer have dataset upload limits, giving you more flexibility for large-scale evaluations.
Dataset Item Tagging Support - Added comprehensive tagging support for dataset items, enabling better organization and filtering of your evaluation data.
Dataset Filtering Capabilities by Any Column - Filter datasets by any column in both the playground and dataset view, giving you flexible ways to find and work with specific data subsets.
Ability to Rename Datasets - Rename datasets directly from the UI, making it easier to organize and manage your evaluation datasets.
We’ve made significant improvements to experiment management and analysis:
Experiment-Level Metrics - Compute experiment-level metrics (as opposed to experiment-item-level metrics) for better insights into your evaluation results. Read more in the experiment-level metrics documentation.
Rename Experiments & Metadata - Update experiment names and metadata config directly from the dashboard, giving you more control over experiment organization.
Token & Cost Columns - Token usage and cost are now surfaced in the experiment items table for easy scanning and cost visibility.

We’ve made the Playground more powerful and easier to use for non-technical users:
Easy Navigation from Playground to Dataset and Metrics - Quick navigation links from the playground to related datasets and metrics, streamlining your workflow.
Advanced filtering for Playground Datasets - Filter playground datasets by tags and any other columns, making it easier to find and work with specific dataset items.
Pagination for the Playground - Added pagination support to handle large datasets more efficiently in the playground.
Added Experiment Progress Bar in the Playground - Visual progress indicators for running experiments, giving you real-time feedback on experiment status.
Added Model-Specific Throttling and Concurrency Configs in the Playground - Configure throttling and concurrency settings per model in the playground, giving you fine-grained control over resource usage.
We’ve expanded alert capabilities with threshold support:
Added Threshold Support for Trace and Thread Feedback Scores - Configure thresholds for feedback scores on traces and threads, enabling more precise alerting based on quality metrics.
Added Threshold to Trace Error Alerts - Set thresholds for trace error alerts to get notified only when error rates exceed your configured limits.
Trigger Experiment Created Alert from the Playground - Receive alerts when experiments are created directly from the playground.
Significant enhancements to the Opik Optimizer:
Cost and Latency Optimization Support - Added support for optimizing both cost and latency metrics simultaneously. Read more in the optimization metrics documentation.
Training and Validation Dataset Support - Introduced support for training and validation dataset splits, enabling better optimization workflows. Learn more in the dataset documentation.
Example Scripts for Microsoft Agents and CrewAI - New example scripts demonstrating how to use Opik Optimizer with popular LLM frameworks. Check out the example scripts.
UI Enhancements and Optimizer Improvements - Several UI enhancements and various improvements to Few Shot, MetaPrompt, and GEPA optimizers for better usability and performance.
Improved usability across the platform:
Added has_tool_spans Field to Show Tool Calls in Thread View - Tool calls are now visible in thread views, providing better visibility into agent tool usage.
Added Export Capability (JSON/CSV) Directly from Trace, Thread, and Span Detail Views - Export data directly from detail views in JSON or CSV format, making it easier to analyze and share your observability data.
Expanded model support:
And much more! 👉 See full commit log on GitHub
Releases: 1.9.18, 1.9.19, 1.9.20, 1.9.21, 1.9.22, 1.9.23, 1.9.25, 1.9.26, 1.9.27, 1.9.28, 1.9.29, 1.9.31, 1.9.32, 1.9.33, 1.9.34, 1.9.35, 1.9.36, 1.9.37, 1.9.38, 1.9.39, 1.9.40
Here are the most relevant improvements we’ve made since the last release:
We have shipped 37 new built-in metrics, faster & more reliable LLM judging, plus robustness fixes.
New Metrics Added - We’ve expanded the evaluation metrics library with a comprehensive set of out-of-the-box metrics including:
LLM-as-a-Judge & G-Eval Improvements:
gpt-5-nano for faster, more accurate evalsEnhanced Preprocessing:
Robustness Improvements:

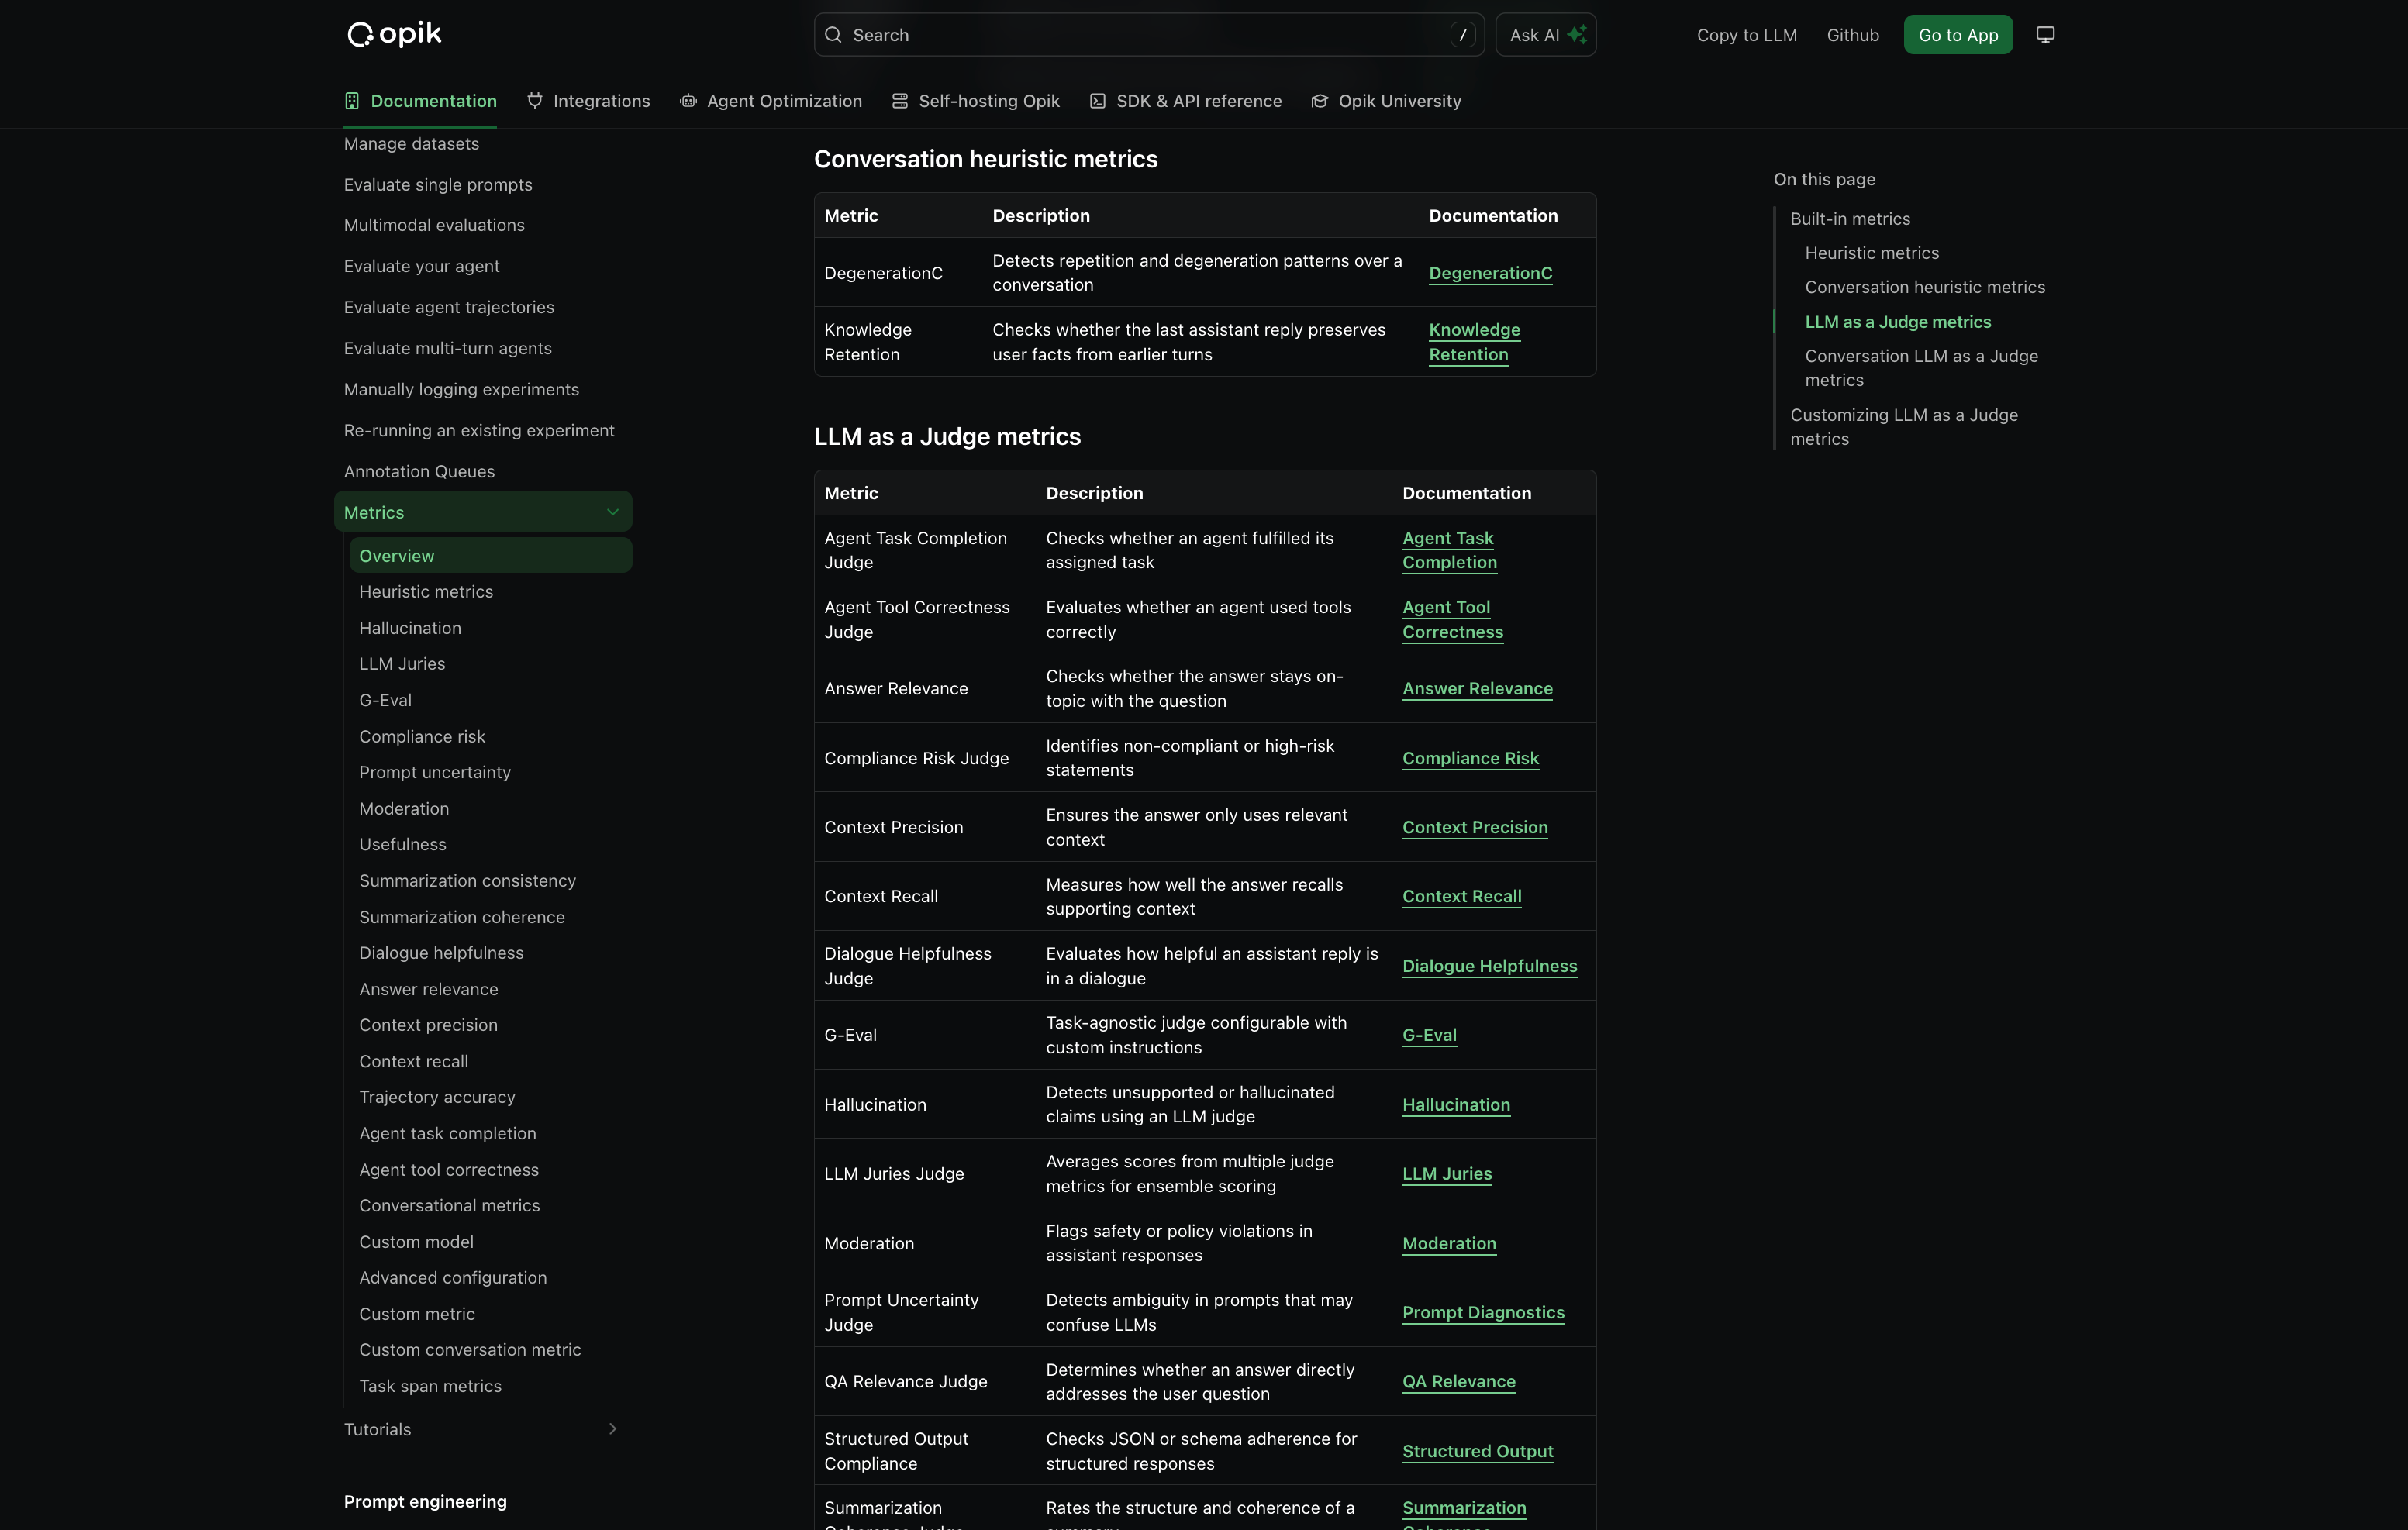
👉 Access the metrics docs here: Evaluation Metrics Overview
We’ve added support for PII (Personally Identifiable Information) redaction before sending data to Opik. This helps you protect sensitive information while still getting the observability insights you need.
With anonymizers, you can:
👉 Read the full docs: Anonymizers
We’ve expanded our alerting capabilities with new alert types and improved functionality:
These new alert types help you stay on top of your LLM application’s performance and costs, enabling proactive monitoring and faster response to issues.

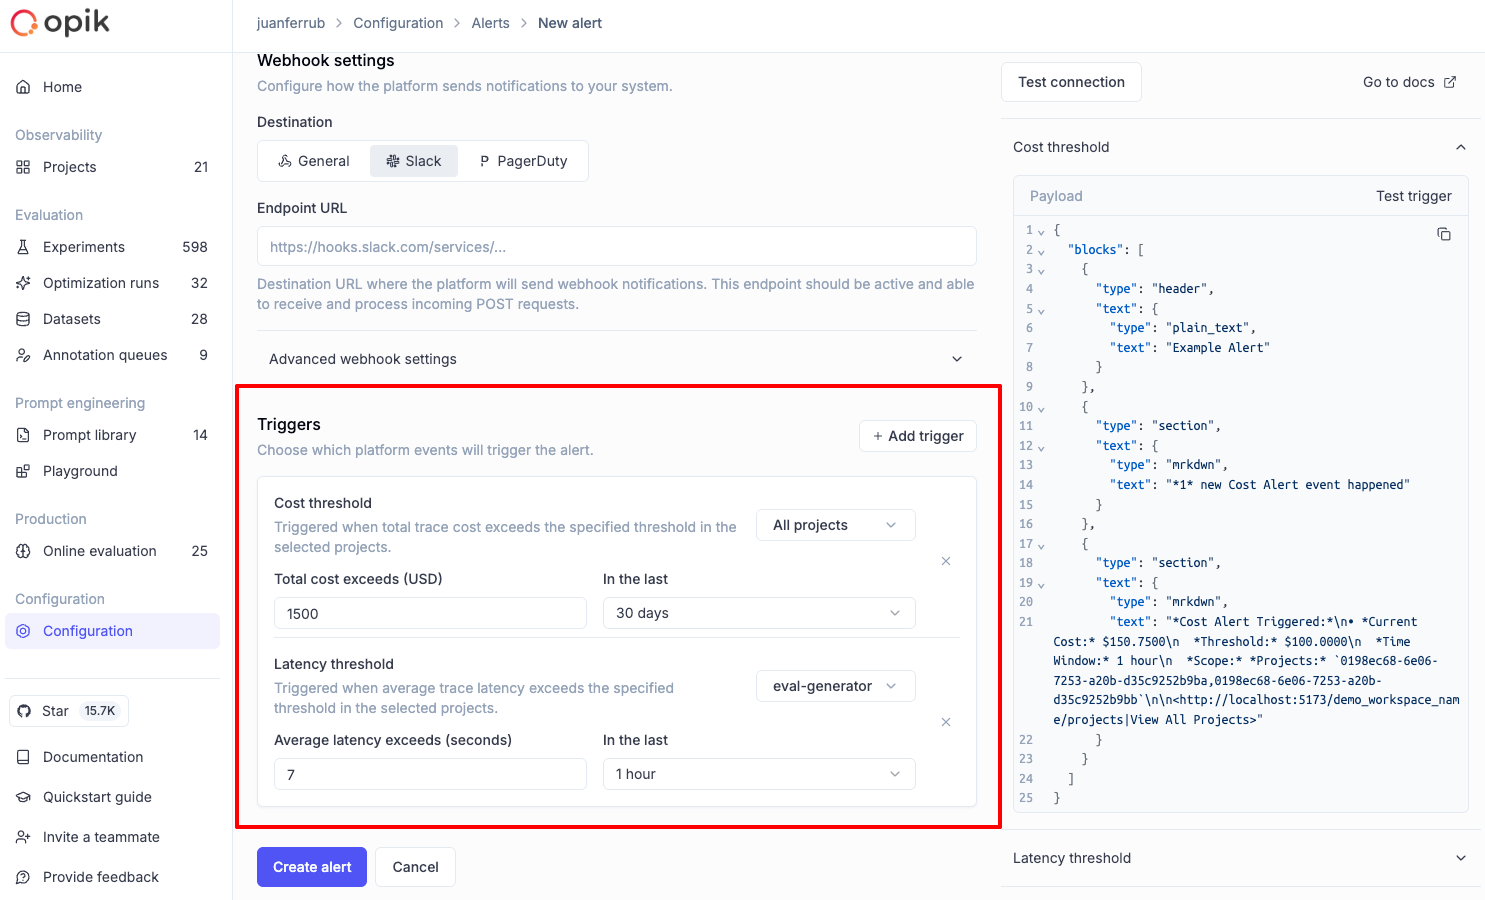
👉 Read more: Alerts Guide
We’ve significantly enhanced multimodal capabilities across the platform:
Video LLM-as-a-Judge - Added support for Video LLM-as-a-Judge, enabling evaluation of video content in your traces
Video Cost Tracking - Added cost tracking for video models, so you can monitor spending on video processing operations
Image support in LLM-as-a-Judge - Both Python and TypeScript SDKs now support image processing in LLM-as-a-Judge evaluations, allowing you to evaluate traces containing images
These enhancements make it easier to build and evaluate multimodal applications that work with images and video content.
We’ve improved support for custom AI providers with enhanced configuration options:
We’ve added several improvements to make evaluation and observability more powerful:
We’ve made several user experience enhancements across the platform:

And much more! 👉 See full commit log on GitHub
Releases: 1.8.98, 1.8.99, 1.8.100, 1.8.101, 1.8.102, 1.9.0, 1.9.1, 1.9.2, 1.9.3, 1.9.4, 1.9.5, 1.9.6, 1.9.7, 1.9.8, 1.9.9, 1.9.10, 1.9.11, 1.9.12, 1.9.13, 1.9.14, 1.9.15, 1.9.16, 1.9.17