Getting started with Observability
Opik makes it easy to add observability to your existing LLM application. The fastest way is to let your coding agent do it — install the Opik skill in Claude Code, Cursor, Codex, or any other coding agent and it will instrument your code for you. If you’d rather stay inside Opik, use Opik Connect to have Ollie set up tracing from the dashboard. You can also add tracing manually with the SDK.
Adding observability to your code
AI coding agent
Opik Connect
Manual integration
The fastest way to add observability is to install the Opik skill in your coding agent and let it instrument your code for you. The skill is compatible with Claude Code, Codex, Cursor, OpenCode and any other agent that supports skills.
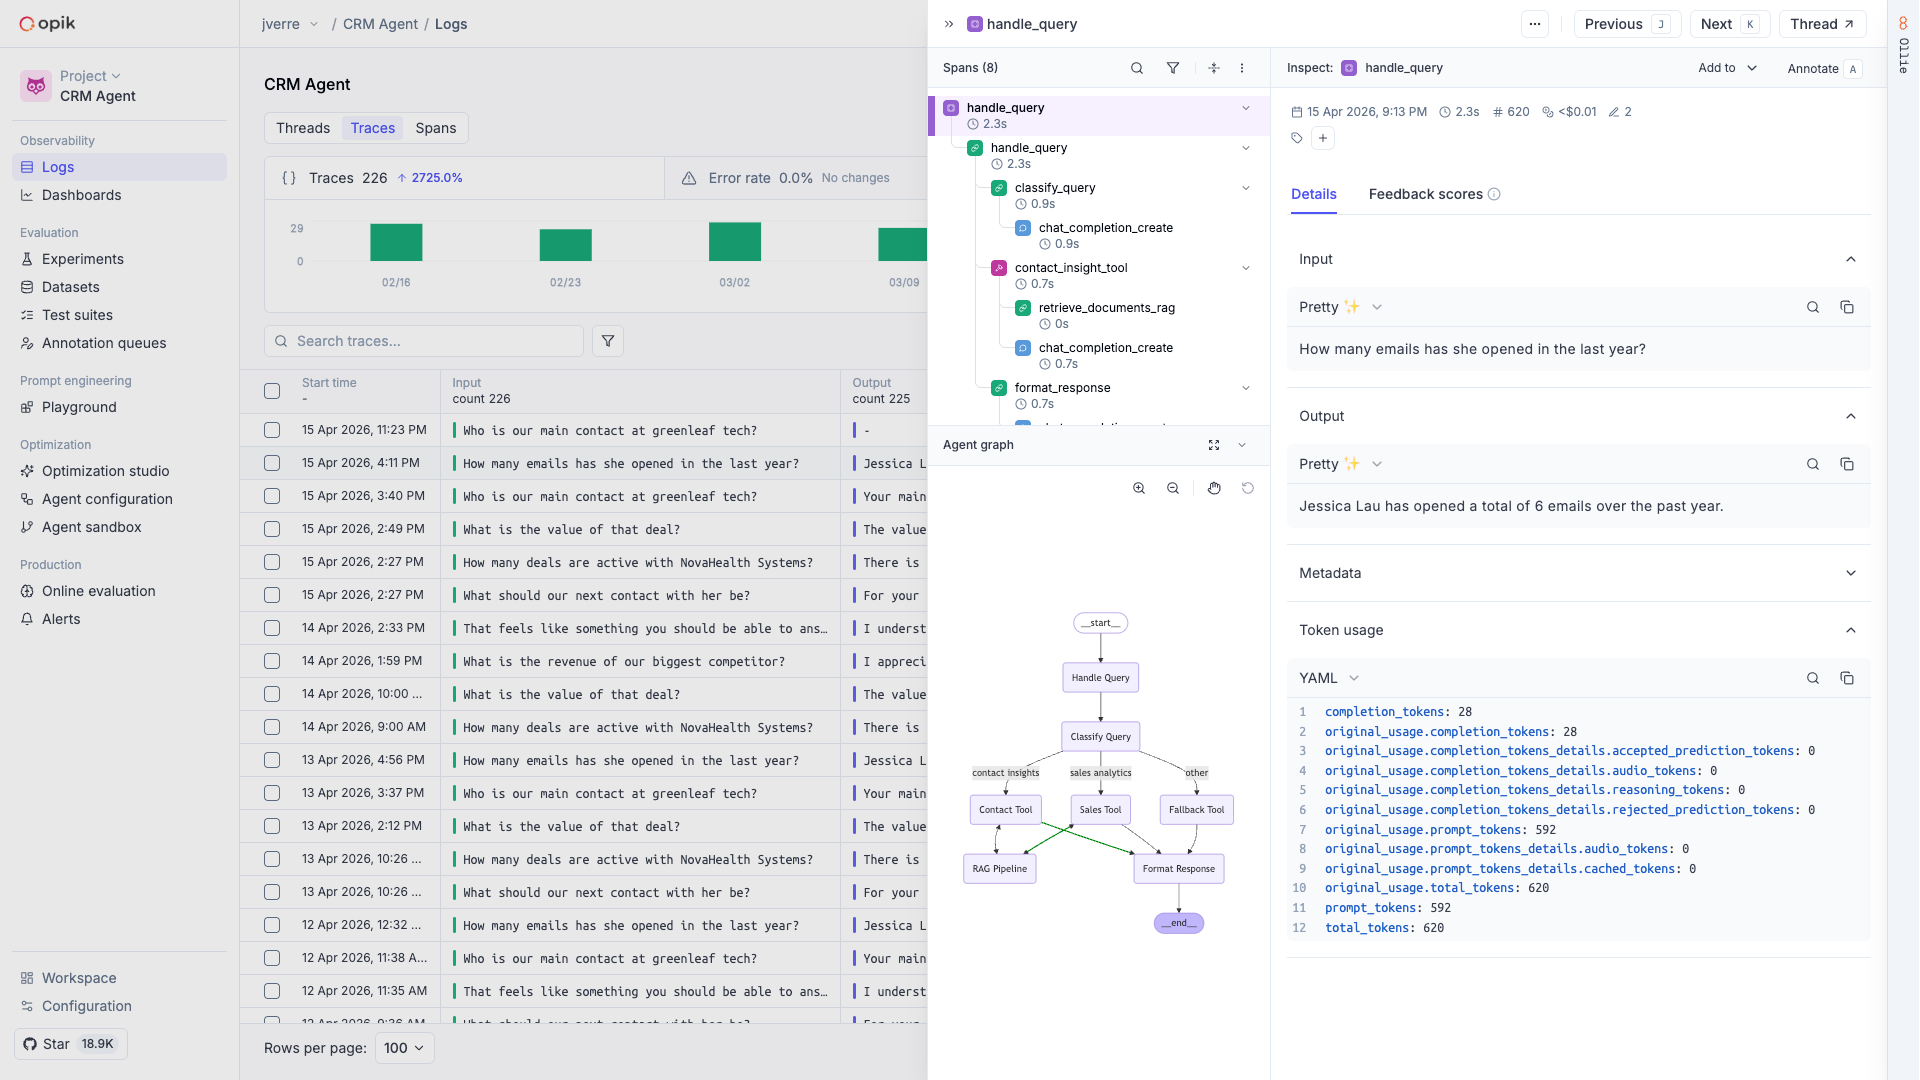
Viewing your traces
After running your application, traces will appear in the Opik dashboard. Each trace captures the full execution path of a request, including all nested spans, inputs, outputs, and timing information.
You can use Ollie to analyze your traces, identify issues in your agent’s behavior, and get actionable suggestions for improvement.
Next steps
- Concepts — Learn about traces, spans, threads, and feedback scores
- Log traces — In-depth guide on customizing what gets logged
- Cost tracking — Monitor token usage and spending