Opik Dashboard:
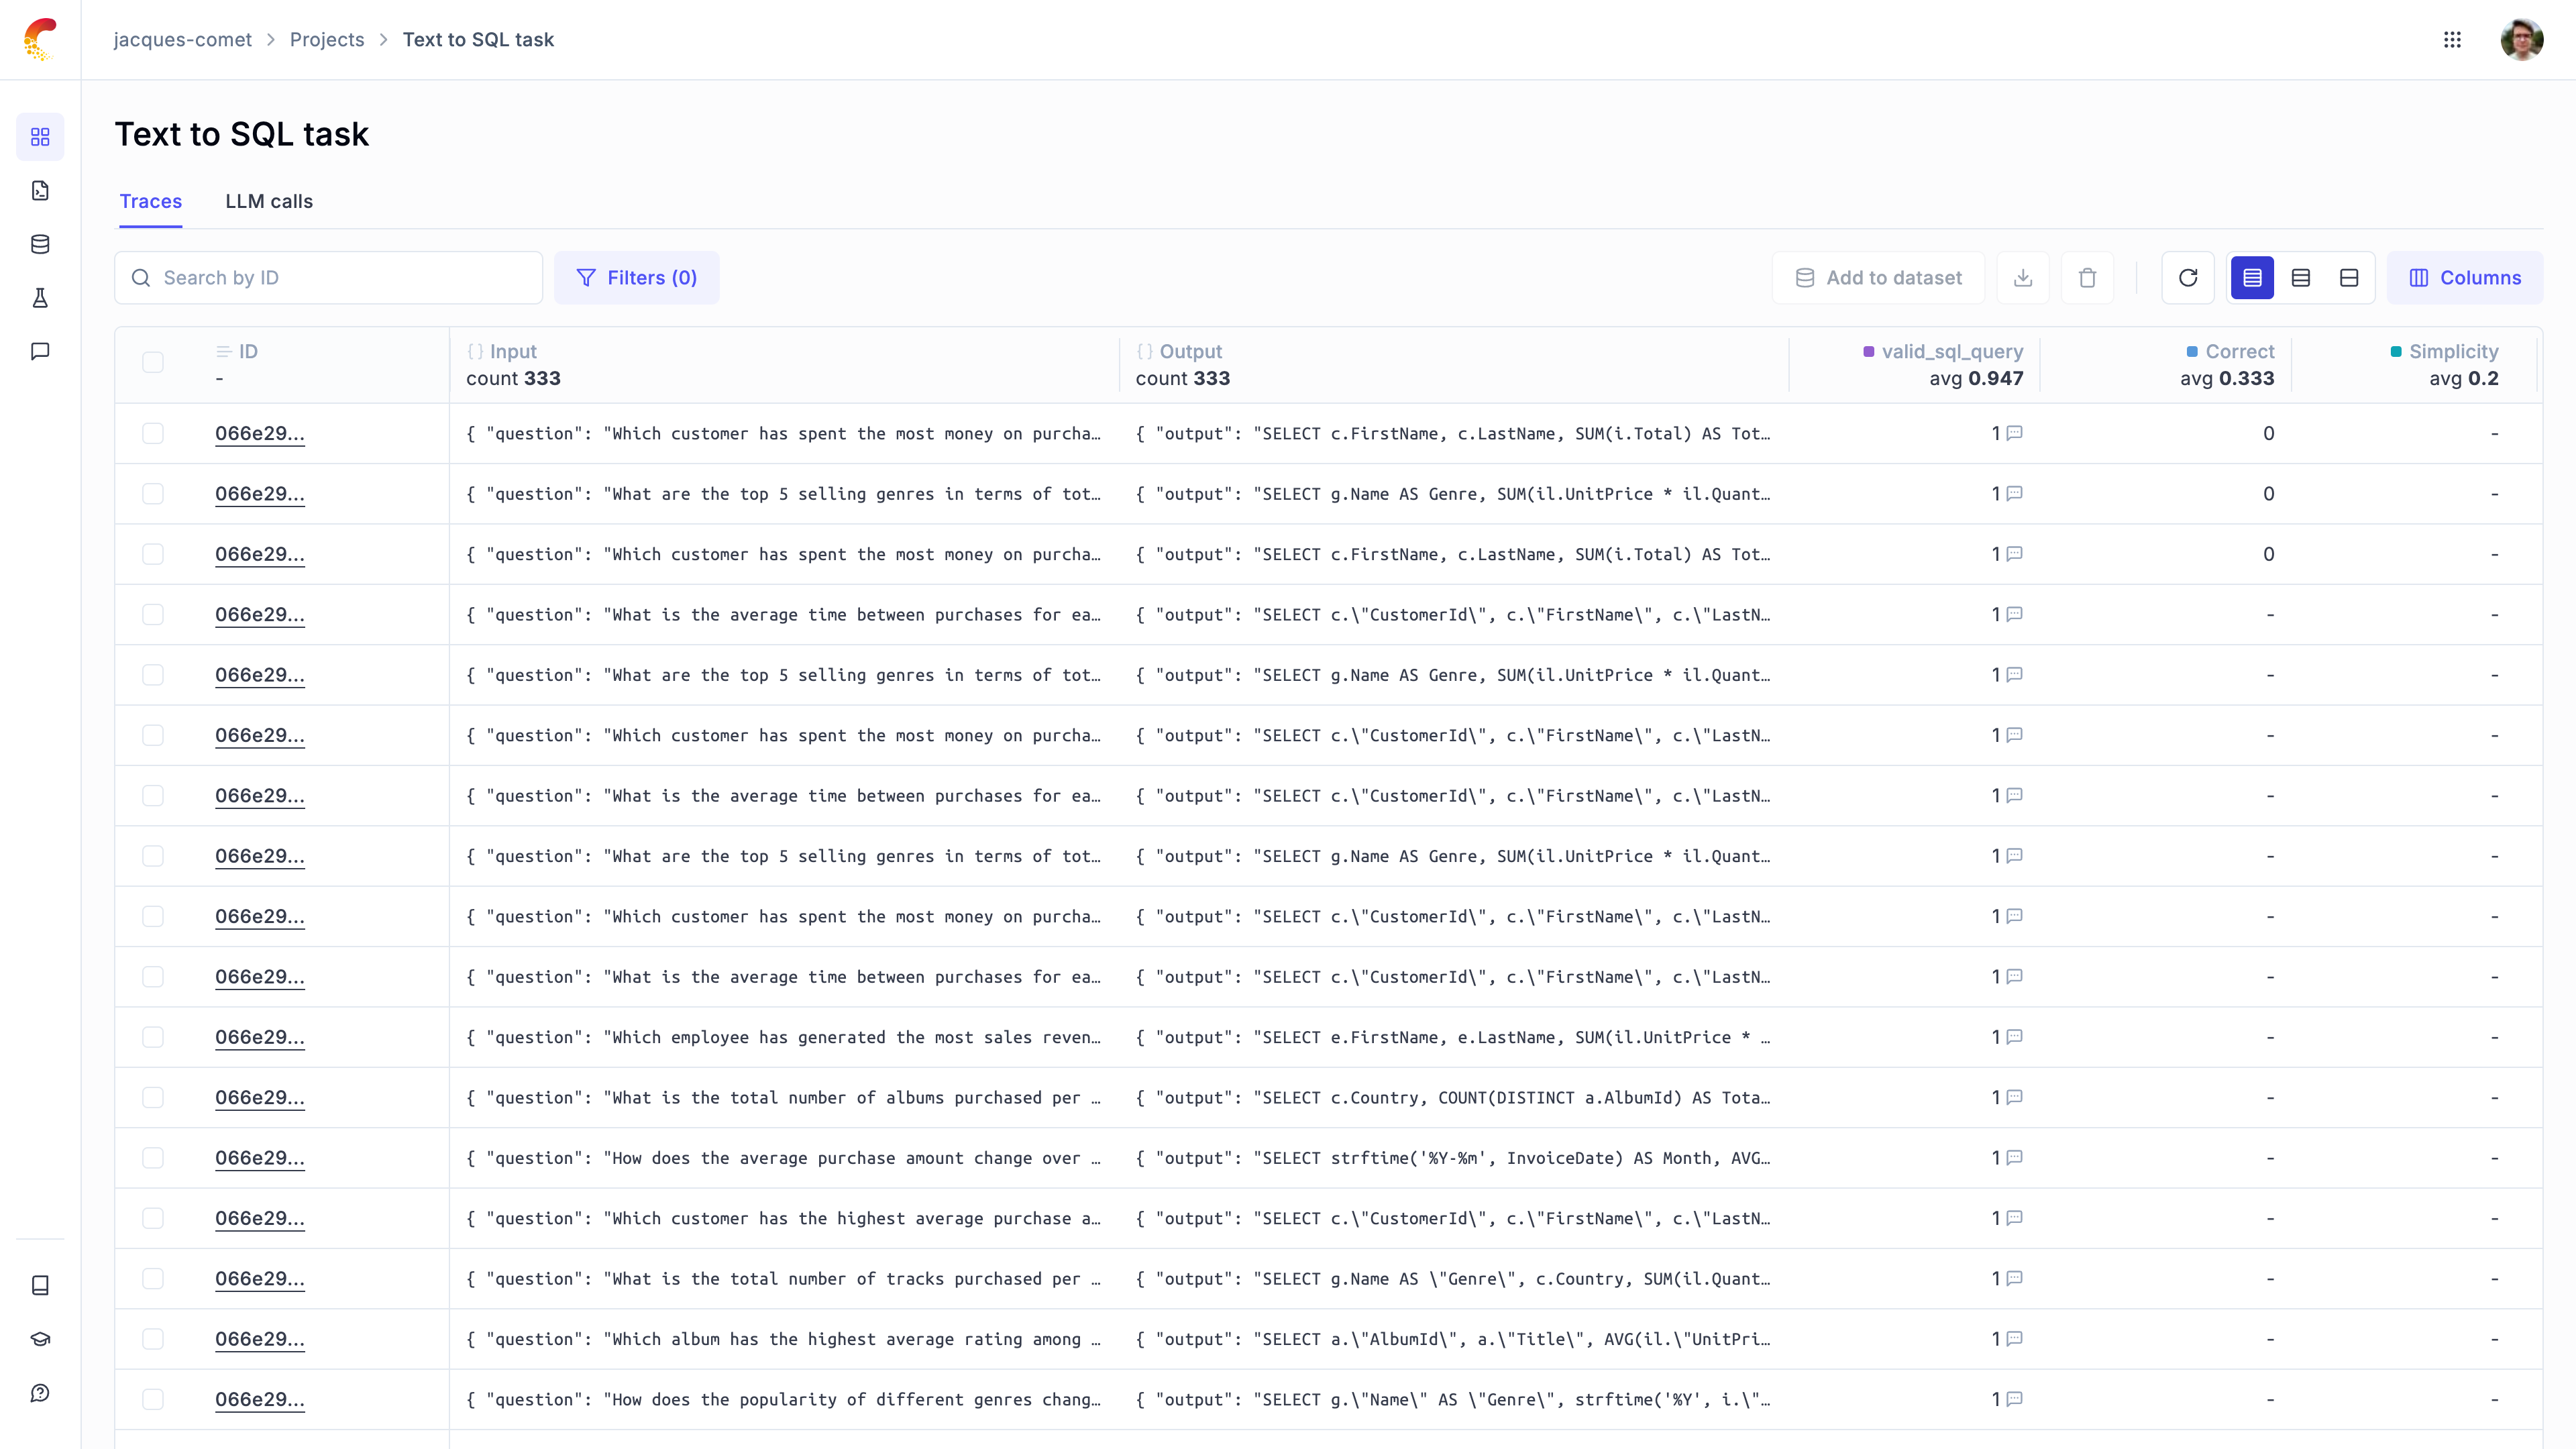
- Feedback scores are now displayed as separate columns in the traces and spans table
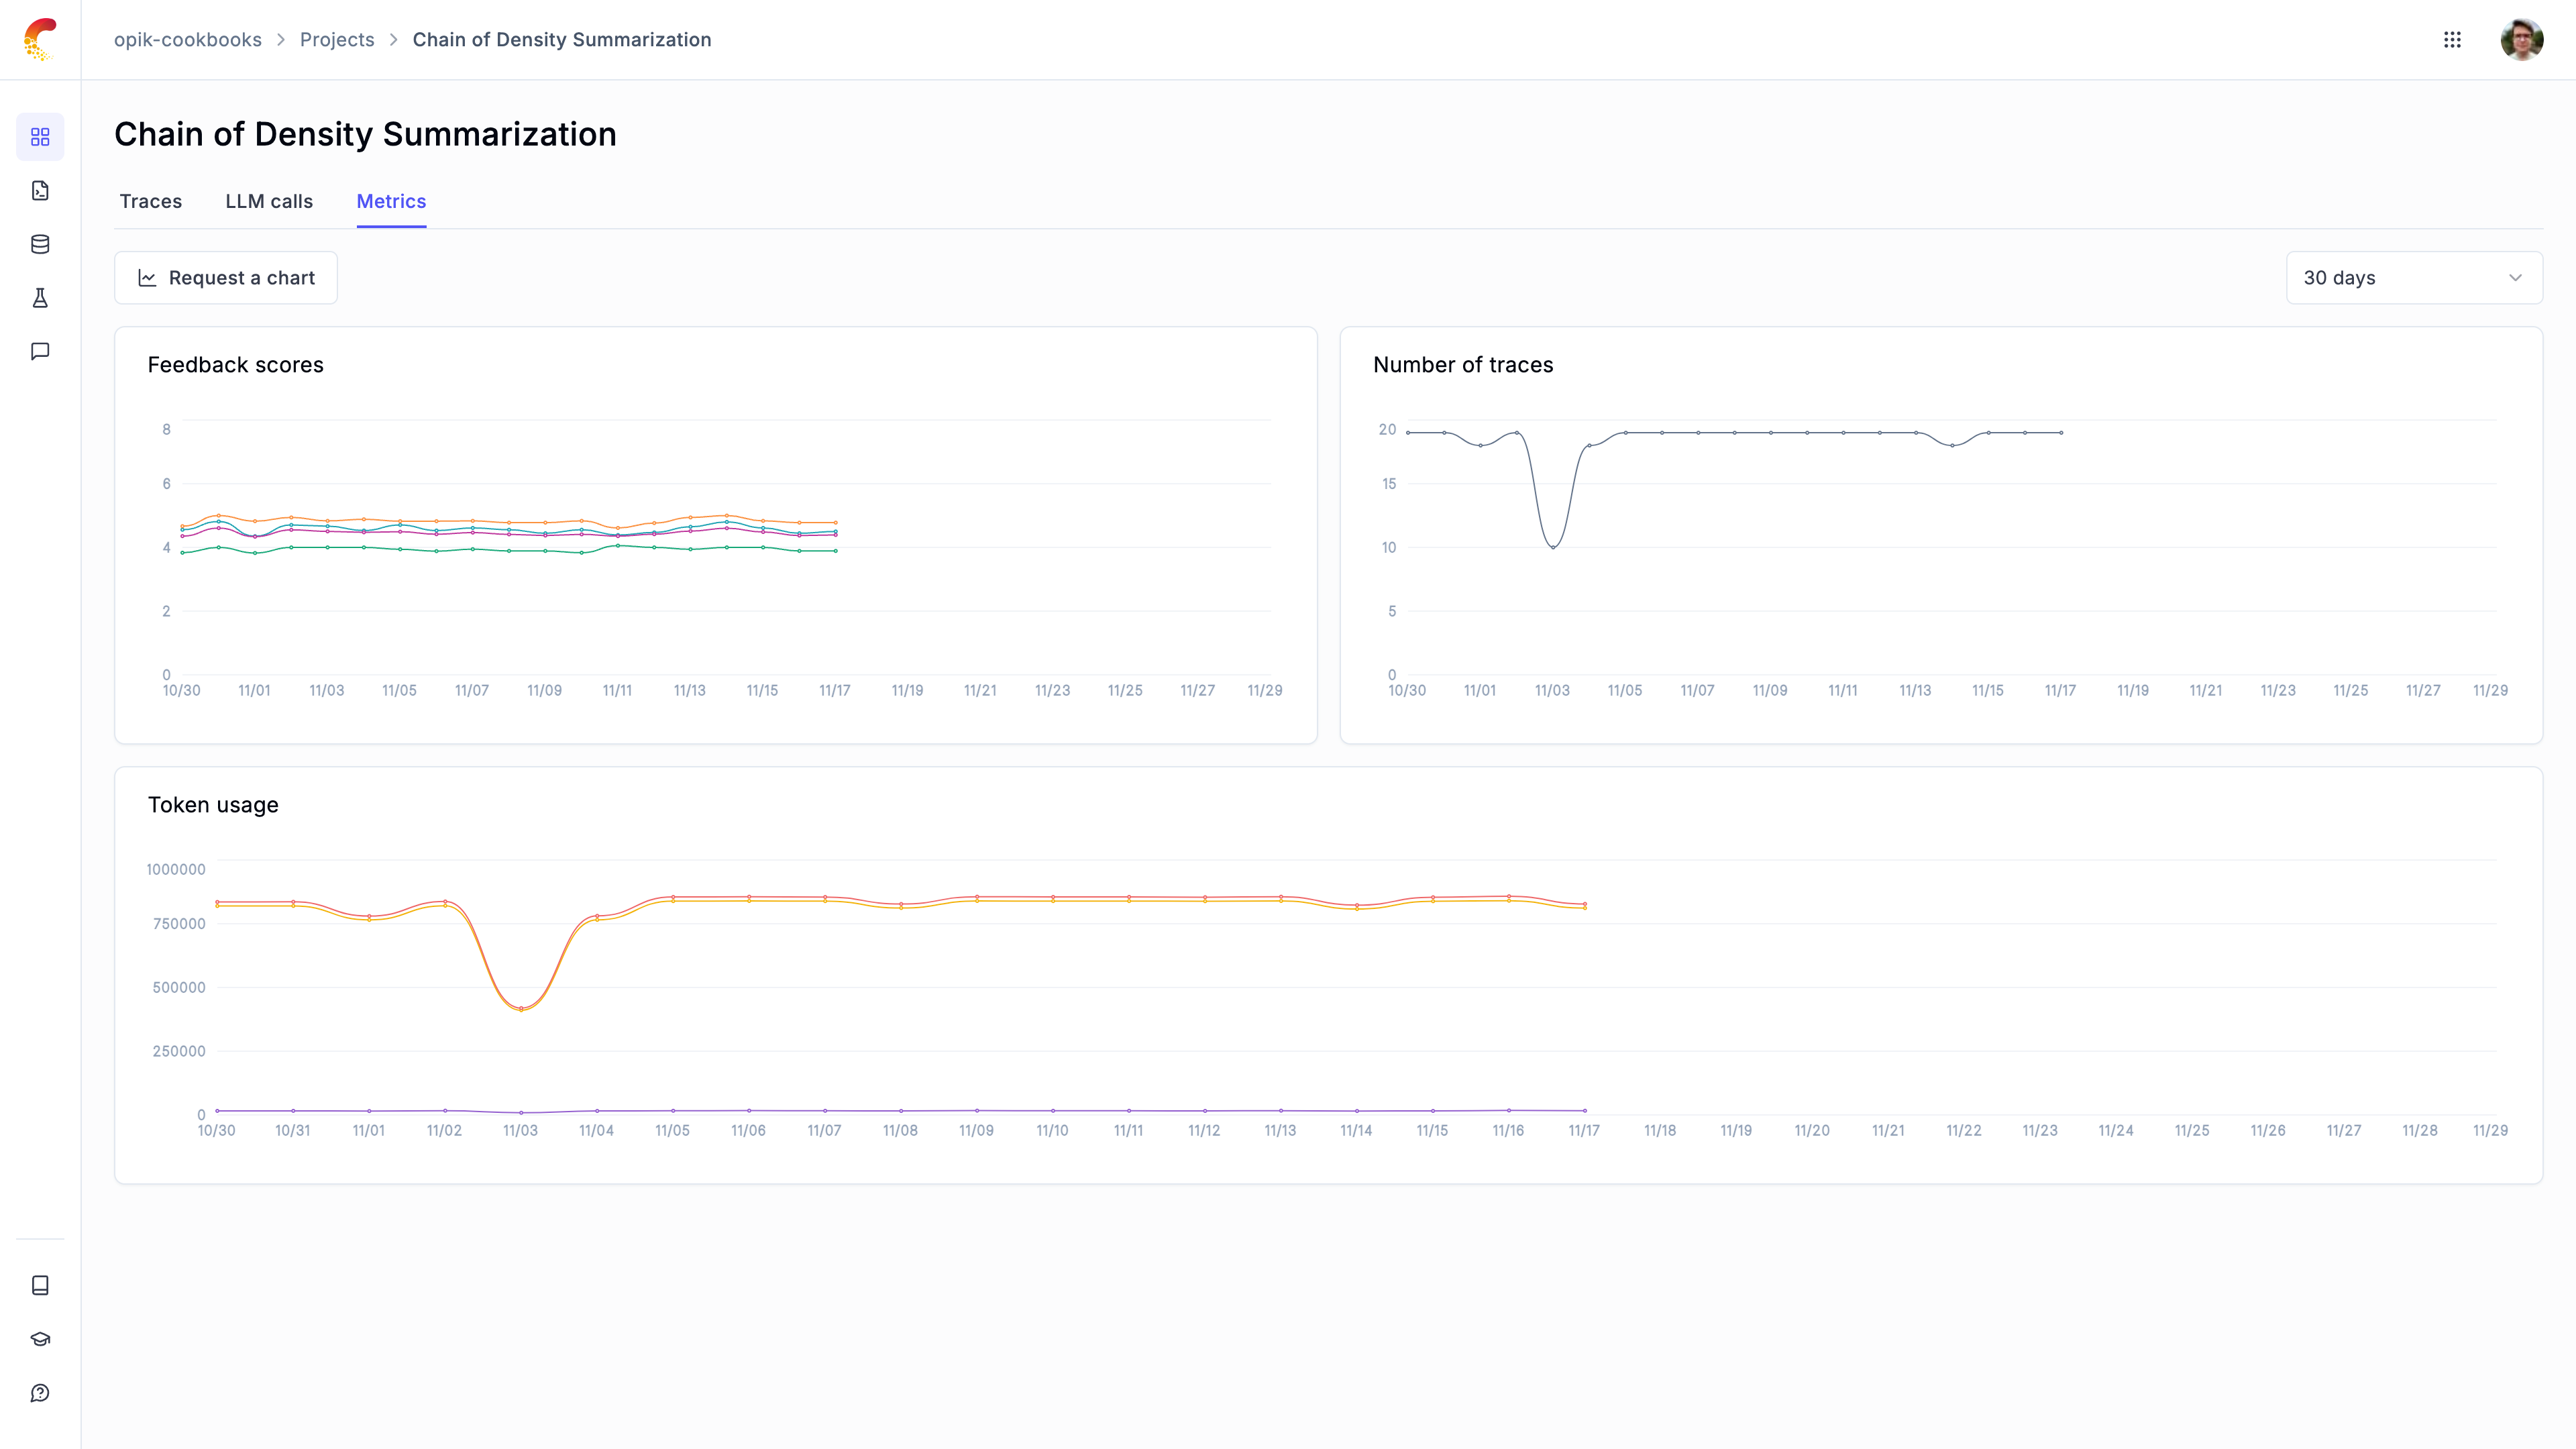
- Introduce a new project dashboard to see trace count, feedback scores and token count over time.
- Project statistics are now displayed in the traces and spans table header, this is especially useful for tracking the average feedback scores
- Redesigned the experiment item sidebar to make it easier to review experiment results
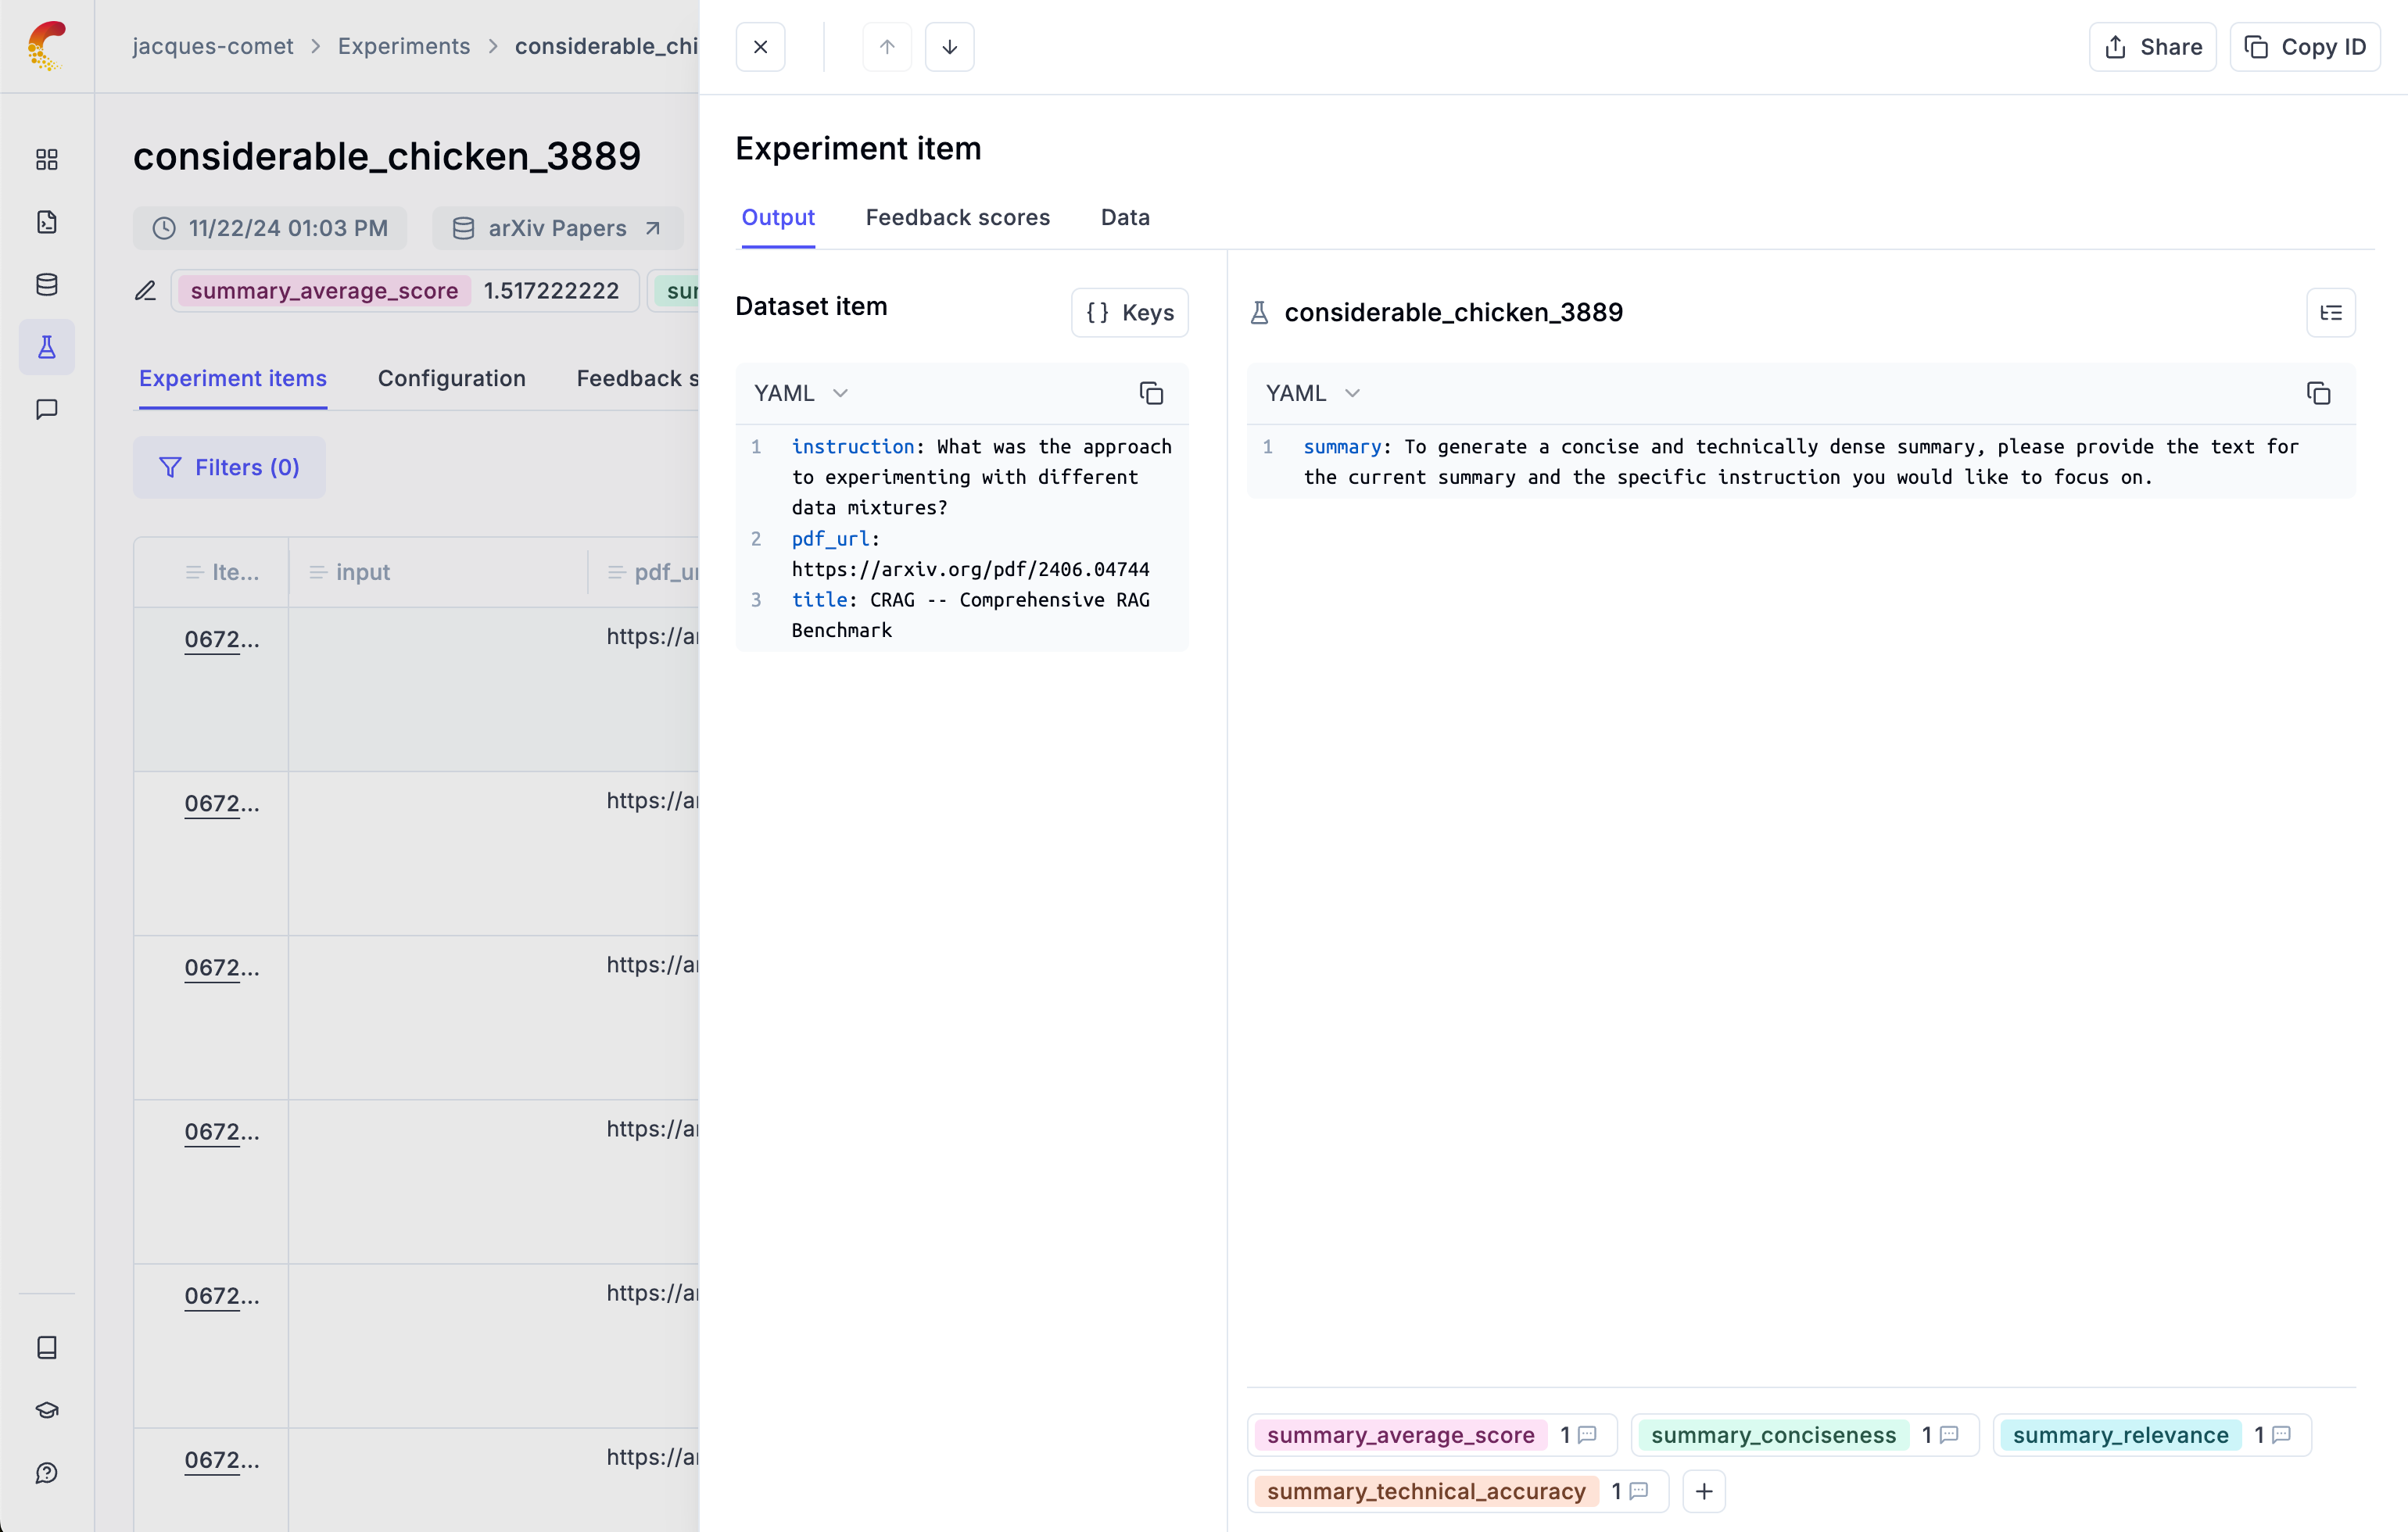
- Annotating feedback scores in the UI now feels much faster
- Support exporting traces as JSON file in addition to CSV
- Sidebars now close when clicking outside of them
- Dataset groups in the experiment page are now sorted by last updated date
- Updated scrollbar styles for Windows users
SDK:
- Improved the robustness to connection issues by adding retry logic.
- Updated the OpenAI integration to track structured output calls using
beta.chat.completions.parse. - Fixed issue with
update_current_spanandupdate_current_tracethat did not support updating theoutputfield.