Here are the most relevant improvements we’ve made since the last release:
🚀 Optimization Studio
We’re excited to introduce Optimization Studio — a powerful new way to improve your prompts without writing code. Bring a prompt, define what “good” looks like, and Opik tests variations to find a better version you can ship with confidence.
What’s new:
- No-code prompt optimization - Optimization Studio helps you improve prompts directly from the Opik UI. You see scores and examples, not just a hunch, shortening the loop from idea to evidence
- Algorithm selection - Choose how Opik searches for better prompts: GEPA works well for single-turn prompts and quick improvements, while HRPO is better when you need deeper analysis of why a prompt fails
- Flexible metrics - Define how Opik should score each prompt variation. Use Equals for strict matching when you have a single correct answer, or G-Eval when answers can vary and you want a model to grade quality
- Visual progress tracking - Monitor your optimization runs with real-time progress charts showing the best score so far and results for each trial
- Trials comparison - The Trials tab lets you compare prompt variations and scores side-by-side, with the ability to drill down into individual evaluated items
- Rerun & compare - Easily rerun the same setup, cancel a run to change inputs, or select multiple runs to compare outcomes
For teams that prefer a programmatic workflow, we’ve also released Opik Optimizer SDK v3 with improved algorithms, better performance, and more intuitive APIs.
👉 Optimization Studio Documentation
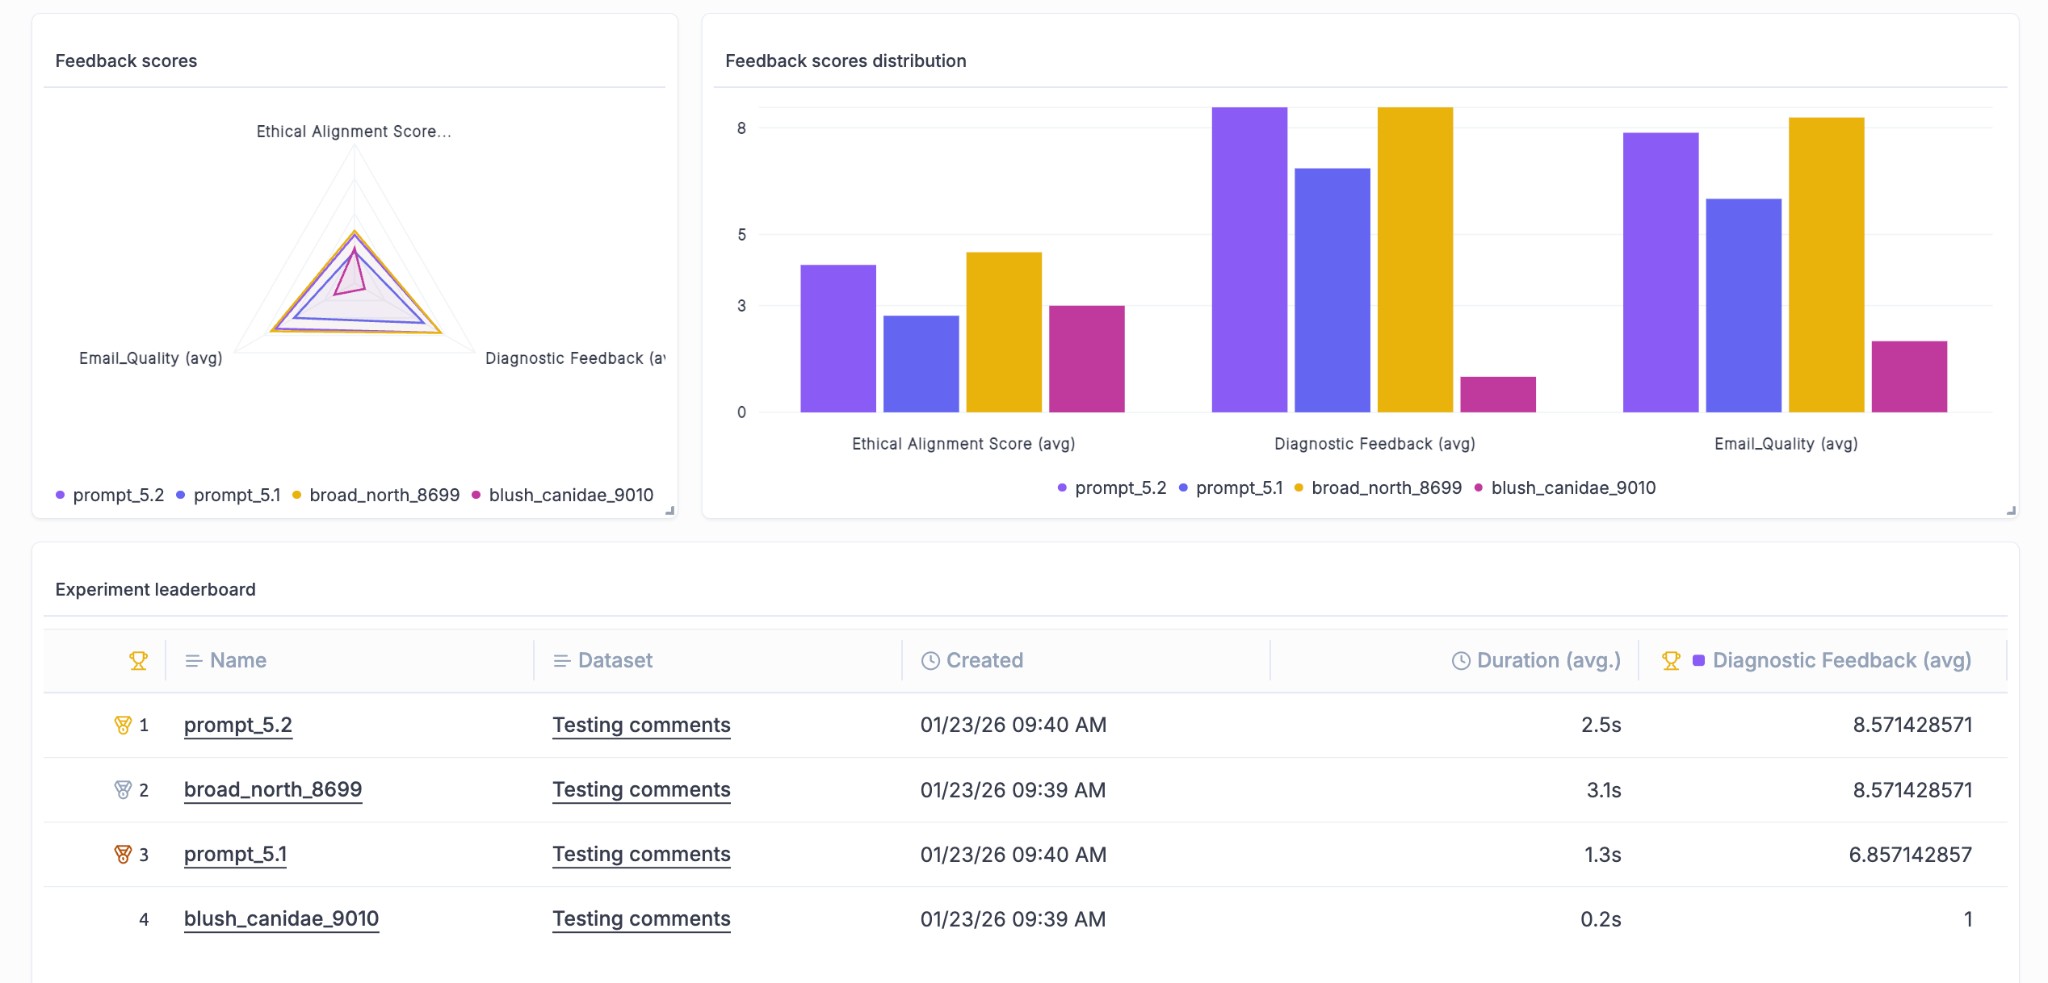
📊 Dashboard Improvements
We’ve enhanced the dashboard with new widgets and visualization capabilities to help you track and compare experiments more effectively.
What’s new:
- Experiment Leaderboard Widget - A new leaderboard widget lets you rank and compare experiments at a glance directly from your dashboard, making it easier to identify your best-performing configurations
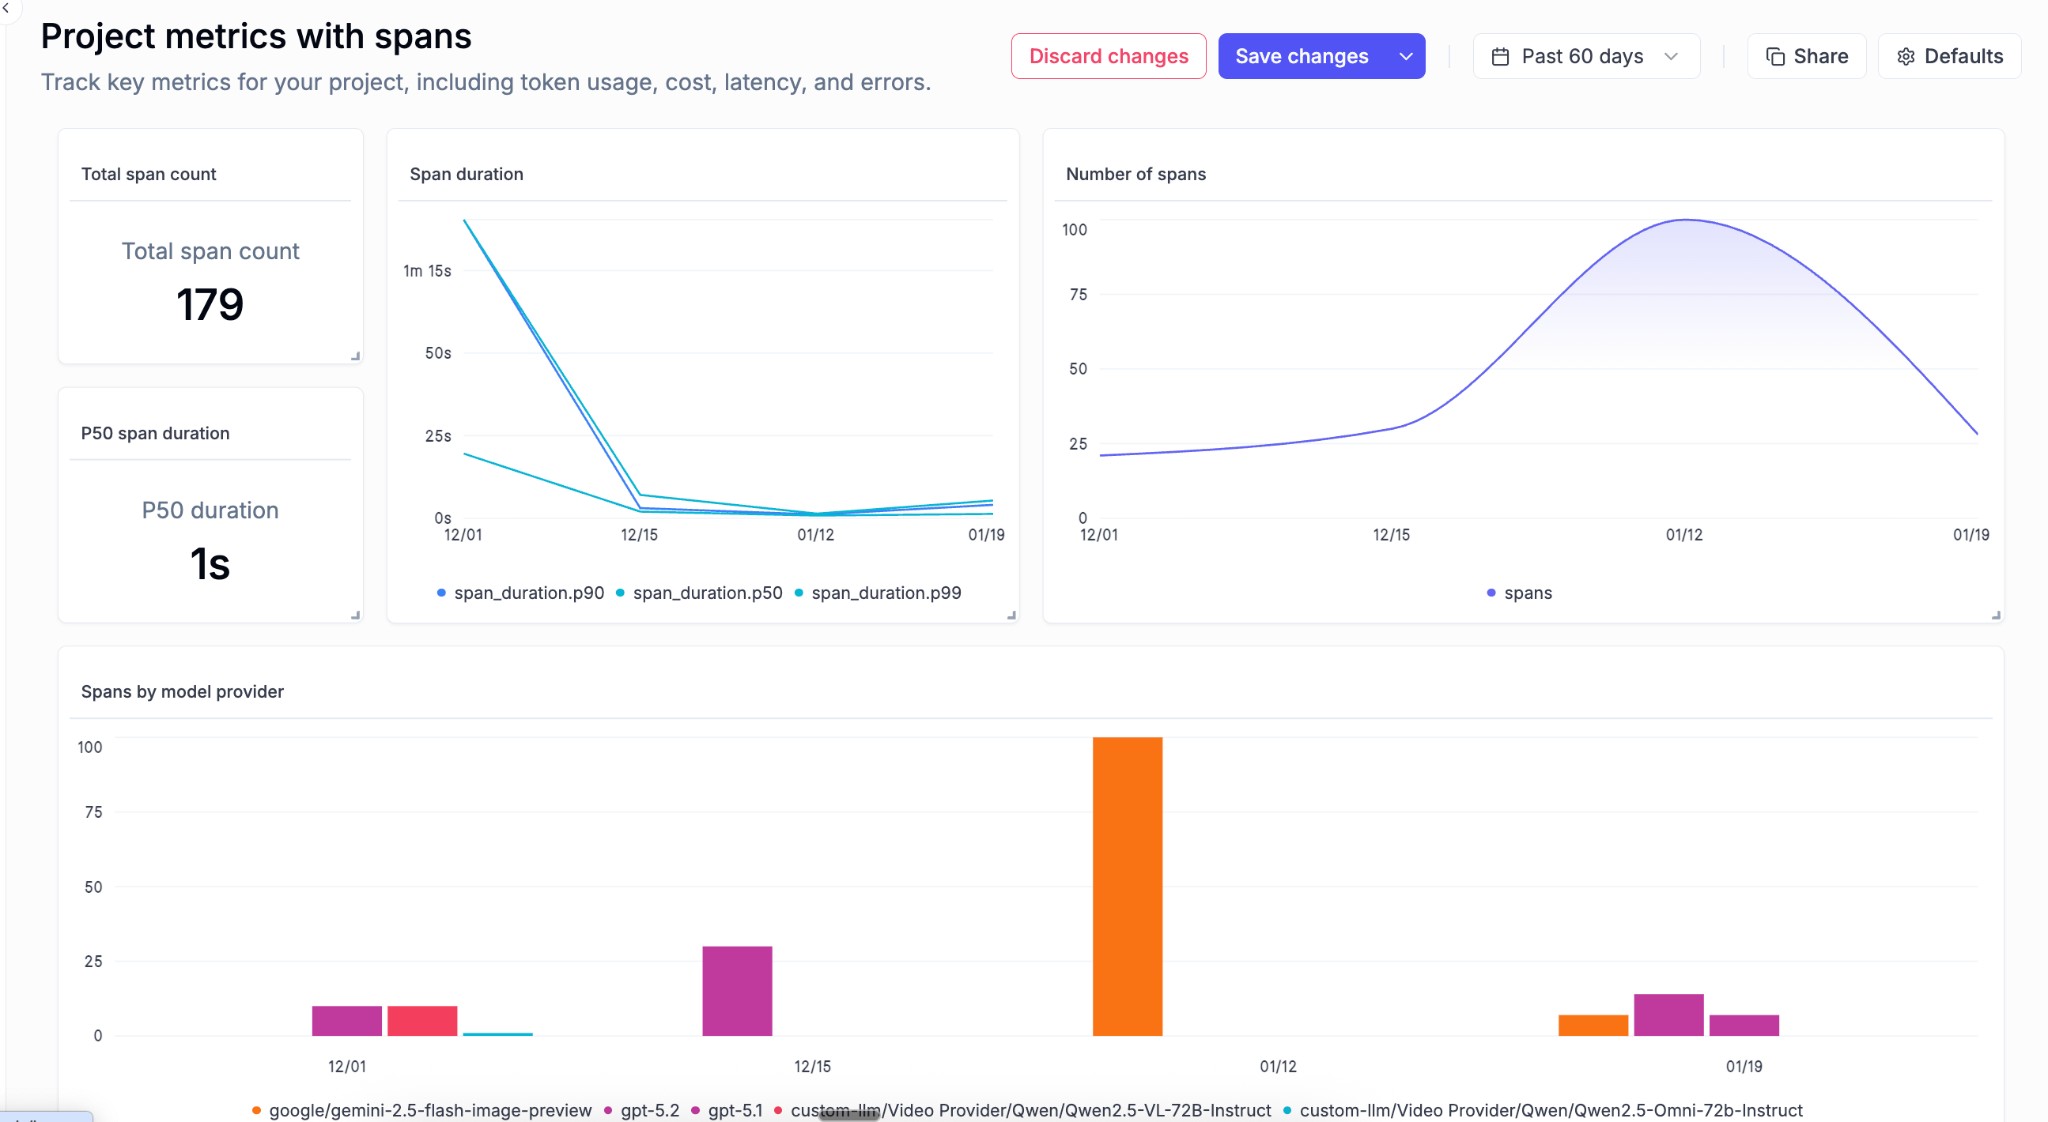
- Group By for Metrics Widget - The project metrics widget now supports grouping, allowing you to slice and dice your metrics data in more meaningful ways
- Span-level Metrics Charts - New charts provide visibility into span-level metrics, giving you deeper insights into the performance of individual components in your traces
🎬 Video Generation Support
We’ve added support for the latest video generation models, enabling you to track and log video outputs from your AI applications.
What’s new:
- OpenAI SORA Integration - Log and track video generation outputs from OpenAI’s SORA model directly in Opik
- Google Veo Integration - Full support for Google’s Veo video generation API, including automatic logging of video outputs and metadata
🧪 Experiment Management
We’ve made it easier to organize and navigate your experiments with new filtering and tagging capabilities.
What’s improved:
- Project Column in Experiments View - Experiments now display their associated project directly in the list view, making it easier to understand context at a glance
- Project Filter & Grouping - Filter and group your experiments by project to quickly find what you’re looking for across large experiment collections
- Experiment Tags - Tags are now rendered on the experiment page, helping you categorize and identify experiments more easily
✨ UI/UX Improvements
We’ve made several improvements to make your day-to-day workflow smoother.
What’s improved:
- Time Formatting Settings - Customize how timestamps are displayed throughout the UI to match your preferred format
- Online Score Rules Defaults - Input and output fields in online score rules are now pre-populated with sensible defaults, reducing setup time
- Dataset Item Navigation - Navigation tags in the experiment item view now link directly to the associated dataset item for easier data exploration
- Annotation Queue Review - You can now review completed annotation queues, making it easier to audit and verify your annotation work
🔌 SDK & Integrations
We’ve improved our SDK integrations with better tracing and performance metrics.
What’s improved:
- Vercel AI SDK Thread Support - Thread ID support for the Vercel AI SDK integration enables better conversation tracking across multi-turn interactions
- ADK Distributed Tracing - Added distributed trace headers support to the ADK integration for improved observability in distributed systems
- Time-to-First-Token (TTFT) - The ADK integration now captures TTFT metrics, giving you visibility into response latency for streaming applications
And much more! 👉 See full commit log on GitHub
Releases: 1.9.79, 1.9.80, 1.9.81, 1.9.82, 1.9.83, 1.9.84, 1.9.85, 1.9.86, 1.9.87, 1.9.88, 1.9.89, 1.9.90, 1.9.91, 1.9.92, 1.9.95, 1.9.96, 1.9.97, 1.9.98, 1.9.99, 1.9.100, 1.9.101