🧵 Thread-level LLMs-as-Judge
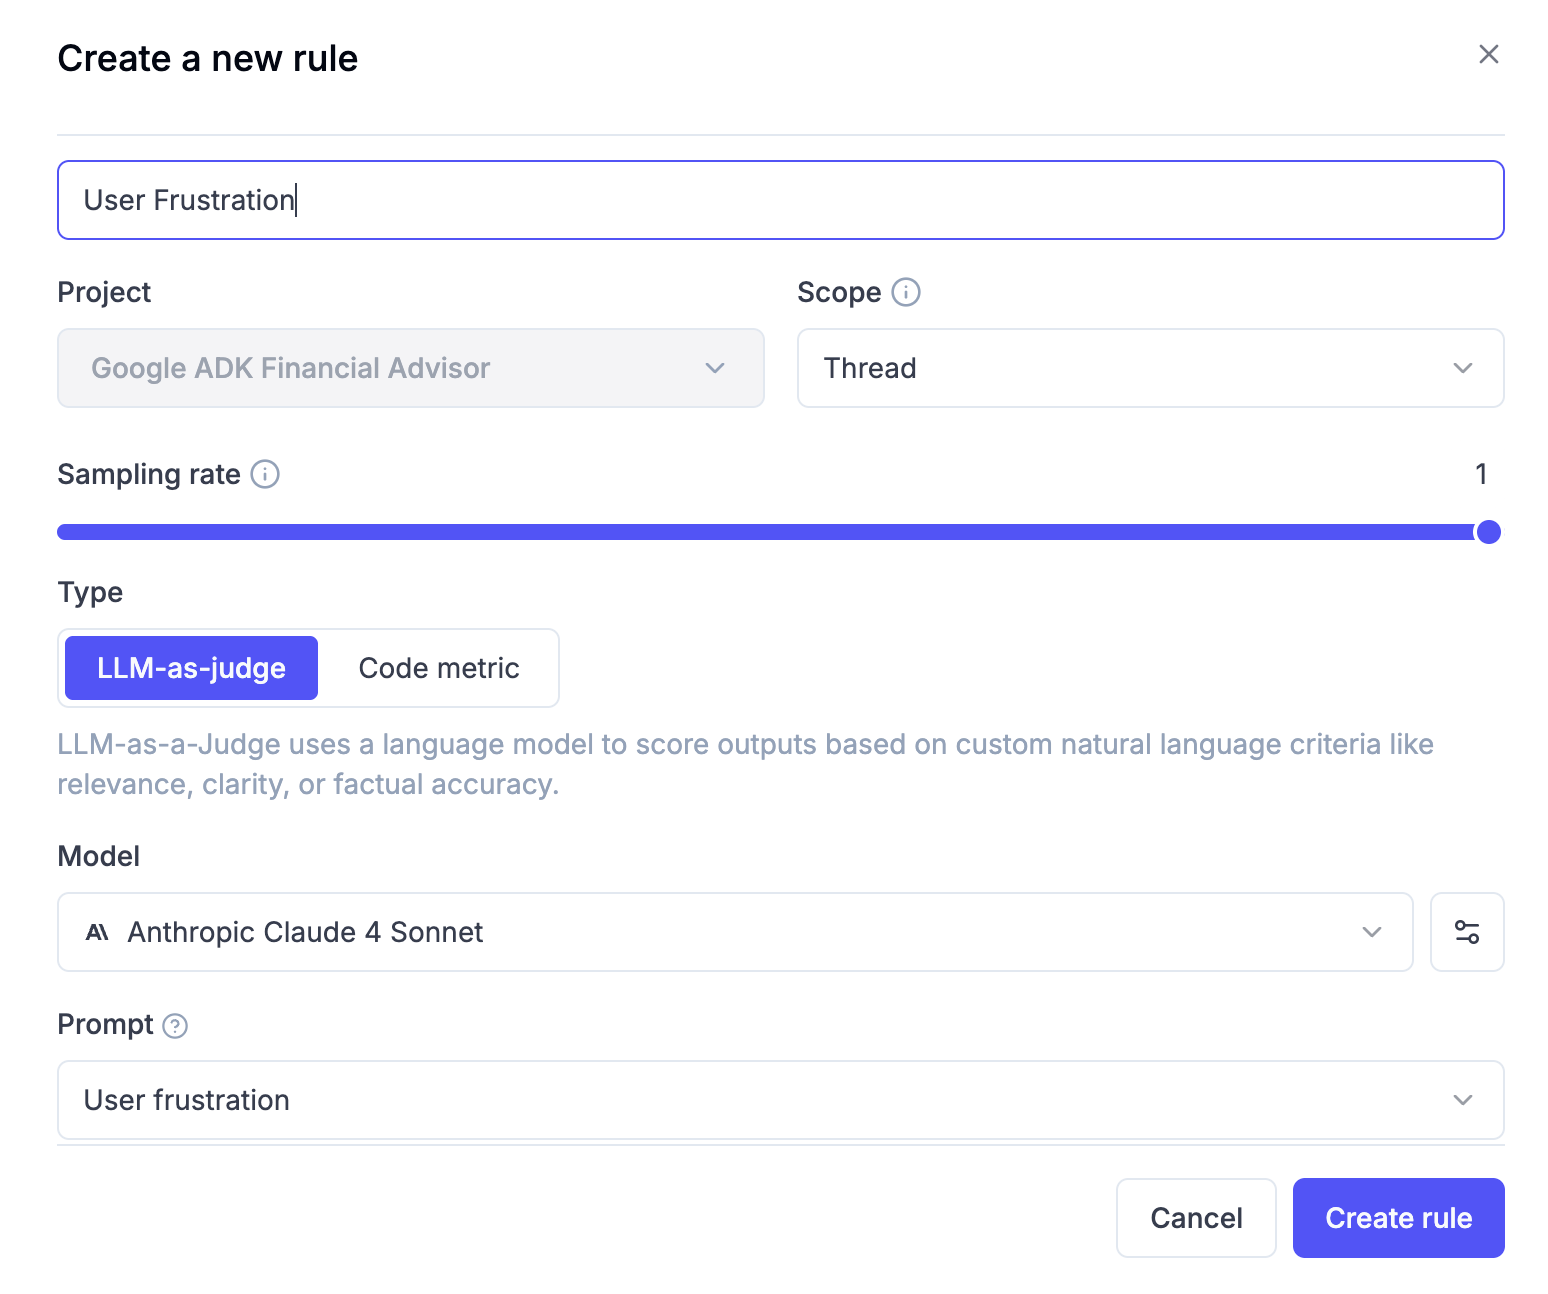
We now support thread-level LLMs-as-a-Judge metrics!
We’ve implemented Online evaluation for threads, enabling the evaluation of entire conversations between humans and agents.
This allows for scalable measurement of metrics such as user frustration, goal achievement, conversational turn quality, clarification request rates, alignment with user intent, and much more.
We’ve also implemented Python metrics support for threads, giving you full code control over metric definitions.
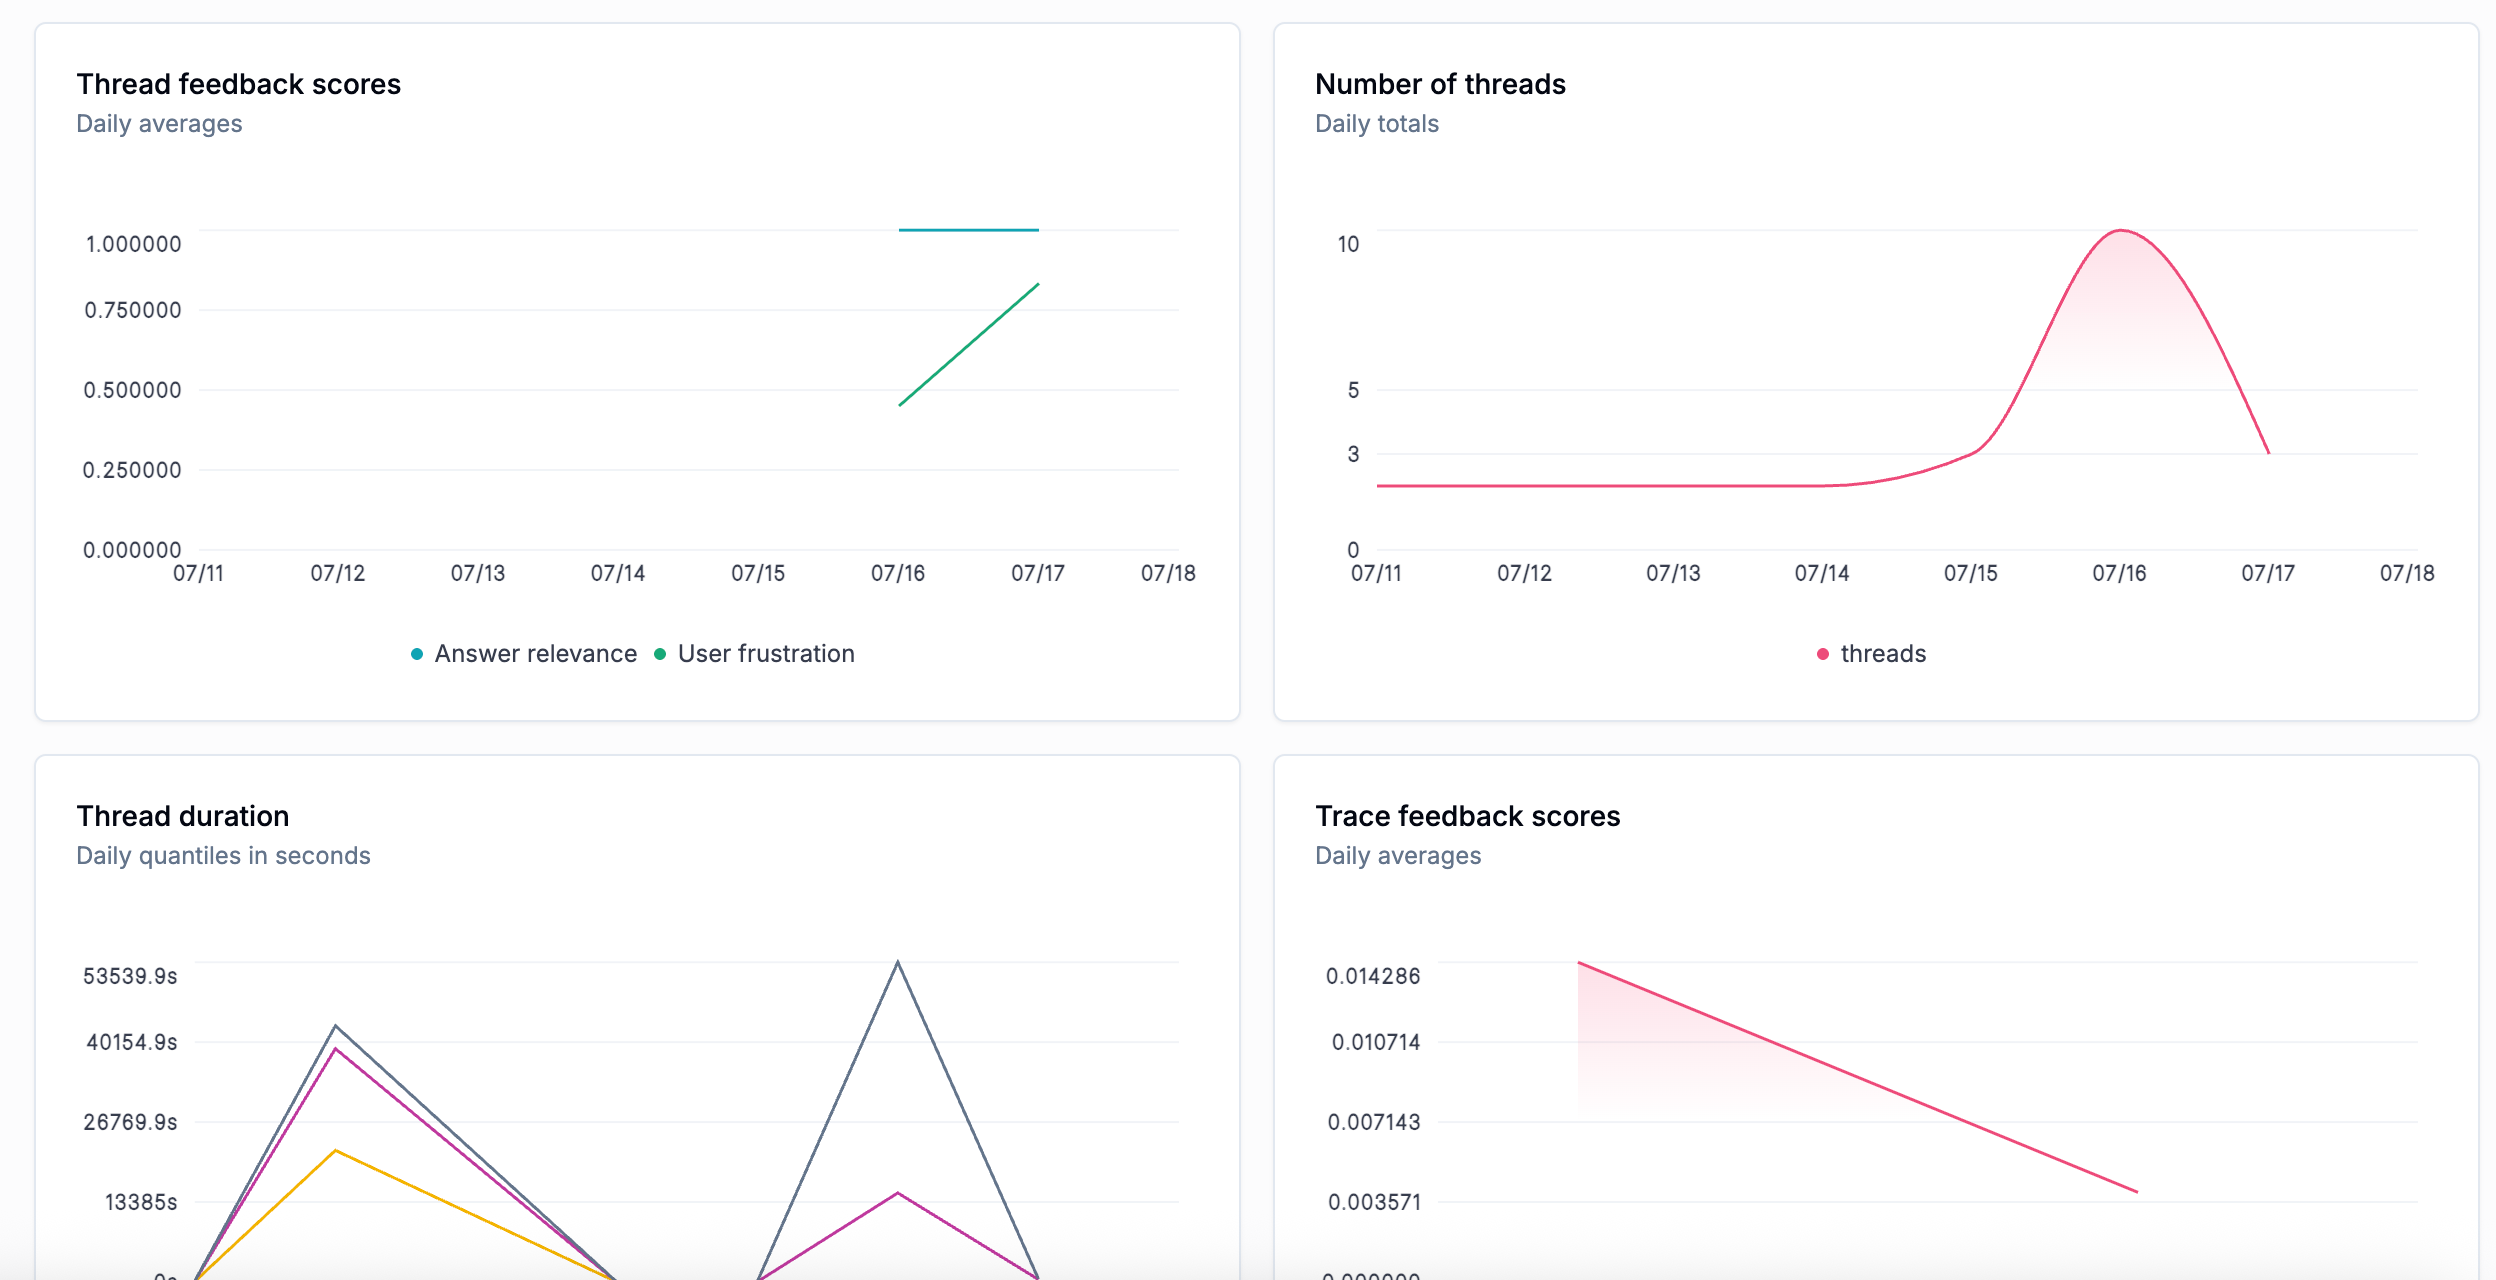
To improve visibility into trends and to help detect spikes in these metrics when the agent is running in production, we’ve added Thread Feedback Scores and Thread Duration widgets to the Metrics dashboard. These additions make it easier to monitor changes over time in live environments.
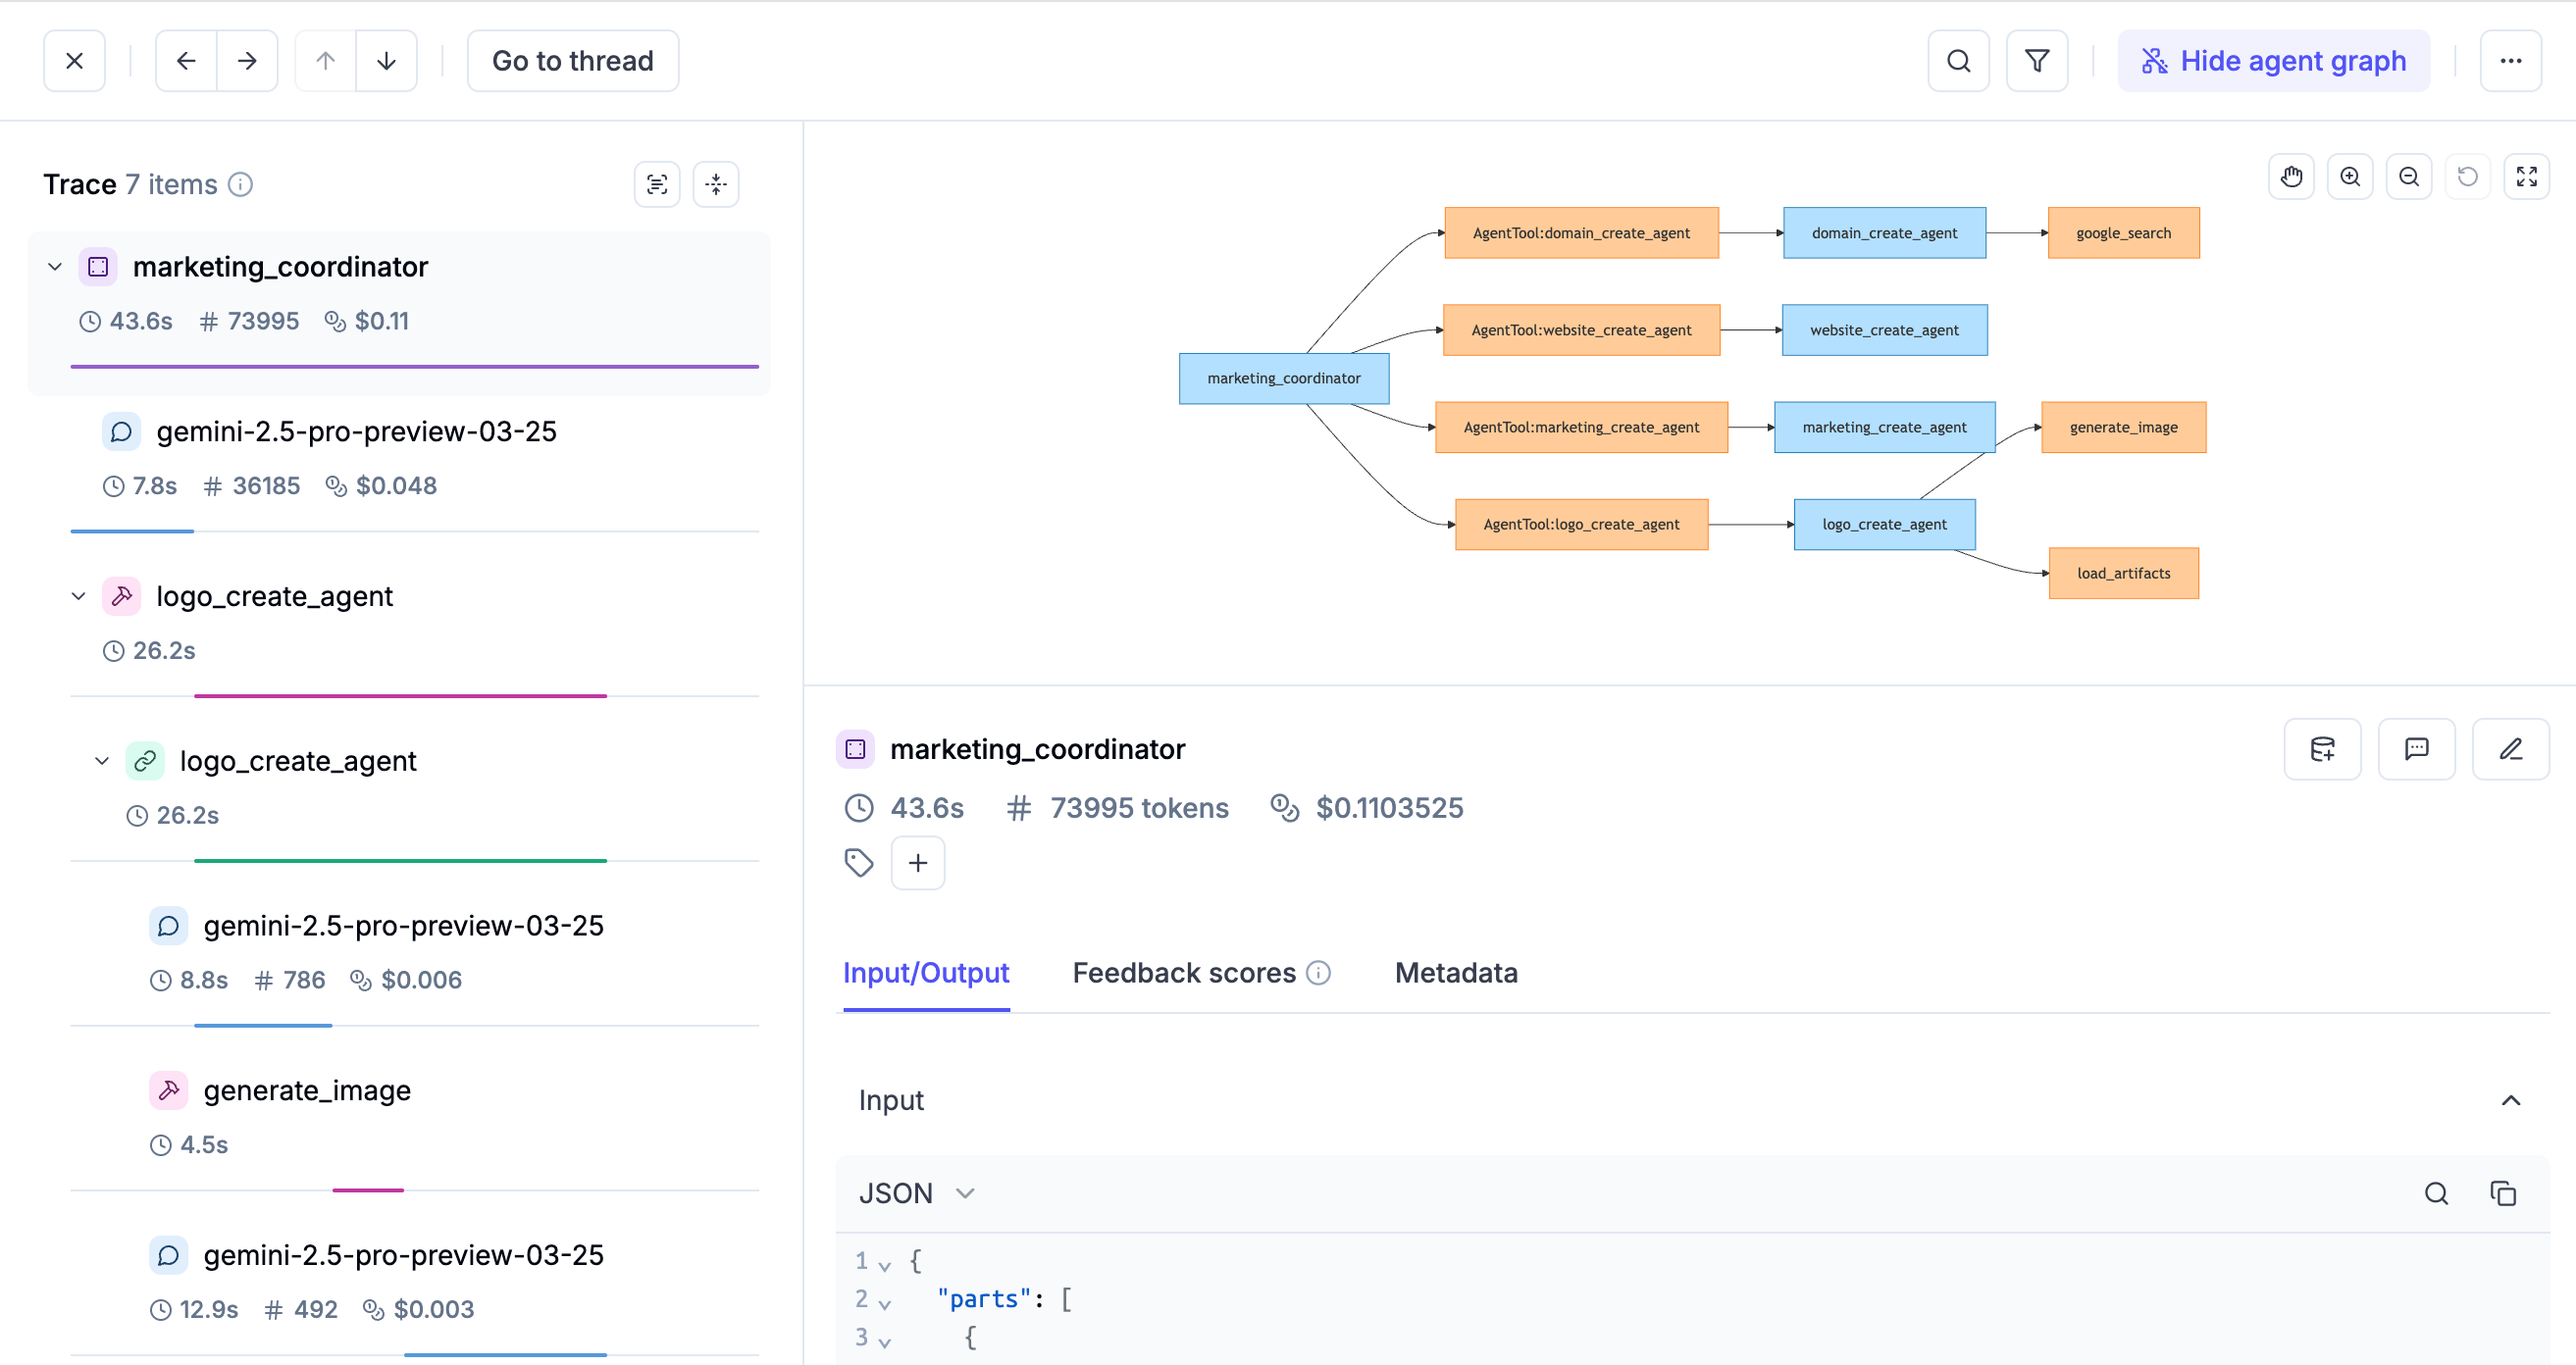
🔍 Improved Trace Inspection Experience
Once you’ve identified problematic sessions or traces, we’ve made it easier to inspect and analyze them with the following improvements:
- Field Selector for Trace Tree: Quickly choose which fields to display in the trace view.
- Span Type Filter: Filter spans by type to focus on what matters.
- Improved Agent Graph: Now supports full-page view and zoom for easier navigation.
- Free Text Search: Search across traces and spans freely without constraints.
- Better Search Usability: search results are now highlighted and local search is available within code blocks.
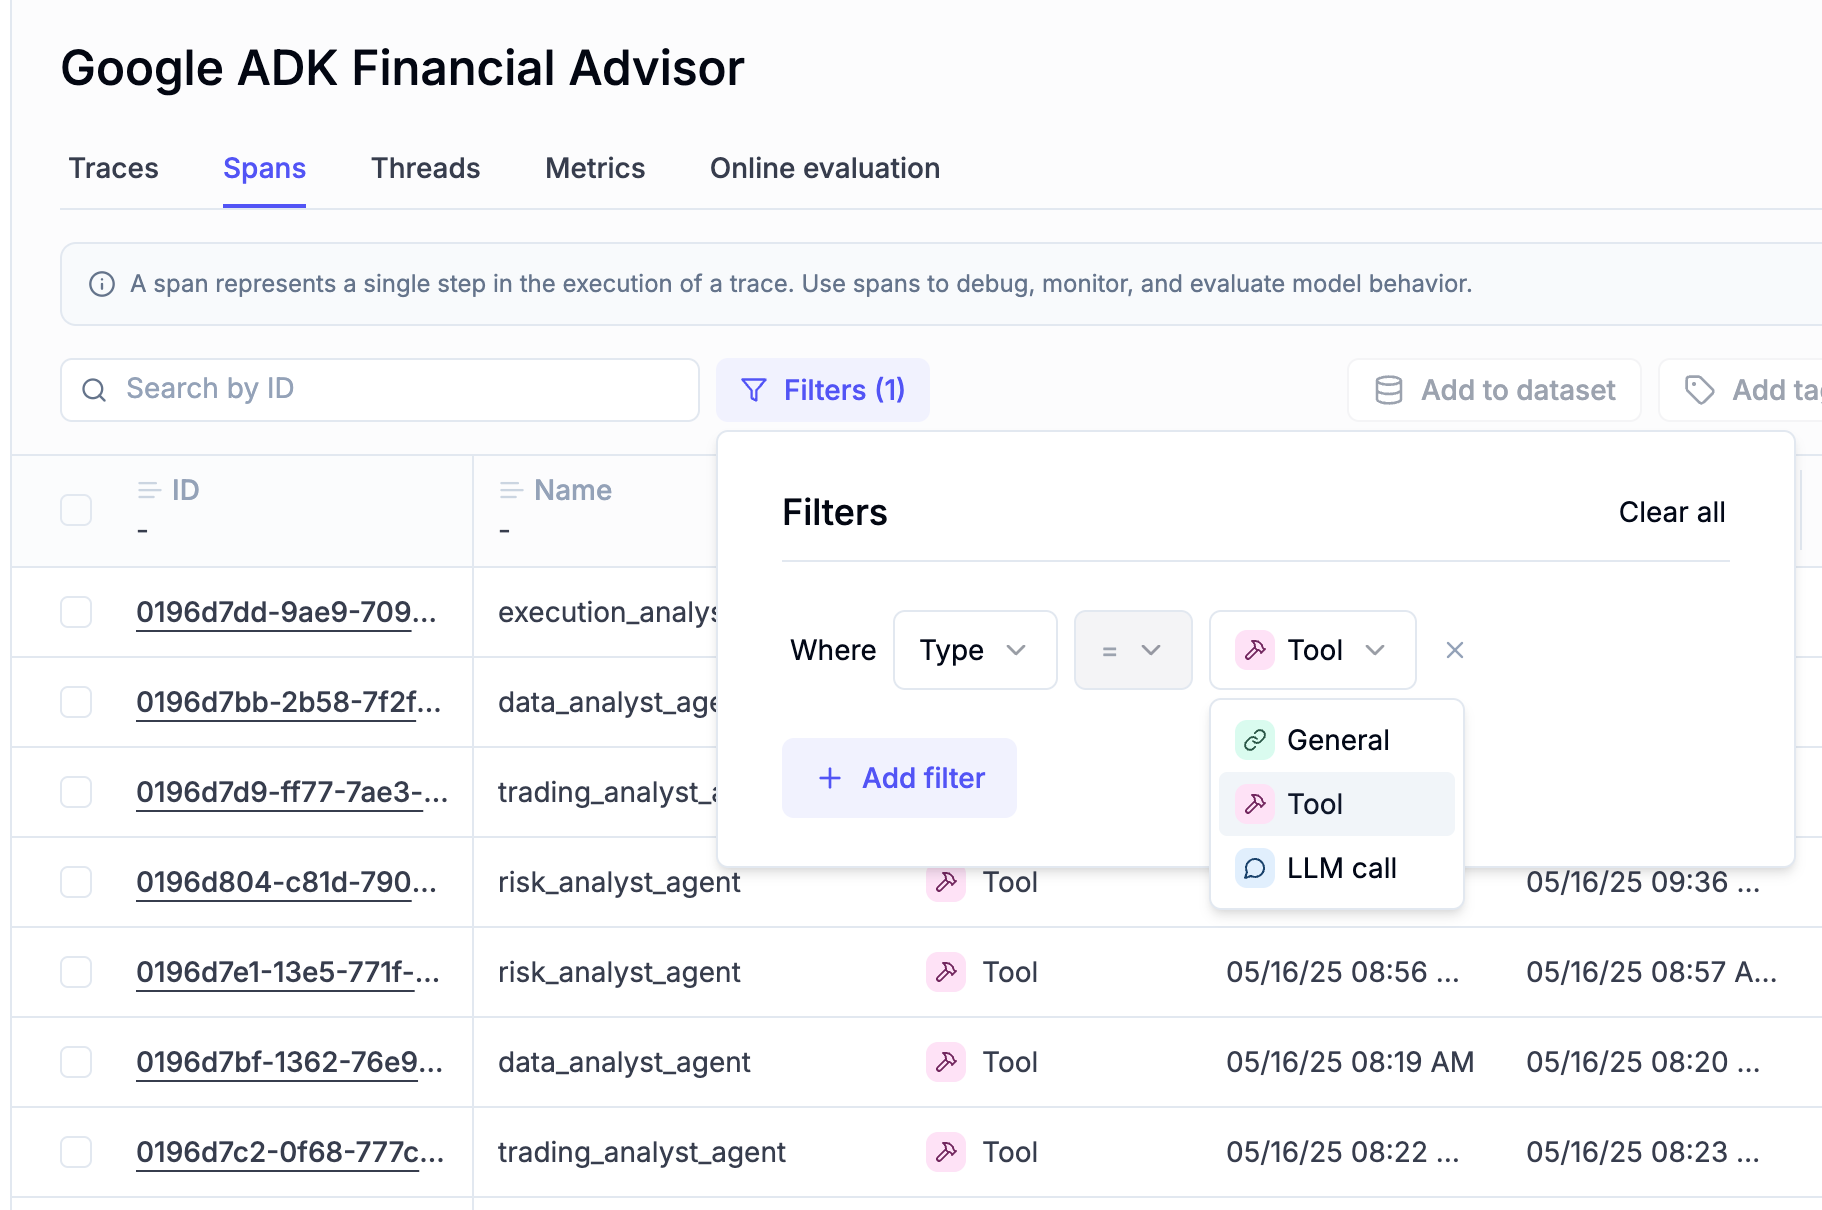
📊 Spans Tab Improvements
The Spans tab provides a clearer, more comprehensive view of agent activity to help you analyze tool and sub-agent usage across threads, uncover trends, and spot latency outliers more easily.
What’s New:
- LLM Calls → Spans: we’ve renamed the LLM Calls tab to Spans to reflect broader coverage and richer insights.
- Unified View: see all spans in one place, including LLM calls, tools, guardrails, and more.
- Span Type Filter: quickly filter spans by type to focus on what matters most.
- Customizable Columns: highlight key span types by adding them as dedicated columns.
These improvements make it faster and easier to inspect agent behavior and performance at a glance.
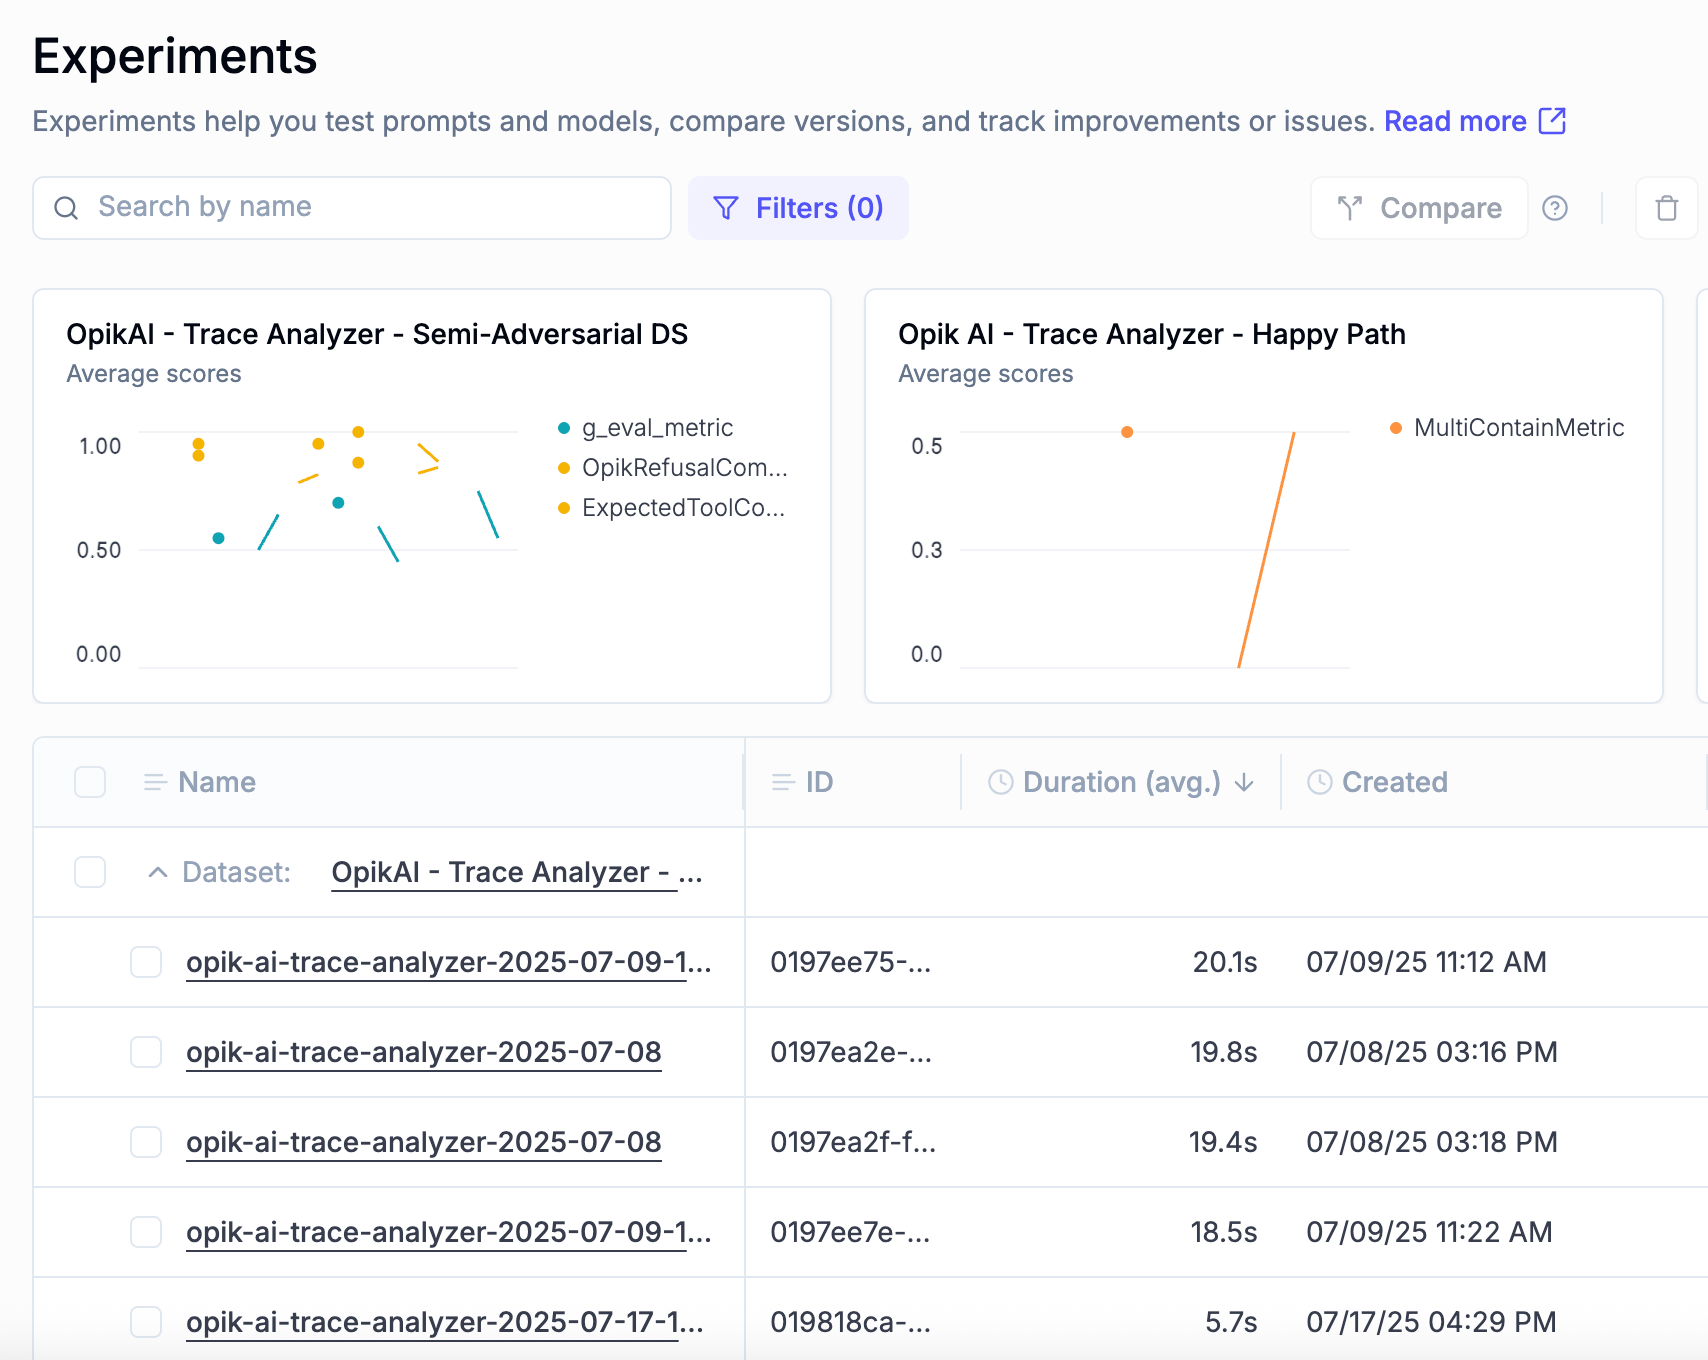
📈 Experiments Improvements
Slow model response times can lead to frustrating user experiences and create hidden bottlenecks in production systems. However, identifying latency issues early (during experimentation) is often difficult without clear visibility into model performance.
To help address this, we’ve added Duration as a key metric for monitoring model latency in the Experiments engine. You can now include Duration as a selectable column in both the Experiments and Experiment Details views. This makes it easier to identify slow-responding models or configurations early, so you can proactively address potential performance risks before they impact users.
📦 Enhanced Data Organization & Tagging
When usage grows and data volumes increase, effective data management becomes crucial. We’ve added several capabilities to make team workflows easier:
- Tagging, filtering, and column sorting support for Prompts
- Tagging, filtering, and column sorting support for Datasets
- Ability to add tags to multiple items in the Traces and Spans tables
🤖 New Models Support
We’ve added support for:
- OpenAI GPT-4.1 and GPT-4.1-mini models
- Anthropic Claude 4 Sonnet model
🌐 Integration Updates
We’ve enhanced several integrations:
- Build graph for Google ADK agents
- Update Langchain integration to log provider, model and usage when using Google Generative AI models
- Implement Groq LLM usage tracking support in the Langchain integration
And much more! 👉 See full commit log on GitHub
Releases: 1.8.0, 1.8.1, 1.8.2, 1.8.3, 1.8.4, 1.8.5, 1.8.6