

Opik Usage
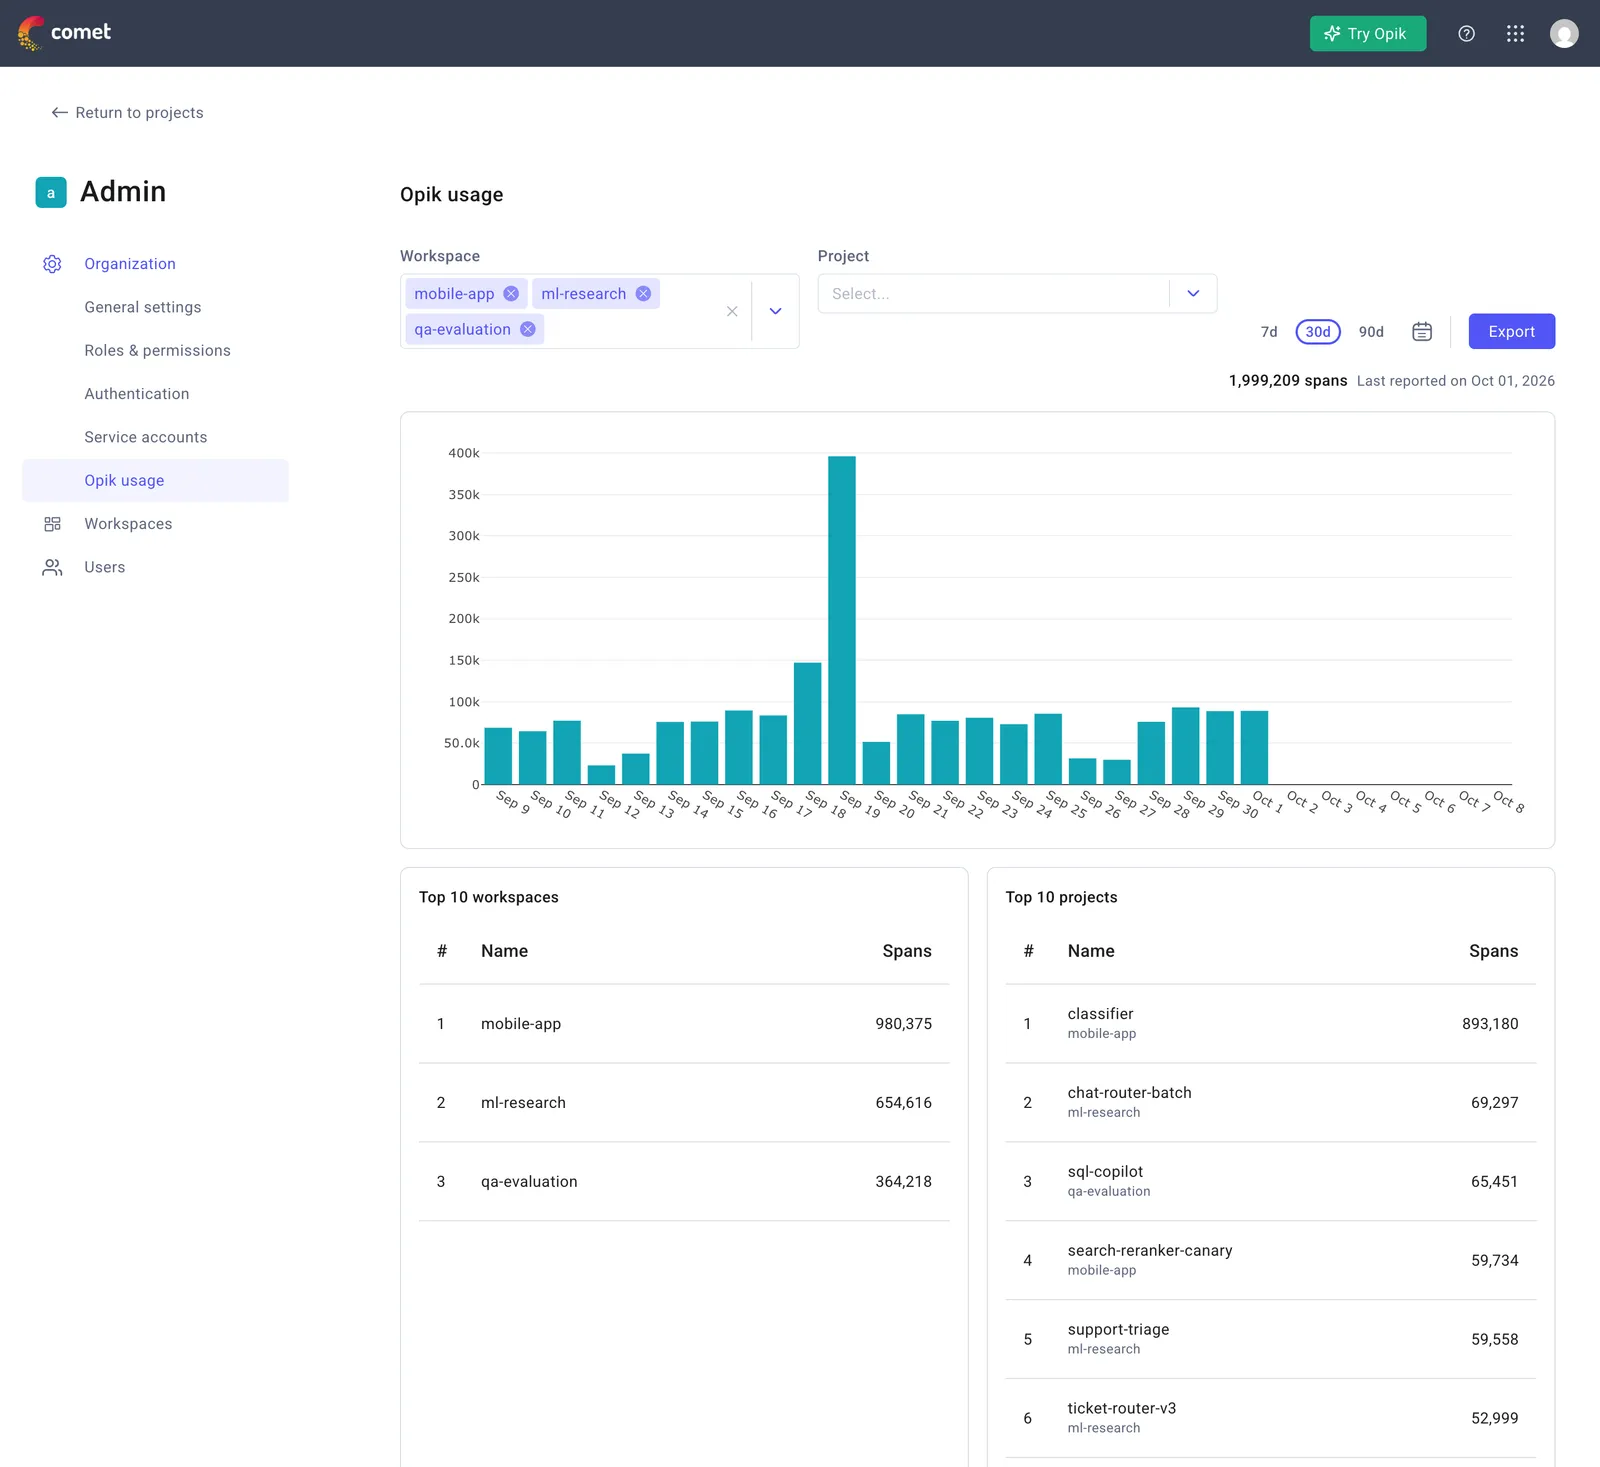
The Opik usage page shows how many spans your organization logs over time. You can filter the chart by workspace and project, see the top ten consumers for the selected range, and export the data as a CSV file.
Access requirement: You must have the Admin organization role. Opik usage is available on Opik Cloud and Enterprise plans.
Opening the page
- Navigate to the Admin Dashboard
- Click on Opik usage in the sidebar
Reading the chart
The chart shows the number of spans logged per day. Use the 7d, 30d and 90d buttons to change the range, or pick a custom range with the date picker. Ranges longer than six months are shown per month.
The total above the chart is the number of spans in the selected range and filters, and Last reported on is the date of the latest collected data. Usage is collected once a day, so the current day is not included yet.
Filtering by workspace and project
Use the two filters above the chart to narrow the data down:
- Workspace: one or more workspaces of your organization. Start typing to search.
- Project: one or more projects. The list shows projects from the selected workspaces, or from the whole organization when no workspace is selected. Start typing to search by name.
The chart, the total and the Top 10 panels all follow the filters.
Projects that were deleted in Opik no longer appear in the project filter, but their past usage is still counted in the chart and listed in the Top 10 panels.
Top 10 workspaces and projects
Below the chart, two panels list the workspaces and the projects with the most spans in the selected range and filters. Each project row shows its workspace underneath the project name.
A project that was deleted in Opik keeps its last known name and is marked as Deleted project. If the name is not known anymore, the project id is shown instead.
Exporting usage data
Click Export to download a CSV file for the range and filters currently shown on the page.
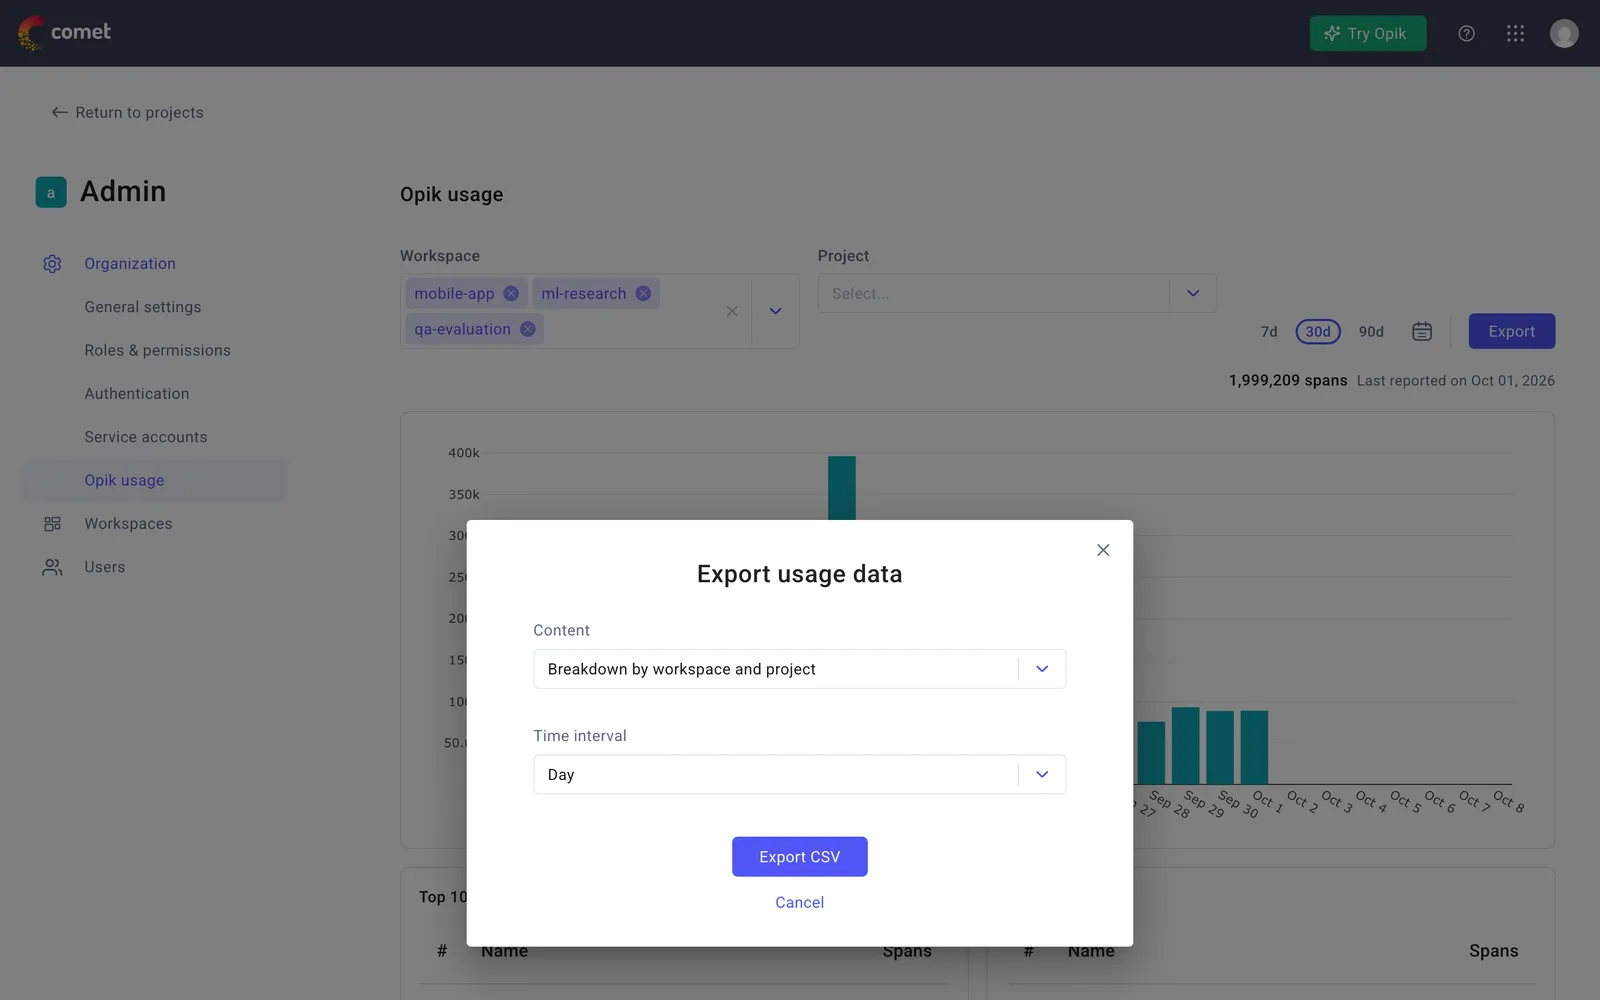
In the dialog you choose:
- Content
- Breakdown by workspace and project (default): one row per period, workspace and project with the columns
date, workspace_id, workspace_name, project_id, project_name, count. - Totals: one row per period with the columns
date, count.
- Breakdown by workspace and project (default): one row per period, workspace and project with the columns
- Time interval: Day or Month.
The file is named opik-usage-<content>-<start>-<end>.csv. In the breakdown export, a project that was deleted in Opik and whose name is not known anymore is listed as [deleted].
Per-workspace and per-project data is available from the date your deployment started collecting it. For earlier dates, filtered views and the breakdown export show zero while the unfiltered totals remain complete.
Related Documentation
- Admin Dashboard - Overview of the organization administration pages
- Workspaces - Manage the workspaces of your organization