

Cost Intelligence
Your provider bill tells you how many tokens you spent. It doesn’t tell you what you spent them on.
That gap matters more with coding agents than with any other LLM workload. A single Claude Code request carries a multi-thousand-token system prompt, tool schemas for every enabled MCP server, memory files, skill listings, subagent definitions, and the accumulated transcript, all before a single character the developer typed. A flat token count can’t tell you that 70% of an expensive session was framework overhead, or that one MCP server nobody uses is on every request.
Cost Intelligence closes that gap. It captures every coding-agent API call on the wire, attributes the bytes to cost buckets, and gives you the per-user, per-session, per-repository view you need to actually act, plus the policy controls to act with.
Cost Intelligence is an enterprise feature and requires workspace admin access. Talk to your Comet account team if you don’t see it in your workspace.
What you get
Token totals come straight from the provider’s own usage payload, never
estimated, never re-tokenized.
Every call is split across ~20 cost buckets: system prompt, tools, MCP servers, memory, skills, agents, thinking, tool I/O, user input.
A leaderboard of who is spending what, with session-level drilldown and per-repository context.
Priced recommendations that typically cut spend by 15% to 30% without reducing output quality, applied as policy in one click.
Where your tokens actually go
Every Claude Code call is broken down into the things that drove it: the system prompt, tool schemas, MCP servers, memory files, skills, subagents, and somewhere in there, what your developer actually typed.
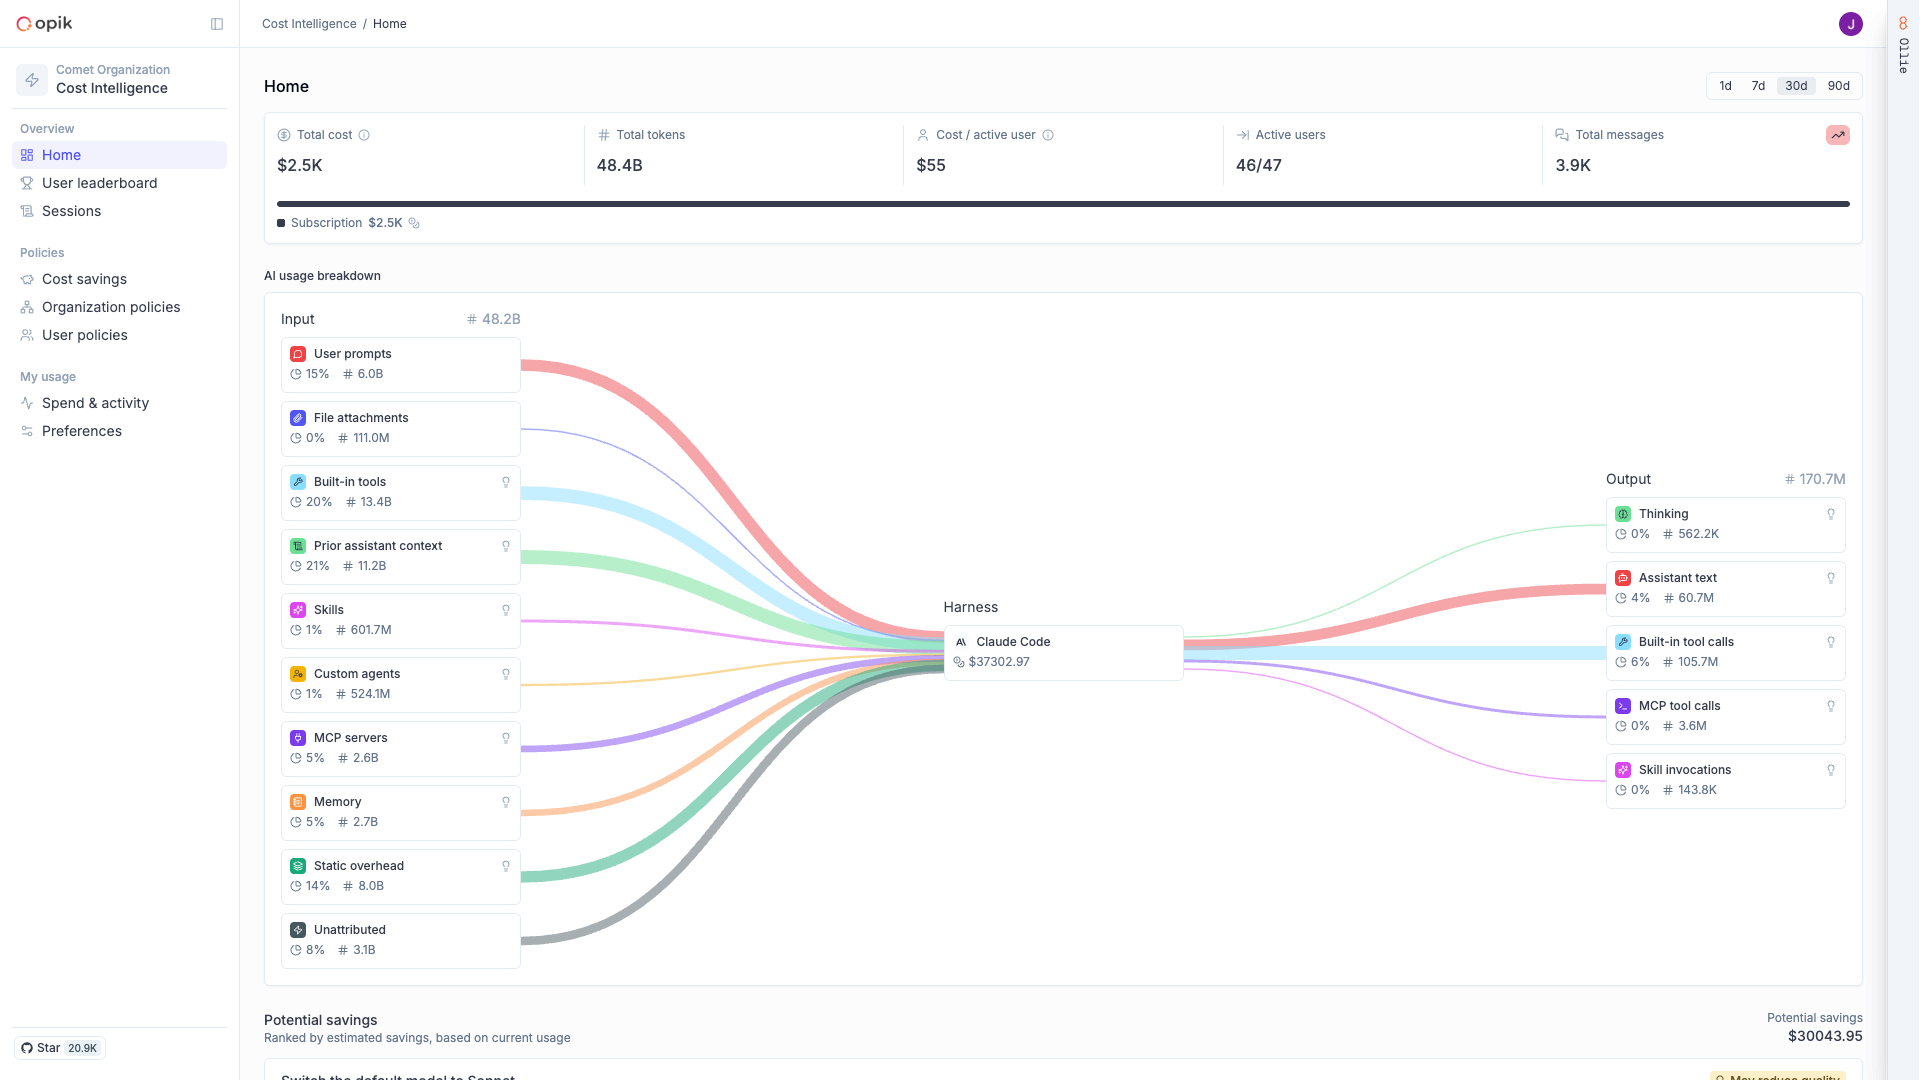
For most teams the surprise is the ratio. The prompt your developer wrote is a small fraction of what you paid for; the rest is framework overhead, much of it configuration nobody chose and nobody uses.
That is the whole point. Once you can see the drivers, you can remove the ones carrying no value. In practice that means 15% to 30% lower spend, with no change to what your developers can do, because what gets cut is unused MCP servers, dead skills, and runaway tool output rather than the work itself.
Token counts come from the provider’s own usage data, so what you see reconciles with your bill.
No added latency, no workflow change, and if anything fails the agent simply keeps working.
Only counts and metadata leave the machine. Never prompt or response content.
Supported agents
Deployments that front the provider with their own gateway (a corporate LLM gateway, LiteLLM, an AWS Bedrock access gateway) are supported by pointing the proxy’s upstream at that gateway. See Installation.