
Observability for Claude Managed Agents with Opik
Claude Managed Agents runs Claude as an autonomous agent: Anthropic runs the agent loop, and the agent’s tools run in a sandbox. The service exports an OpenTelemetry trace of each session, so you can send it to Opik without changes to your agent.
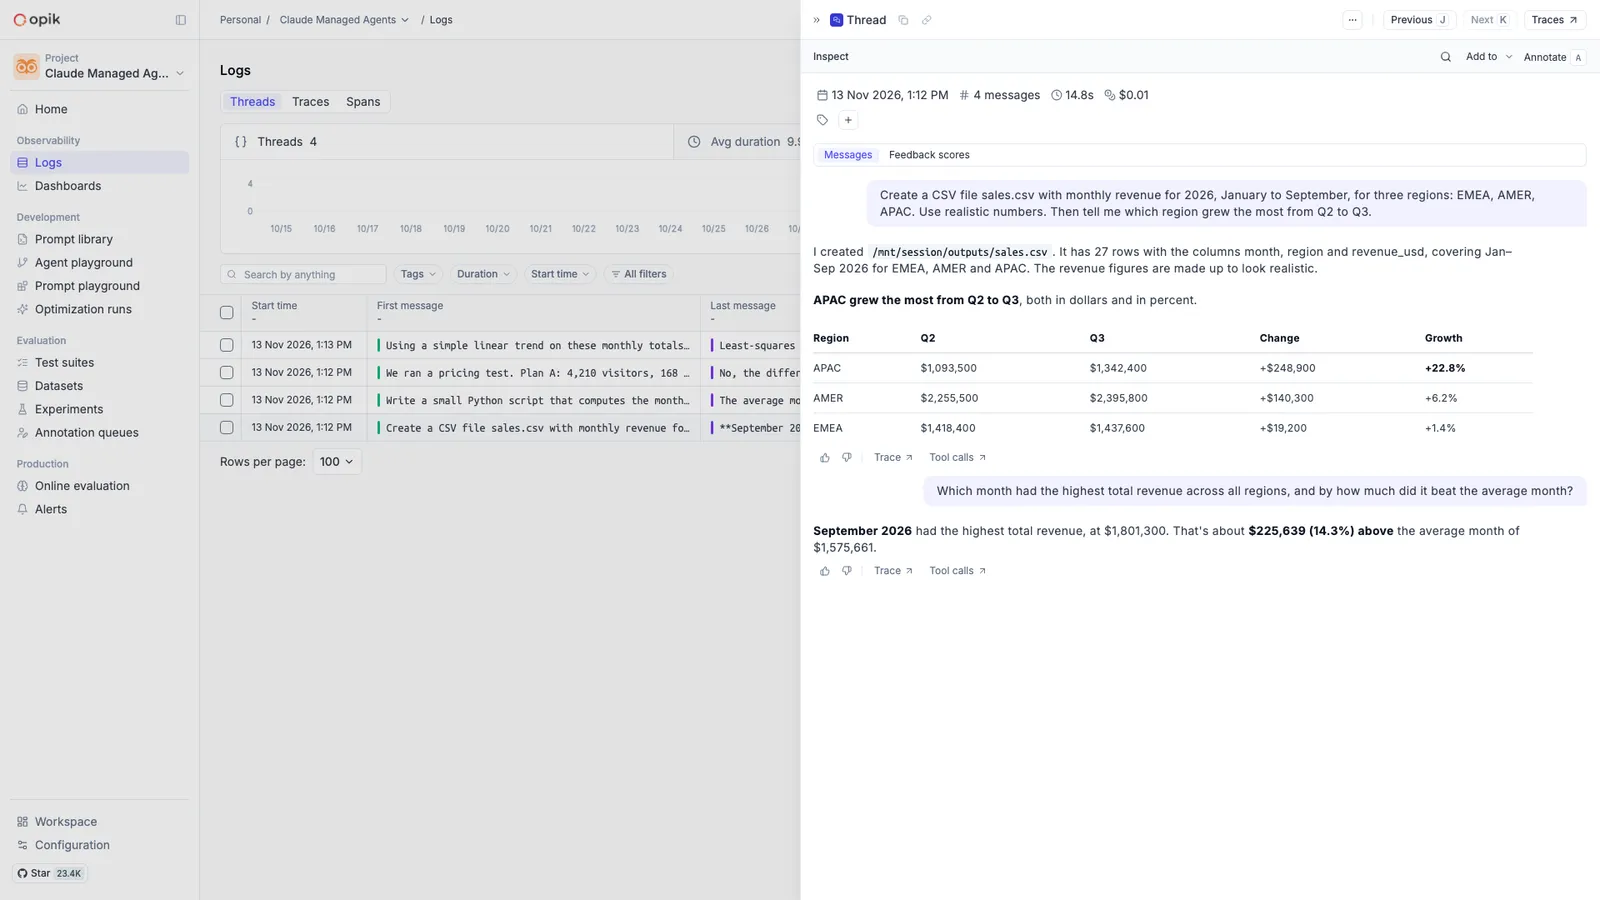
In Opik, each agent turn shows its prompt, its model requests with token usage and cost, and each tool call. Each session becomes an Opik thread.
Send traces to Opik
Managed Agents runs on the Claude Platform, or on your own infrastructure with self-hosted Claude Managed Agents. Pick the tab for your setup.
Claude Platform
Self-hosted
On the Claude Platform, the Claude API sends spans to a telemetry destination. To add one, you need the admin role in your Claude Console organization.
Add a destination
Open the OpenTelemetry settings page in the Claude Console and click Add destination. Enter these values:
For an Enterprise deployment, use https://<comet-deployment-url>/opik/api/v1/private/otel. For a self-hosted Opik instance, use https://<your-opik-host>/api/v1/private/otel.
The Authorization header value is your Opik API key alone, without the Bearer prefix.
You can also add the destination from a terminal with the ant CLI, signed in with the admin scope:
A destination receives the spans of every request in the workspaces that it covers, Messages API requests included. To send only your agents’ traces to Opik, run your agents in a dedicated Claude workspace and select only that workspace.
The Claude API sends spans only to an HTTPS endpoint on port 443 with a public hostname. A self-hosted Opik instance must be reachable from the internet at such an address.
Link the traces to your application
This step is optional.
Your application, for example a backend server, receives a message from a user and sends it to a Managed Agents session through the Claude API. The Claude API sends the agent’s spans to Opik. Your application can also send its own spans to Opik:
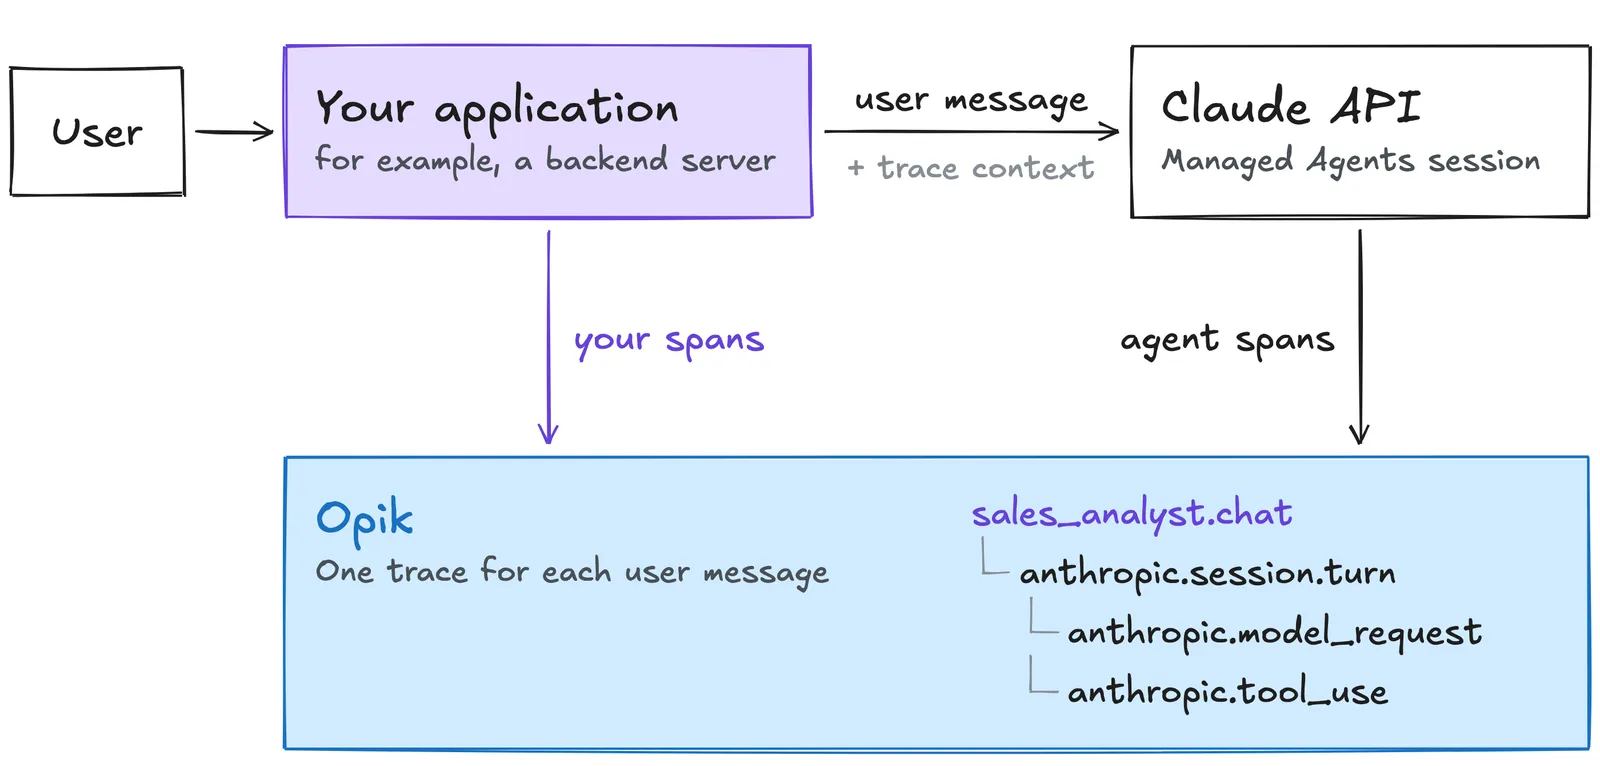
Without application spans, each user message that you send to a session starts a new trace in Opik, with only the agent’s spans. To see a request from end to end in one trace, create a span in your application for each user message. The Anthropic SDK sends the trace context with each request, so the agent’s spans become children of your span.
On your span, set input, output, and thread_id. Opik shows input and output as the input and output of the trace, and uses thread_id to group the traces into a thread.
Send your application’s spans to the same Opik project as the destination. Call provider.shutdown() before your application exits, so that the last spans are sent.
View the traces in Opik
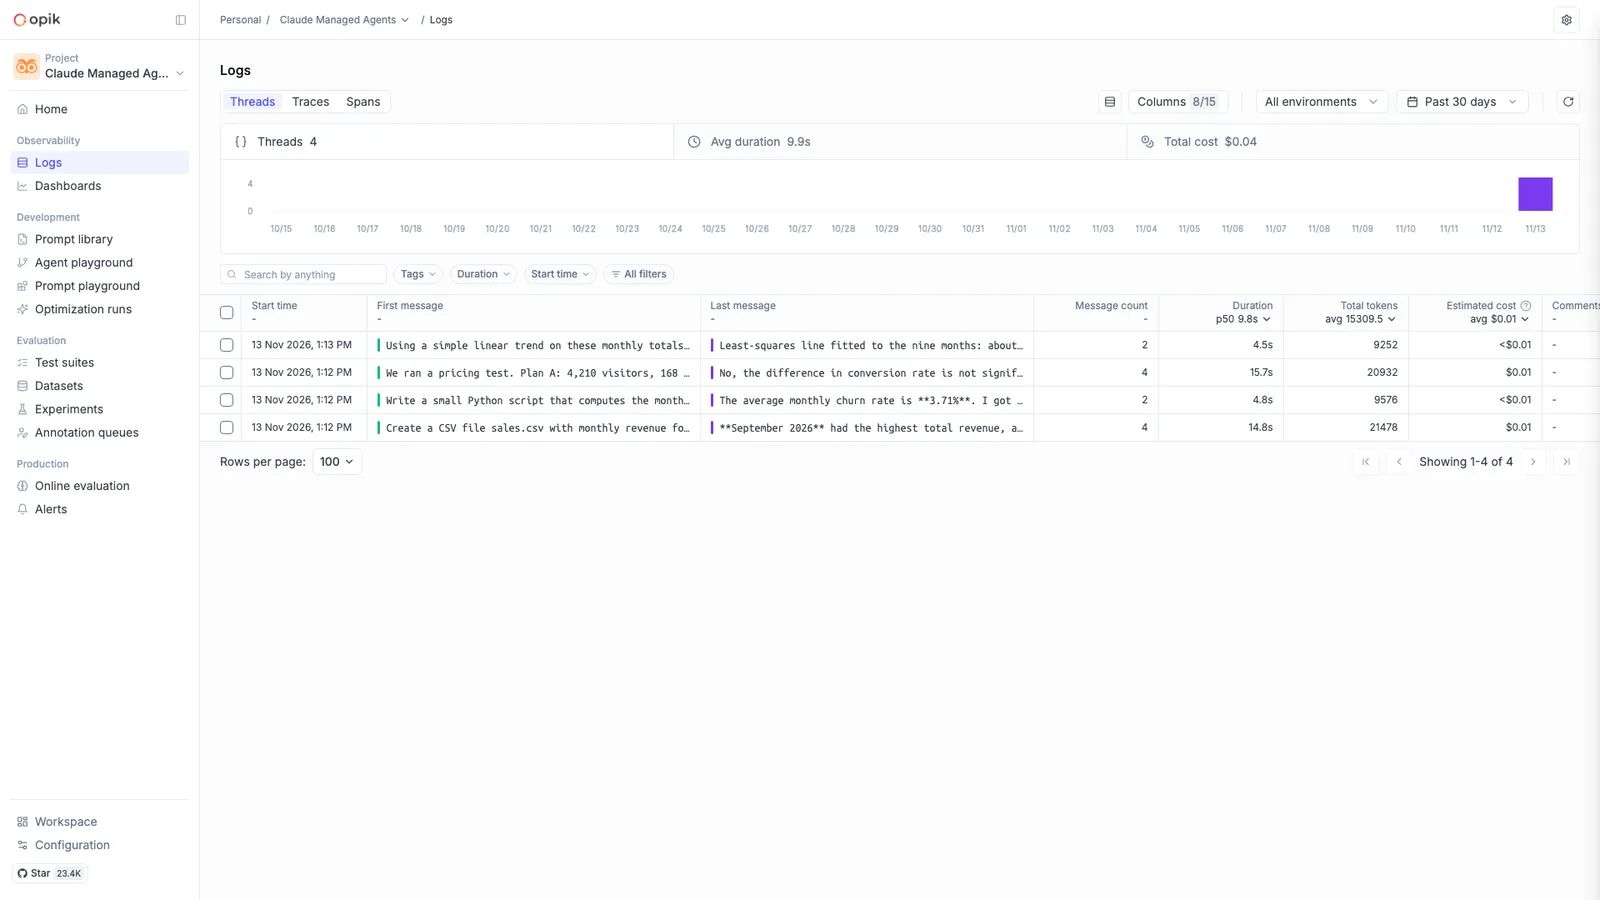
The Threads tab of your project lists each Managed Agents session, with its first and last message, duration, token count, and cost.
Open a trace to see the spans of one agent turn:
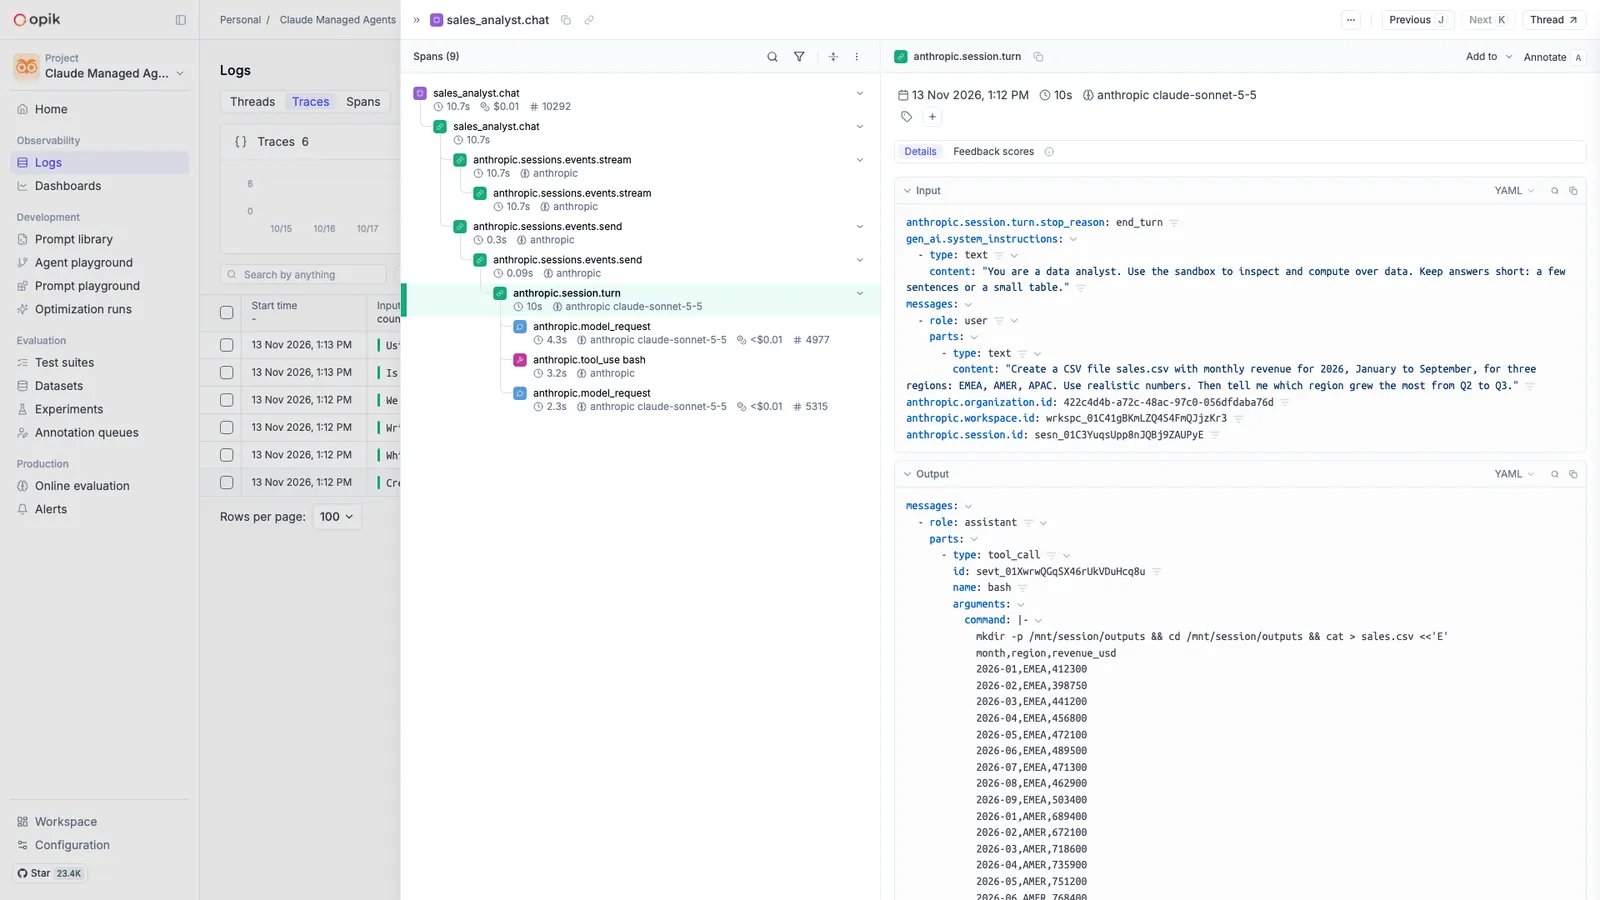
The trace shows the user message as its input and the agent’s answer as its output. In a multiagent session, the spans of all the agents go to the same Opik thread.
Next steps
- OpenTelemetry tracing for the Claude API, for the span reference and the destination limits
- Opik OpenTelemetry overview, for the Opik OTLP endpoint and its attributes
- Claude Agent SDK, to trace agents that you run with the Agent SDK