Observability for Haystack with Opik
Haystack is an open-source framework for building production-ready LLM applications, retrieval-augmented generative pipelines and state-of-the-art search systems that work intelligently over large document collections.
In this guide, we will showcase how to integrate Opik with Haystack so that all the Haystack calls are logged as traces in Opik.
Account Setup
Comet provides a hosted version of the Opik platform, simply create an account and grab your API Key.
You can also run the Opik platform locally, see the installation guide for more information.
Opik integrates with Haystack to log traces for all Haystack pipelines.
Getting Started
Installation
First, ensure you have both opik and haystack-ai installed:
Configuring Opik
Configure the Opik Python SDK for your deployment type. See the Python SDK Configuration guide for detailed instructions on:
- CLI configuration:
opik configure - Code configuration:
opik.configure() - Self-hosted vs Cloud vs Enterprise setup
- Configuration files and environment variables
Configuring Haystack
In order to use Haystack, you will need to configure the OpenAI API Key. If you are using any other providers, you can replace this with the required API key. You can find or create your OpenAI API Key in this page.
You can set it as an environment variable:
Or set it programmatically:
Creating the Haystack pipeline
In this example, we will create a simple pipeline that uses a prompt template to translate text to German.
To enable Opik tracing, we will:
- Enable content tracing in Haystack by setting the environment variable
HAYSTACK_CONTENT_TRACING_ENABLED=true - Add the
OpikConnectorcomponent to the pipeline
Note: The OpikConnector component is a special component that will automatically log the traces of the pipeline as Opik traces, it should not be connected to any other component.
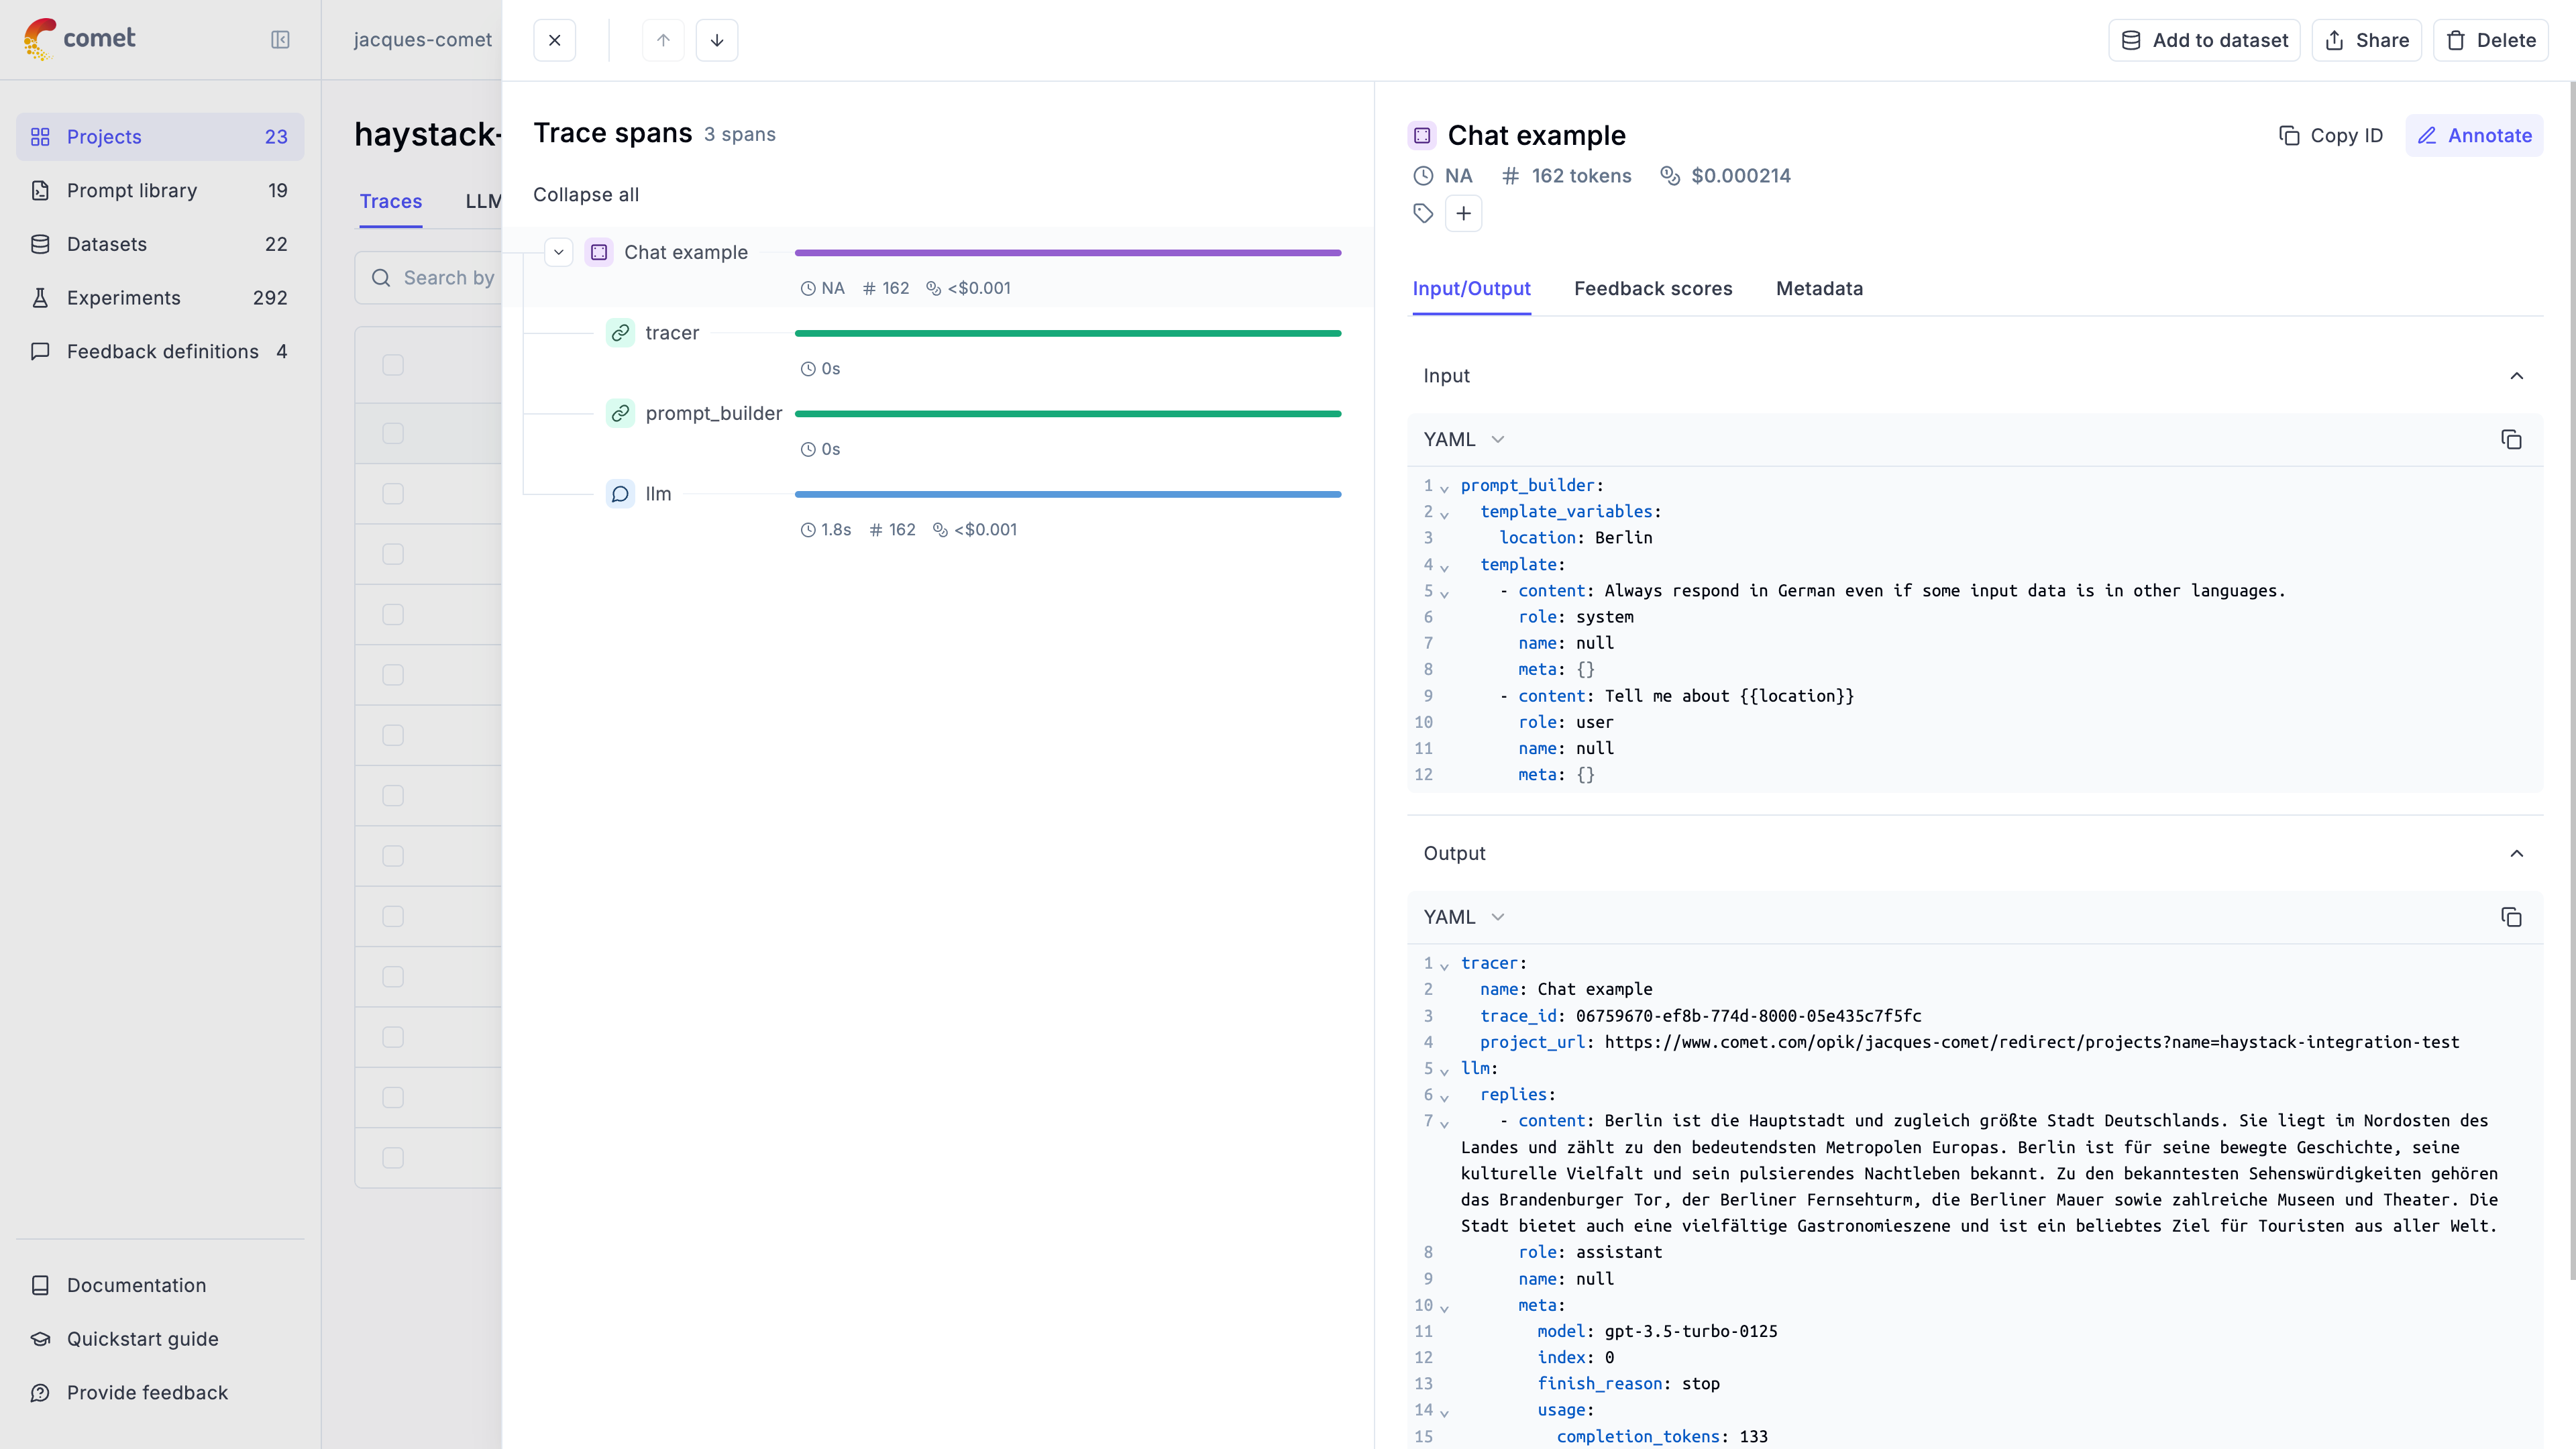
The trace is now logged to the Opik platform:
Cost Tracking
The OpikConnector automatically tracks token usage and cost for all supported LLM models used within Haystack pipelines.
Cost information is automatically captured and displayed in the Opik UI, including:
- Token usage details
- Cost per request based on model pricing
- Total trace cost
View the complete list of supported models and providers on the Supported Models page.
In order to ensure the traces are correctly logged, make sure you set the environment variable HAYSTACK_CONTENT_TRACING_ENABLED to true before running the pipeline.
Advanced usage
Ensuring the trace is logged
By default the OpikConnector will flush the trace to the Opik platform after each component in a thread blocking way. As a result, you may disable flushing the data after each component by setting the HAYSTACK_OPIK_ENFORCE_FLUSH environent variable to false.
Caution: Disabling this feature may result in data loss if the program crashes before the data is sent to Opik. Make sure you will call the flush() method explicitly before the program exits:
Getting the trace ID
If you would like to log additional information to the trace you will need to get the trace ID. You can do this by the tracer key in the response of the pipeline:
Updating logged traces
The OpikConnector returns the logged trace ID in the pipeline run response. You can use this ID to update the trace with feedback scores or other metadata: