✨ Opik Assist (Beta)
✨ Opik Assist (Beta)
Beta Feature: Opik Assist is currently in beta and available exclusively on Opik Cloud (www.comet.com). Features and functionality may change as we continue to improve the experience.
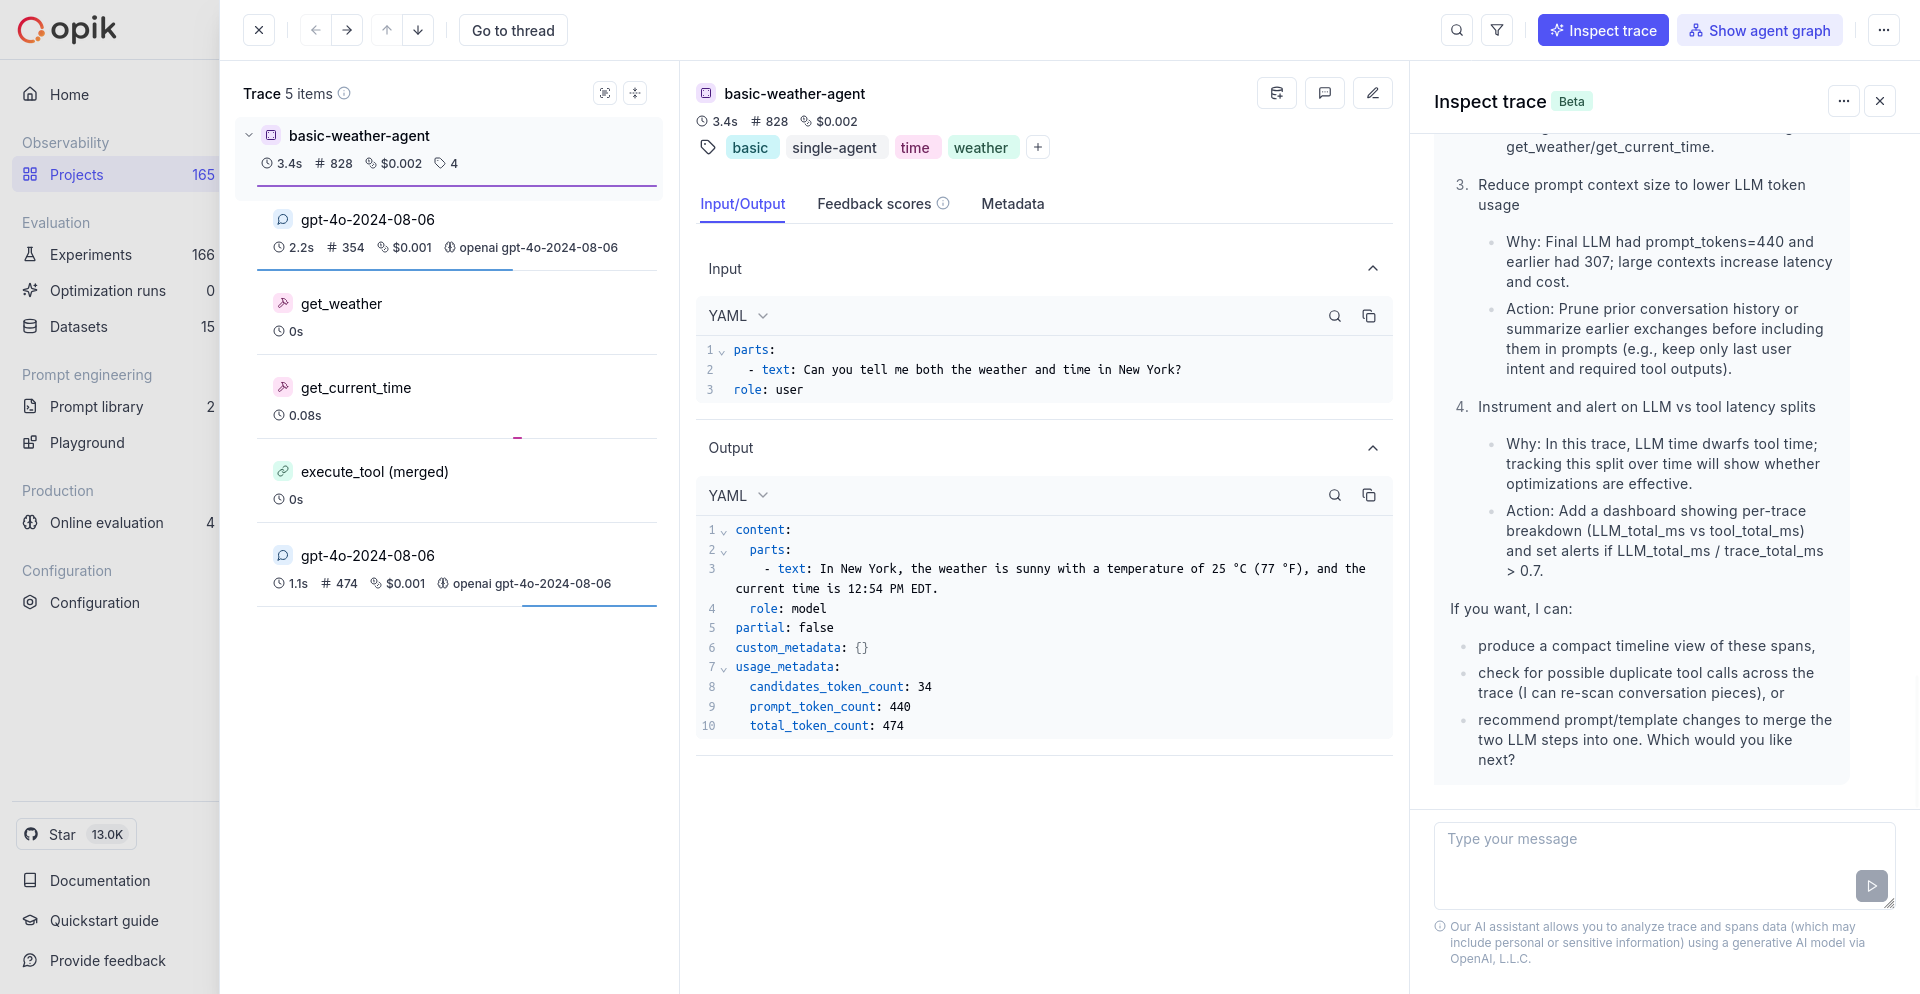
Opik Assist is an AI-powered assistant that helps you quickly analyze, debug, and optimize your LLM application traces. By conversing with the AI agent, you can:
- Ask natural language questions about your current trace and its spans
- Identify performance issues and bottlenecks automatically
- Get debugging recommendations for failed or slow operations
- Analyze patterns within the selected trace
- Understand cost implications of your LLM calls
How to Use Opik Assist
- Navigate to your project in Opik Cloud
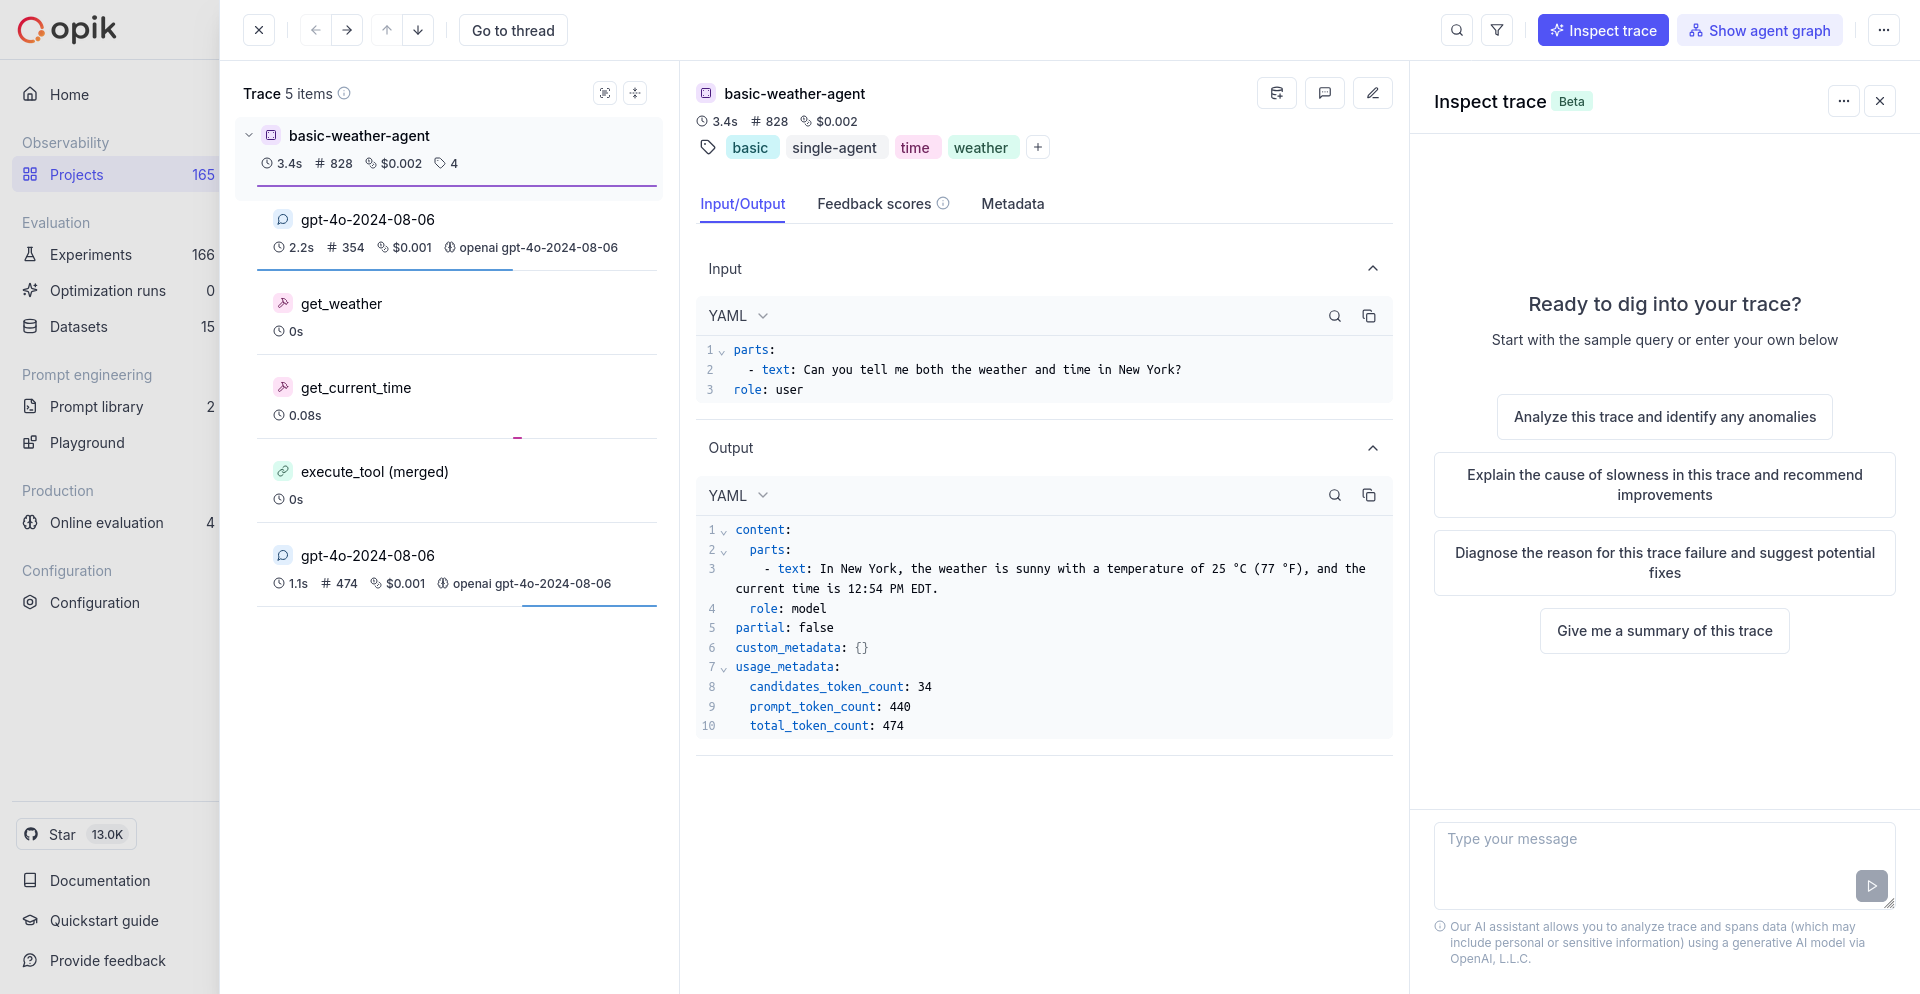
- Open any trace you want to analyze
- Click the “Debug with AI” button (marked with a Beta badge)
- Use the chat interface on the right panel to ask questions
- Type your message in the chat input and get instant analysis and recommendations
Data Privacy & Security
Your trace data security and privacy are our top priorities. Here’s exactly how your data is handled:
Privacy Guarantees
- No Training: Your trace data is never used to train AI models
- Quality Assurance Only: Comet retains logs of prompts and responses solely for internal quality assurance and debugging
- No Third-Party Training: These logs are not used for training third-party models
What Data is Shared with OpenAI
To provide intelligent analysis, Opik Assist sends the following to OpenAI’s AI models:
- Trace and span metadata: Names, timestamps, latency information
- Input/output content: The actual prompts, responses, and tool outputs from your trace
- Performance metrics: Token counts, costs, and timing data
- Error information: Any error messages or status codes in the trace
What Data is NOT Shared
- Opik system identifiers: No API keys, or authentication tokens from Opik
- Account information: No workspace or project identifying information
- Historical data: Only the current trace being analyzed
Important: While Opik doesn’t send system identifiers, your trace data (inputs/outputs) may contain personal or sensitive information that you’ve included in prompts or responses. This content will be sent to OpenAI as part of the trace analysis.
Current Limitations (Beta)
As a beta feature, Opik Assist currently has some limitations:
- Cloud Only: Available exclusively on Opik Cloud, not in self-hosted deployments
- Single Trace Analysis: Can only analyze one trace at a time, no cross-trace comparisons or aggregations
- Rate Limits: Usage may be subject to rate limiting during peak times
Feedback & Support
Since this is a beta feature, we’d love to hear your feedback:
- Report issues via GitHub Issues
- Join our Slack community for real-time support
Coming Soon: We’re working on expanding Opik Assist to self-hosted deployments and adding support for advanced analysis capabilities.