Catboost is one of the most versatile gradient-boosting models. Its crucial capability is processing categorical data without converting it to numerical data. This means that the model can perform its function as you desire after specifying categorical data. An added benefit is that a data practitioner can easily and quickly establish a baseline with minimal data transformations. Unfortunately, as you scroll through Comet’s supported libraries, you will discover the glaring lack of Catboost workflows support. Fortunately, I have a clever but straightforward workaround leveraging Comet’s versatile capabilities.
Comet’s support for Tensorflow’s Tensorboard can become a saving grace for anyone using Catboost effectively with Comet. One integral feature of Catboost is that it uses Tensorboard to keep track of training runs and stores that information locally on the machine’s disk. Let’s look at the general workflow of performing this integration.
Requirements
There are a few things you need to install before you go through with this:
1. Catboost.
2. Comet’s official library.
3. A Comet account that you can get by signing up here.
3. Visual Studio Code (or any IDE that supports Tensorboard Integration).
With the above, it is now possible to proceed.
Catboost Workflows Integration with Tensorboard
Catboost integrates with Tensorboard to ensure we can adequately visualize training runs. It indicates the desired metric that one has specified during the training run, graphs it, and allows for customization. The picture below is an excellent example of what I am talking about.
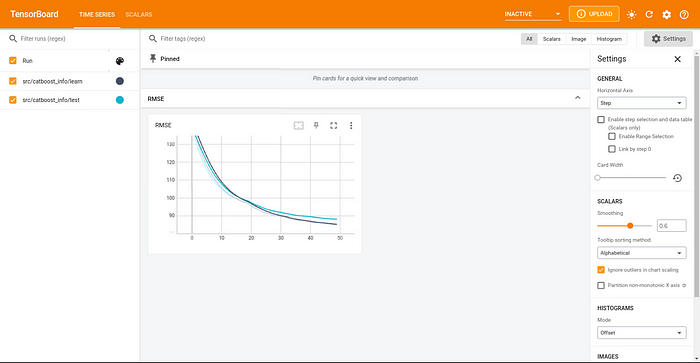
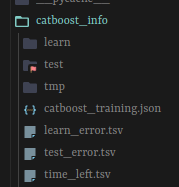
An added advantage of this library is that it stores the information in a local directory or a directory you initially specified before the training run, as seen below.
In this article, we use this feature to our advantage as Comet allows us to upload this information and create a custom panel to have a clear view of the given data. Despite the lack of support for this library, we see that the support for TensorFlow’s Tensorboard gives us an added advantage because we can leverage a single aspect of the Catboost library and upload critical information through an existing Comet function.
Let’s code!
Simple Project
Our simple project here will only focus on the capabilities Catboost, Tensorboard, and Comet offer. All data transformation has already been done, so we have a reasonably clean dataset that will be fed into the model.
The dataset of our choice is the Bengaluru House Prediction Dataset from Machinehack. This competition aims to test your skills in regression problems. We can now check our preprocessed data with Pandas to have a general overview of our data.
import pandas as pd

#reading data in local directory
df = pd.read_csv("preprocessed_train_data.csv")

#defining features(X) and targets(y)
X = df.drop(["price"], axis=1)
y = df["price"]

#printing the top 5 positions of X and y
print(X.head())
print(y.head())

Now that we have seen our myriad of features (including one categorical one), we can incorporate this into Comet.
Comet Incorporation
Note: Import the Comet library first and initialize the project before proceeding with any other code for a smoother way forward.
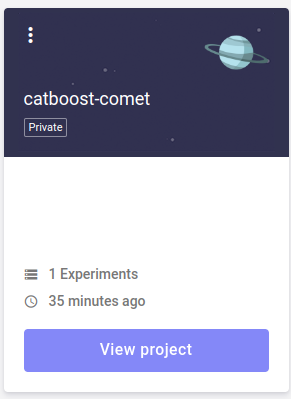
First, import the Comet library and initialize our project under the name “catboost_comet.”
import comet_ml
comet_ml.login(project_name="catboost_comet")
We then define our categorical features and perform train-validation splits for the training of our model. Catboost requires a user to specify the categorical features that a dataset has.
from sklearn.model_selection import train_test_split
import numpy as np

#defining categorical features
categorical_features_indices = np.where(X.dtypes !=np.float)[0]

#Train-test split
X_train, X_validation, y_train, y_validation = train_test_split(X, y, train_size = 0.8, random_state = 12)
Now, we can feed the above information into Catboost’s regressor and perform training.
from catboost import CatBoostRegressor
#defining model params
model = CatBoostRegressor(iterations=50, depth=3, learning_rate=0.1, loss_function='RMSE', early_stopping_rounds=5)
#training model on data
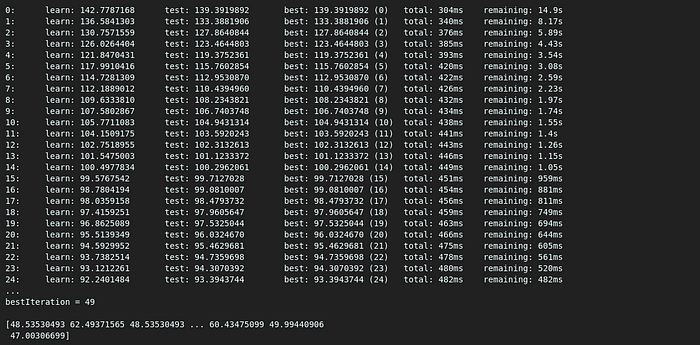
model.fit(X_train, y_train, cat_features=categorical_features_indices, eval_set=(X_validation, y_validation), plot=True)
#performing inference
y_valid = model.predict(X_validation)
After this run, there is the expectation that information on the training run will be stored in a folder for the Tensorboard to perform a visualization. This folder will be within the project’s directory. We can extract two files containing the critical info we need from it.
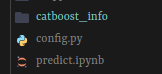
Within the “catboost_info” directory, we will find the “learn_error.tsv” and “test_error.tsv” files. We shall log these files into Comet using “log_table().”
#logging both tables to Comet
experiment.log_table("./src/catboost_info/learn_error.tsv")
experiment.log_table("./src/catboost_info/test_error.tsv")
Once those are complete, we can end the experiment and open Comet to see whether it was successful.
#Ending experiment
experiment.end()
Comet Visualization
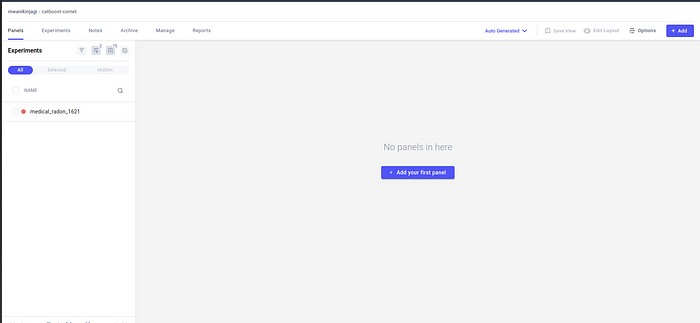
Once we open our Comet project page, we will find and open our project.
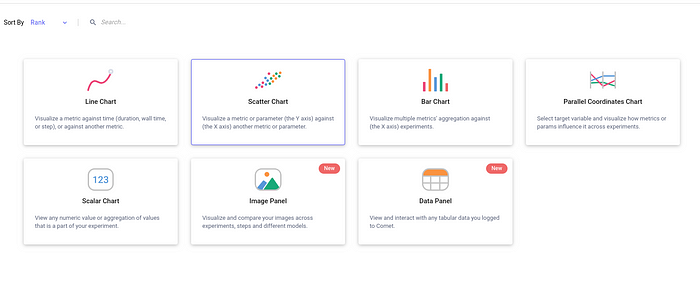
After pressing the prominent blue button in the middle, you will get the menu below and pick “Data Panel.”
After opening that menu, we will find a drop-down menu called “Data Selection,” where we will see the two tables we initially uploaded.
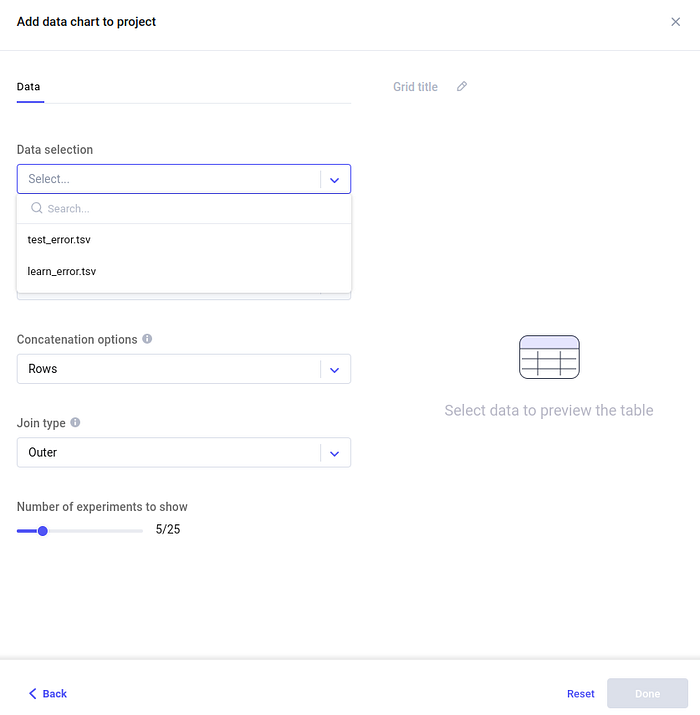
We then pick the first table, and it will give a preview of the data. After we press it, it will appear on the original page with no panels, as seen below.
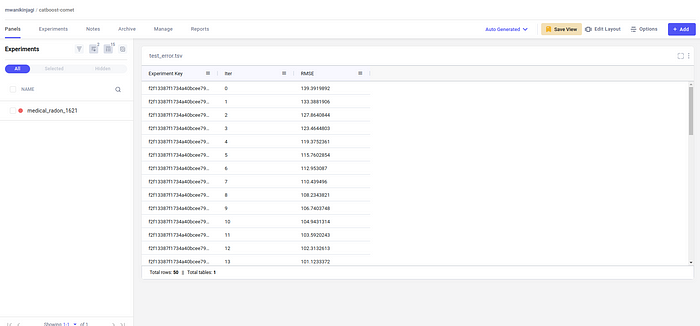
When we press “Add” in the top right corner, we see the option to add another panel, and then we can repeat the process for the other table that we logged in.
We finally have logged information concerning Catboost workflows using Comet’s support for the Tensorboard. In this tutorial, we have successfully integrated a library that Comet does not officially support.
