
-
Introducing CodeCarbon, an Open Source Tool to Track the CO2 Emissions of Research
Deep Learning’s Emissions Problem In the summer of 2019, a group of researchers led by Emma Strubell at the University…
-
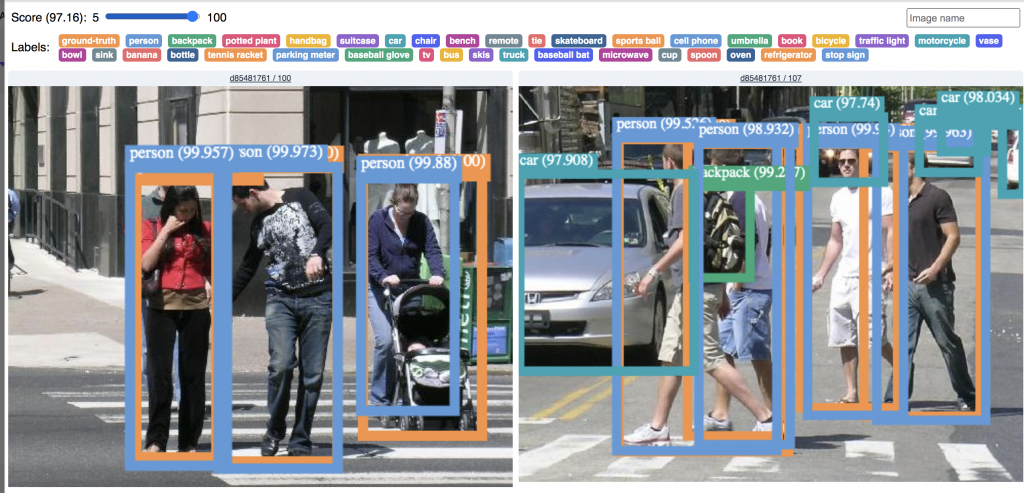
Using Custom Visualizations to Debug Object Detection Models
Check out Comet’s Custom Panel to debug Object Detection Models
-
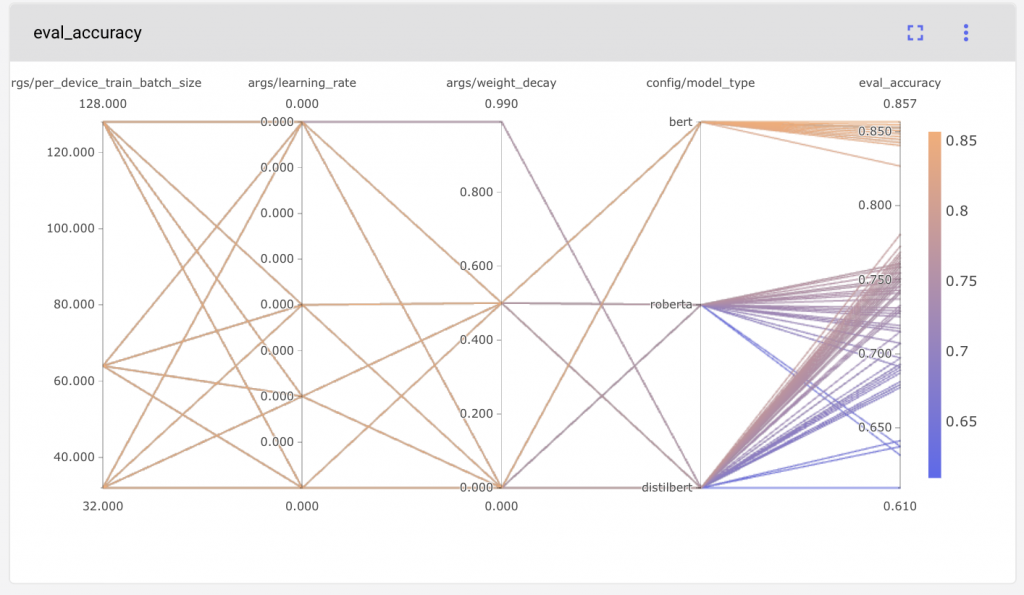
Comet ❤️ Hugging Face
Get started with auto-logging model metrics and parameters to Comet from the Hugging Face transformers library.
-
Industry Q&A: Tracking Metrics for In-production ML Models
Comet recently hosted the online panel, “How do top AI researchers from Google, Stanford and Hugging Face approach new ML problems?” This…
-
Industry Q&A: Where Most ML Projects Fail
Although every machine learning project is different, there are common pitfalls and challenges that machine learning teams face when building…
-
Industry Q&A: Starting the ML Process
One of the hardest parts of machine learning is simply getting started. See how top AI researchers are address this…

-
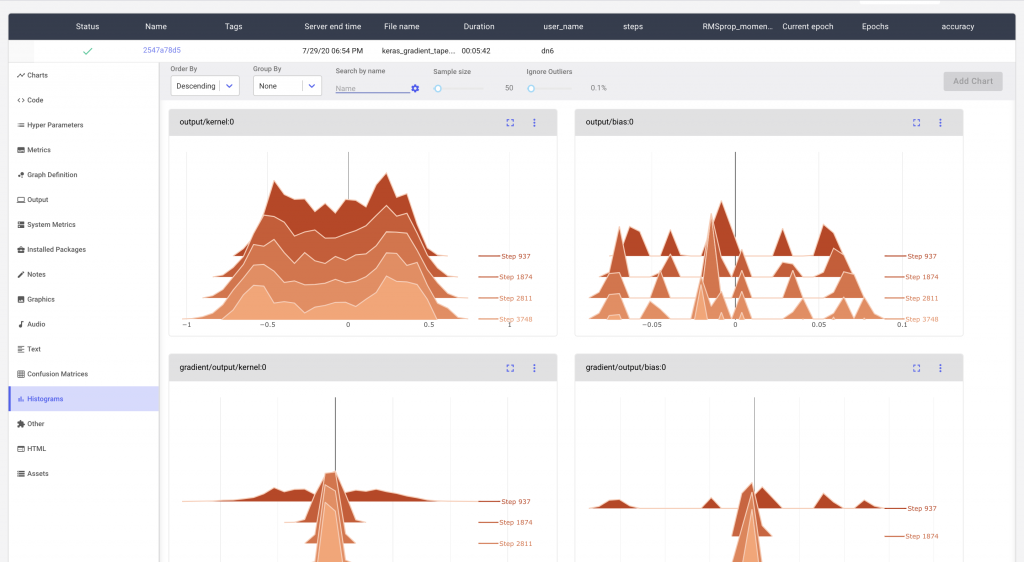
Logging Histograms, Gradients and Activations with Comet
Introduction 3D Histograms or Ridge Plots are a great way to visualize the training progress of your Neural Network. Histogram…
-
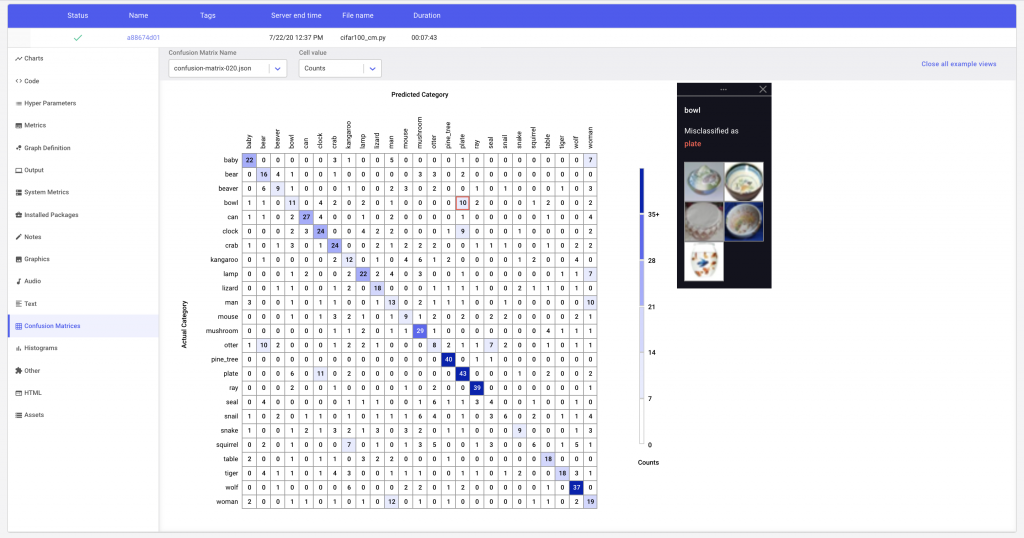
Debugging Classifiers with Confusion Matrices
A confusion matrix can provide us with a more representative view of our classifier’s performance, including which specific instances it…
-
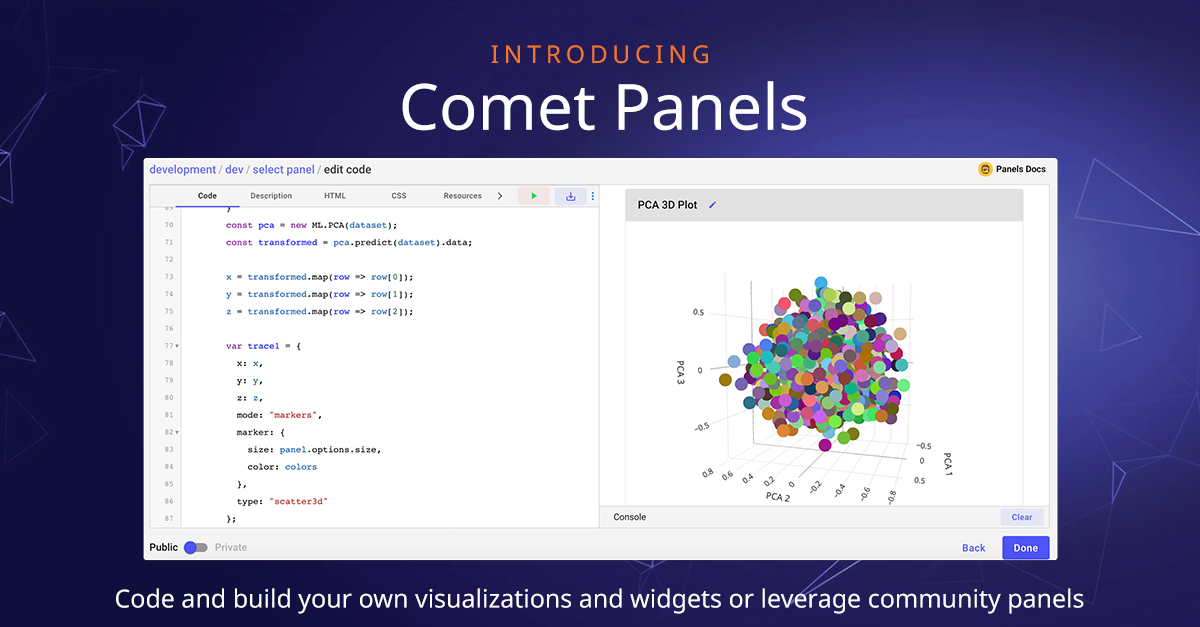
Introducing Panels: Custom Visualizations for Machine Learning
In the last three years since Comet was founded, our users and customers trained millions of models on anything from…
-
Investing in AI: Unlocking Profitable Machine Learning with Experiment Management
This post was originally published as a sponsored post by Dell Technologies and Intel on CIO.com. We live in an…

Run open source LLM evaluations with Opik!
StarComet Blog
-
From Observability to Optimization: Announcing the Opik Agent Optimizer Public Beta
At Comet, we’re driven by a commitment to advance innovation in AI, particularly in the realm of LLM observability. Our…


Get started today for free.
Trusted by Thousands of Data Scientists