In this post, we will showcase a Custom Panel dedicated to debugging object detection models.
We will use the Penn-Fudan Pedestrian Detection dataset, along with a Faster-RCNN model, with a Resnet50 backbone, that has been pre-trained on the MS COCO dataset.
All code for this post can be found in this Colab Notebook. The logged experiments can be found here.
Loading the Data and Setting up the Model
Let’s start by downloading the data
# download the Penn-Fudan dataset
!wget https://www.cis.upenn.edu/~jshi/ped_html/PennFudanPed.zip .
# extract it in the current folder
!unzip PennFudanPed.zip
Now let’s define a dataset class that will allow us to easily load the images in the dataset
import os
import numpy as np
import torch
import torch.utils.data
from PIL import Image

class PennFudanDataset(torch.utils.data.Dataset):
    def __init__(self, root, transforms=None):
        self.root = root
        self.transforms = transforms
        # load all image files, sorting them to
        # ensure that they are aligned
        self.imgs = list(sorted(os.listdir(os.path.join(root, "PNGImages"))))
        self.masks = list(sorted(os.listdir(os.path.join(root, "PedMasks"))))

    def __getitem__(self, idx):
        # load images ad masks
        img_path = os.path.join(self.root, "PNGImages", self.imgs[idx])
        mask_path = os.path.join(self.root, "PedMasks", self.masks[idx])
        img = Image.open(img_path).convert("RGB")
        # note that we haven't converted the mask to RGB,
        # because each color corresponds to a different instance
        # with 0 being background
        mask = Image.open(mask_path)

        mask = np.array(mask)
        # instances are encoded as different colors
        obj_ids = np.unique(mask)
        # first id is the background, so remove it
        obj_ids = obj_ids[1:]

        # split the color-encoded mask into a set
        # of binary masks
        masks = mask == obj_ids[:, None, None]

        # get bounding box coordinates for each mask
        num_objs = len(obj_ids)
        boxes = []
        for i in range(num_objs):
            pos = np.where(masks[i])
            xmin = np.min(pos[1])
            xmax = np.max(pos[1])
            ymin = np.min(pos[0])
            ymax = np.max(pos[0])
            boxes.append([xmin, ymin, xmax, ymax])

        boxes = torch.as_tensor(boxes, dtype=torch.float32)
        # there is only one class
        labels = torch.ones((num_objs,), dtype=torch.int64)
        masks = torch.as_tensor(masks, dtype=torch.uint8)

        image_id = torch.tensor([idx])
        area = (boxes[:, 3] - boxes[:, 1]) * (boxes[:, 2] - boxes[:, 0])
        # suppose all instances are not crowd
        iscrowd = torch.zeros((num_objs,), dtype=torch.int64)

        target = {}
        target["boxes"] = boxes
        target["labels"] = labels
        target["masks"] = masks
        target["image_id"] = image_id
        target["area"] = area
        target["iscrowd"] = iscrowd

        if self.transforms is not None:
            img = self.transforms(img)

        return img, target

    def __len__(self):
        return len(self.imgs)
Next, we’ll define some basic preprocessing operations that will turn our image data into Torch Tensors:
import torch, torchvision
from torchvision import datasets, transforms

preprocess = transforms.Compose([
  transforms.ToTensor(),
])
dataset = PennFudanDataset('./PennFudanPed', transforms=preprocess)
Finally, lets load in our model and start making predictions. Every time we make a prediction, we’re going to log the image to Comet. You will find these images under the Graphics tab of the experiment.
model = torchvision.models.detection.maskrcnn_resnet50_fpn(pretrained=True)
model.eval()

img_ids = [i for i in range(5)]
labels = []
predictions = []

for img_id in img_ids:
  img, label = dataset[img_id]

  labels.append(label)
  with torch.no_grad():
    prediction = model([img])
    predictions.append(prediction[0])

  experiment.log_image(image_data=transforms.ToPILImage()(img), name=str(img_id))
Logging Bounding Box Predictions
In order to use the Bounding Box panel, we will need to log our predictions in a particular format as a JSON file. The following snippet will convert a list of image ids, predictions, and labels into the required JSON format for plotting.
def format_predictions_and_labels(img_ids, predictions, labels, label_map):
  data = {}

  for idx, img_id in enumerate(img_ids):
      prediction = predictions[idx]
      label = labels[idx]

      predicted_boxes = prediction["boxes"].numpy().tolist()
      predicted_scores = prediction["scores"].numpy().tolist()
      predicted_classes = prediction["labels"].numpy().tolist()

      label_boxes =  label["boxes"].numpy().tolist()

      data.setdefault(img_id, [])
      for label_box in label_boxes:
        x, y, x2, y2 = label_box
        data[img_id].append({
            "label": "ground-truth",
            "score": 100,
            "box": {"x": x, "y": y, "x2": x2, "y2": y2},
        })

      for predicted_box, predicted_score, predicted_class in zip(predicted_boxes, predicted_scores, predicted_classes):
        x, y, x2, y2 = predicted_box
        data[img_id].append({
            "label": label_map[predicted_class - 1],
            "box": {"x": x, "y": y, "x2": x2, "y2": y2},
            "score": predicted_score * 100
        })

  return data
Lets format our predictions, and log them to Comet:
metadata = format_predictions_and_labels(img_ids, predictions, labels)
experiment.log_asset_data(data, "image-metadata.json")
Viewing Model Predictions in the Custom Panel
You can find the ‘Bounding Boxes’ custom panel in the Public Panels Galley. Once added, it becomes easy to view predictions from the model, as well as filter predictions out based on the confidence scores.
You can explore this Panel below
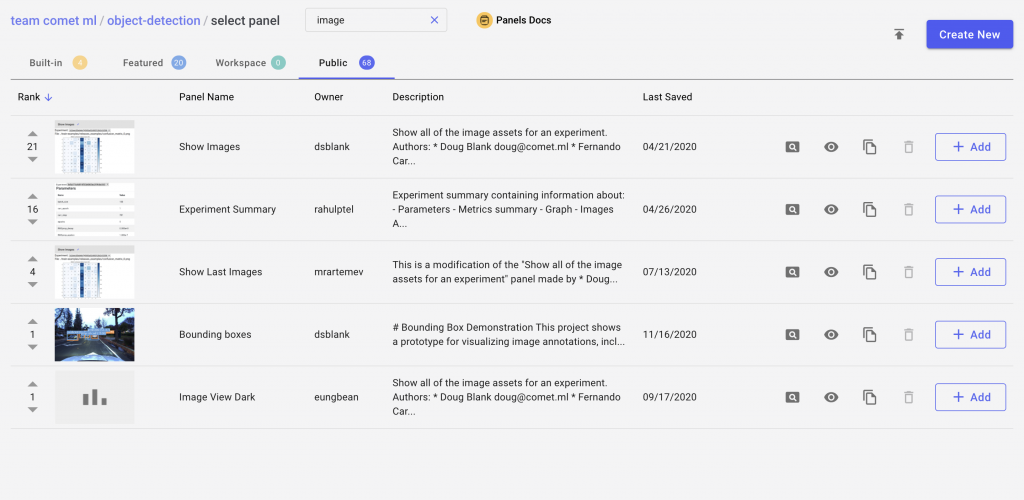
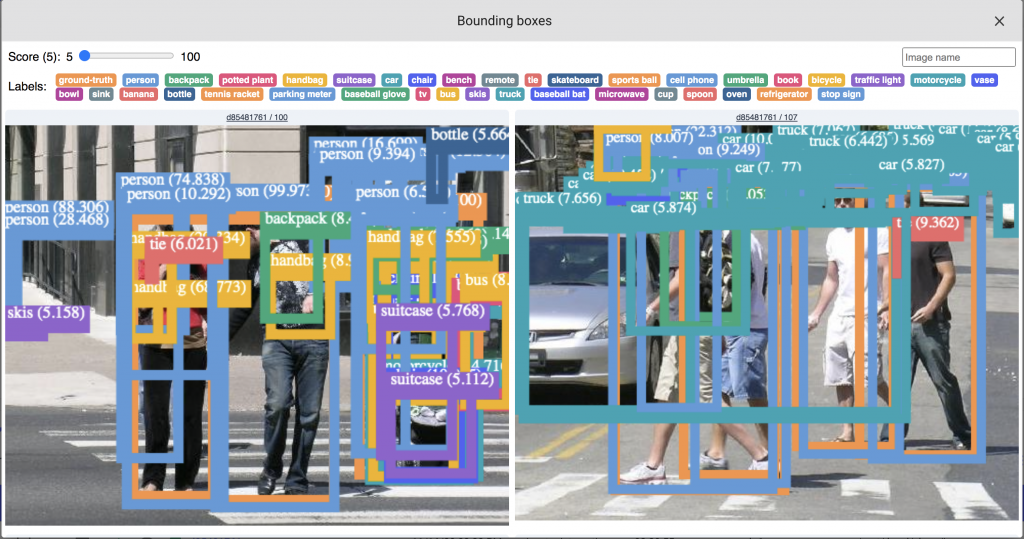
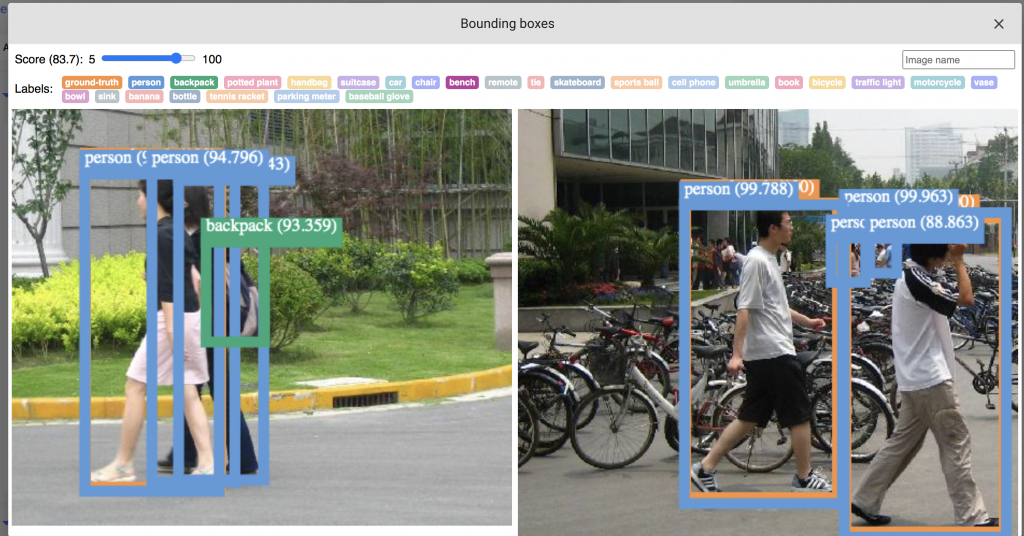
The custom panel allows filtering the detected objects by label, as well as by confidence scores.
Try out other custom panels in Comet’s Panel Gallery. Panels are highly customizable, so if you can’t find the exact visualization that you are looking for, Comet provides the tooling to help you build it yourself! Check out the Panel’s Documentation for more information.