Introduction
The Naive Bayes model is a popular machine learning algorithm for classification tasks. It uses probability concepts to make predictions based on feature independence.
You can gain valuable insights into your model’s behavior, compare different iterations, and make intelligent choices about its performance by incorporating Comet into your Naive Bayes workflow. Tracking your Naive Bayes model using Comet can significantly improve your ability to analyze and optimize its performance, whether working on a personal project or collaborating with a team.
In this article, we will look at the principles of a Naive Bayes Model and the concept of tracking Naive Bayes models with Comet, a powerful tool for experiment management and monitoring. Comet is a comprehensive platform for visualizing key metrics, hyperparameters, and other relevant information throughout the model development lifecycle.
What we’ll cover:
- What is a Naive Bayes Model
- Overview of Comet
- Importance Of Tracking a Naive Bayes Model
- Performing a Naive Bayes Project
Let’s get started.
What Is a Naive Bayes Model?
A Naive Bayes model is a machine learning algorithm and a probabilistic machine learning model used for classification processes. It’s called “naive” because it assumes that a data point’s features (or characteristics) are independent. In other words, it presumes that one attribute’s presence or absence does not affect another’s presence or absence.
For example, assume we want to create a model that can predict whether or not an email is spam based on the words it contains. To predict spam in new, unseen emails, the model must learn from labeled emails (some are marked as spam and others as non-spam).
The Naive Bayes model determines whether an email is spam based on the frequency of words in each category. It examines how frequently certain words appear in spam emails versus how often they appear in non-spam emails. The model then makes predictions based on these probabilities.
When a new email arrives, the Naive Bayes model uses the words in the message to determine whether it is spam. It counts the chances of each word appearing in spam or non-spam emails while accounting for the independence assumption. Finally, it compares the probabilities and classifies the email as spam or non-spam based on the higher probability.
Naive Bayes is based on Bayes’ theorem, which states that the probability of an event A occurring, given that event B has already occurred, is equal to the likelihood of event A occurring times the probability of event B occurring given that event A has already happened, divided by the possibility of event B occurring. It is expressed as:
P(A|B) = (P(B|A) * P(A)) / P(B)
The Naive Bayes model can effectively classify or predict the class labels of new data instances by applying this principle. It computes the probabilities of various classes based on observed features and updates them using Bayes’ theorem as new evidence is introduced. As a prediction, the model chooses the class with the highest probability. Despite its simplicity and assumptions, Naive Bayes performs well in practice, particularly in text classification and other similar tasks.
Overview of Comet
Comet is a comprehensive machine learning platform that offers many features and capabilities to assist data scientists and ML practitioners in managing and tracking their experiments effectively. It is a repository for all your experiment data, including code, metrics, parameters, and artifacts. This makes replicating experiments, debugging models, and comparing various approaches simple.
Here are some of the features and capabilities of Comet. ML
- Experiment Tracking: Comet keeps track of all the critical details of your experiments, such as the code you used, the parameters you set, the metrics you collected, and the artifacts you generated. This data is kept in a centralized location, making it simple to replicate experiments and debug models.
- Model Production Monitoring: Comet can be used to track the performance of your models in the field. Metrics such as accuracy, latency, and throughput can be tracked, which can assist you in recognizing and fixing any issues with your models.
- Visualization: The platform provides interactive visualizations that allow you to explore and analyze the results of your experiments. Charts, graphs, and histograms can be used to gain insights into model performance, metrics, and trends. Visualizations assist you in making data-driven decisions and comprehending the behavior of your models.
- Comparison: Model comparison is made more accessible by the platform’s ability to compare different iterations or versions of your models. You can compare and contrast their performance, allowing you to identify improvements or regressions. Comparisons assist you in making educated decisions about model selection and improvement strategies.
Importance Of Tracking A Naive Bayes Model
Tracking a Naive Bayes model is integral to verifying that the model is performing optimally and making reliable predictions.
These are some of the benefits of tracking a Naive Bayes Model:
- You can track the performance of a Naive Bayes model over time by tracking metrics such as accuracy, precision, recall, and F1 score. Monitoring performance allows you to detect any degradation or improvement in model performance and make the necessary modifications or improvements.
- Tracking a Naive Bayes model can also assist in detecting changes in the data used to train the model. This is significant because changes in the data can affect the model’s performance. For instance, if a new feature is added to the data, the model may need to be retrained to accommodate the new feature.
- Tracking allows you to record all the information required to replicate an experiment. This includes documenting the versions of libraries, datasets, and code used in model training. Reproducibility is critical for maintaining transparency in your work and facilitating cooperation with other researchers or team members.
- Tracking can assist you in determining the root cause of problems or unexpected actions with your Naive Bayes model. You can investigate and debug potential problems by examining the recorded metrics, hyperparameters, and other data. Tracking provides valuable insights into the model’s behavior, allowing you to diagnose and resolve issues more effectively.
Now that we’ve learned everything there is to know about Naive Bayes models let’s get creative and build one to track using Comet.
Overview of the Project
We will be dealing with weather prediction for this project. We will use the Naive Bayes Model to create a weather prediction program. The “Seattle-weather” dataset was used in this project and can be obtained from Kaggle.
Installation and Importation of Libraries
The first step is to create an account on Comet and install it by running the command:
!pip install comet_ml
Next, we will import all the libraries needed for this project:
import pandas as pd
from sklearn.preprocessing import LabelEncoder
from sklearn.naive_bayes import GaussianNB
from sklearn.metrics import classification_report, confusion_matrix
import numpy as np
import seaborn as sns
import matplotlib.pyplot as plt
from sklearn.model_selection import train_test_split
We then proceed to set up the Comet experiment:
from comet_ml import Experiment
experiment = Experiment(
api_key="insert your API key here",
project_name="your project name",
workspace="koded-ii",
)
You are to insert your API key and the name you would like to give your project in the fields labeled “your API key” and “your project name,” respectively.
Load the Data
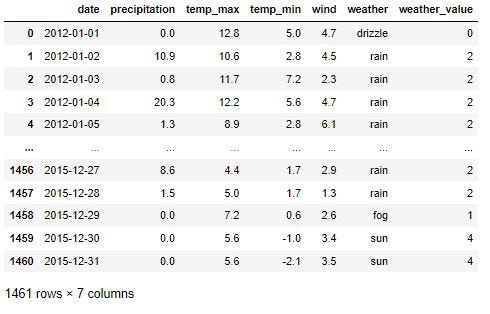
The next step involves loading our dataset. We can type the following program to load our data.
data=pd.read_csv(‘seattle-weather.csv’)
data
This command will reveal the contents of your datasets (in rows and columns).

Before we proceed further, let’s do something interesting. Let us log and visualize our dataset using the Comet data panel. To learn more about this, click on Visualizing Data Using the Comet Data Panel.
We can go ahead and type out the code.
experiment.log_table(‘seattle-weather.csv’)
Then, we make an instance of the sklearn.preprocessing library’s LabelEncoder() class. We’re attempting label encoding, a technique for converting categorical variables into numerical form. As a result, we’re instantiating the LabelEncoder class and assigning it to the variable “digits.”
Digits=LabelEncoder()
The fit() method of the LabelEncoder() class takes a list of categorical values as input and assigns a unique numerical label to each distinct category. The transform() method then takes a list of categorical values as input and returns an array of numerical labels. We’ll use both methods to convert the inputs in the weather column to numerical values while also changing the column’s name.
data[‘weather_value’]=Digits.fit_transform(data[‘weather’])
data
When this code runs, we’ll see the changes that fit_transform() performs on the data.
Next, we want to drop the “weather” column since we’ve replaced it with a column containing its numerical values. We will also remove the “date” column for the reasons below.
The Naive Bayes model is based on the premise that the features are independent. This means that the value of one feature has no bearing on the value of another. The date in a weather prediction dataset is not independent of the other features. For example, the weather on a Thursday is more likely to be similar to the weather on other Thursdays than on a Saturday.
If the date column is not removed, the Naive Bayes model will discover that it is an important feature. Overfitting will happen, which means the model will perform well on the training data but will not generalize well to new data.
With this explanation, we can go ahead and carry out the removal.
data.drop(‘date’,axis=1,inplace=True)
data.drop('weather',axis=1, inplace =True)
data
Running this code will remove the columns as planned.

The values from the ‘weather_value’ column of the ‘data’ DataFrame are now assigned to the ‘target’ variable. We’re doing this because, as the name implies, the “weather_value column” will be our output variable.
target=data[‘weather_value’]
target
After that, we store our data and target as independent and dependent variables.
X= data
y=target
The train_test_split function from the scikit-learn library is then used to separate the dataset into training and testing subsets.
The Gaussian Naive Bayes algorithm is then initialized.
X_train, X_test, y_train, y_test = train_test_split(X, y, test_size=0.2, random_state=42)
classifier=GaussianNB()
Now, we want to log the parameters of our project. This means we’re keeping track of the hyperparameters and other settings used to train the model. This information can help you understand how the model works and troubleshoot issues. We can accomplish this by running this code:
experiment.log_parameters({“Model”: “Naive Bayes”})
We are now to train our model with our training data.
classifier.fit(X_train,y_train)
We provide the training data to the classifier and start the training process by calling the classifier.fit(X_train, y_train). The classifier will learn the data’s underlying patterns and relationships using input features (X_train) and the corresponding target values (y_train).
Next, we create a variable y_pred, which will be used to make predictions using the trained classifier.
y_pred = classifier.predict(X_test)
After running this code, the variable y_pred will contain the predicted target values for the X_test inputs. These predictions can then be used for various purposes, including assessing the model’s performance and making decisions based on them.
We can calculate the accuracy of our classifier and log it to our experiment on Comet. We type the code:
accuracy = classifier.score(X_test, y_test)
experiment.log_metric("Accuracy", accuracy)
Once this is done, the accuracy of our model gets logged to our experiment on Comet, and we can check it by clicking on the URL provided when we started the project.
We can finally end our experiment with this code:
experiment.end()
Once we’ve written this code, a summary of the experiment comes up.
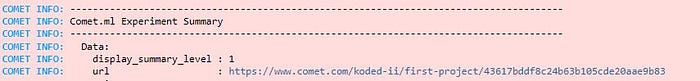
You can click the URL link to check out your experiment in Comet.
If you want to view the dataset you logged to Comet, click the link to see the dashboard.
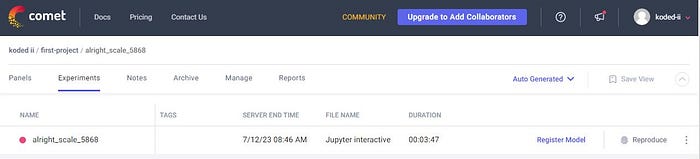
Then, before the experiment icon, click the “Panel” icon to find your dataset.

Return to the experiment icon to view the other features you’ve logged to Comet. You can experiment with logging more features, as additional features can be logged to Comet.
Conclusion
We learned the basics of a Naive Bayes model, analyzed what Comet is all about, and worked on a project that helps integrate our model with Comet. You can explore the Comet platform, find tutorials, and even practice more. You can get familiar with the functions and applications of the Naive Bayes Model and Comet as a machine learning platform.
I hope this article was helpful.
