With each new Opik release, another component of fully automated agent optimization comes to life. Now, when you give the Agent Optimizer reference points for what good looks like, you can include cost and latency metrics and let the algorithm iterate to improve your system. And when it comes to monitoring AI application performance, new custom dashboards give you one central control plane to understand changes in quality, latency, cost, reliability, and more. Read on for details about these new features, plus new native tracing for n8n workflows, simplified no-code experimentation in the playground, and more.
Automatic Agent Optimization Enhancements
The Opik Agent Optimizer automatically improves agent performance by testing and refining tools, prompts, and decision logic against evaluation data, eliminating the need for manual trial and error. Recent enhancements expand its capabilities with stronger workflows, more robust pipelines, and improved algorithm support:
- Automated cost & latency optimization: Automatically optimize agents using built-in cost and duration metrics.
- Training/validation dataset splits: Improve reliability by separating training and validation data to ensure optimizations generalize beyond a single dataset.
- New onboarding examples: Get started faster with example scripts for Microsoft Agent Framework and CrewAI that cover common optimization workflows.
- Improved workflows and algorithms: Benefit from smoother optimization flows, stronger multimodal support, and continued improvements across the Few-Shot, MetaPrompt, and GEPA optimizers for more consistent results.
Custom Dashboards
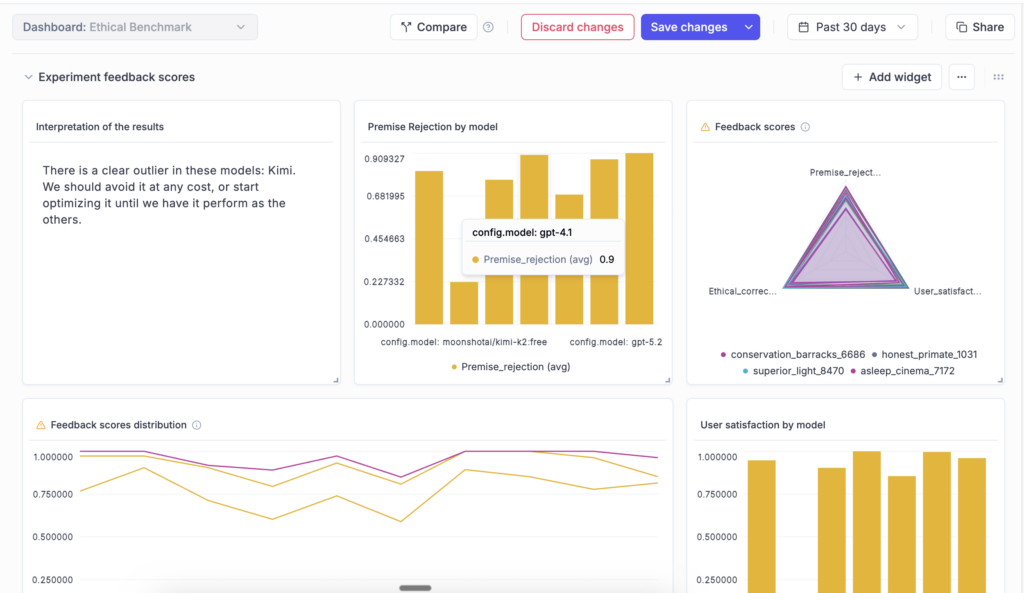
New custom dashboards in Opik let you create tailored views to track eval metrics, token usage, and cost across your projects and experiments, so you can tell at a glance whether changes improve your target metrics without introducing regressions. Combine data from logs, eval runs, and more into one central, fully customizable view with editable, pre-built templates and flexible widgets that you can customize to your preferences. Dashboards are currently in beta and will continue to evolve based on user feedback.
n8n Integration
Opik now supports native observability for n8n, the fast-growing open-source low-code agent and automation builder. With this integration, you can trace and debug your n8n-powered agent flows end-to-end, making it easier to understand execution paths, identify issues, and improve workflow reliability. The integration is built on OpenTelemetry and works with any OTEL-compatible backend, supporting open standards and flexible deployment environments.
Opik Playground Improvements for No-Code Experiments
The Prompt Playground is an interactive interface for testing prompts and models without writing code. With newly added functionality, the playground is easier to navigate and better suited for large experiments. You can move seamlessly between runs, datasets, and online metrics. Dataset tag filtering enables more targeted testing, while pagination keeps large runs responsive. A new progress bar provides visibility into long-running experiments, and model throttling and concurrency controls help you manage rate limits and cost during extensive or multimodal evaluations.
Dataset Enhancements
Opik Datasets define the inputs and expected outputs used to evaluate prompts and agents, helping you run consistent tests and compare results over time. You can now edit dataset items directly in the UI to speed up iteration, add tags to organize and filter data across evaluation workflows, and upload datasets of any size in self-hosted deployments. Navigation between datasets and the Playground has also been simplified, making it easy to move from testing to analysis.
Span-Level Eval Metrics in Production
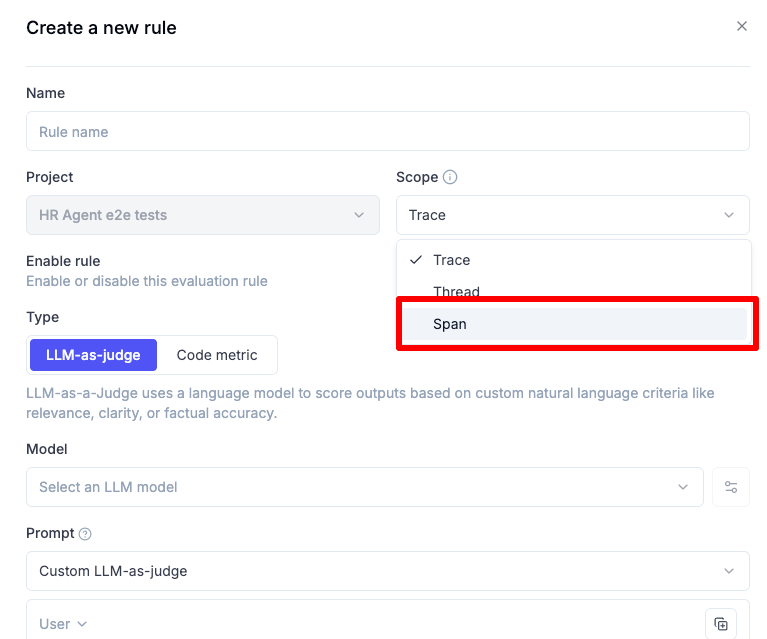
Span-level eval metrics let you evaluate the quality of individual steps in your agent flows, not just the final output. You can attach LLM-as-a-judge or code-based metrics directly to specific spans, enabling much finer-grained insight into how your agents reason, make decisions, and use tools, helping you identify bottlenecks, measure sub-task performance independently, and compare step-by-step behavior across runs or versions.
Chat Prompt Support in the Prompt Library
The Opik Prompt Library now supports structured, message-based chat prompts, making it simple to manage multi-turn conversational flows across agents and experiments. You can store, version, and reuse prompts that include system, user, and assistant turns. Chat prompts support multimodal inputs, templating, and full version history, and integrate seamlessly across all Opik tracers and SDKs.
Experiment Updates
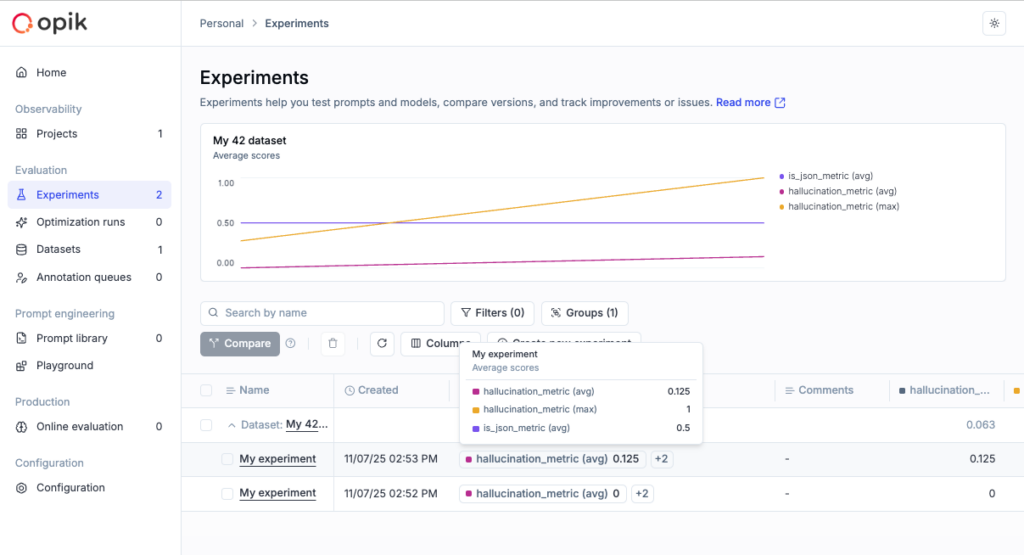
You can now compute experiment-level metrics to get a higher-level view of overall performance. Experiments can be renamed and updated directly from the dashboard, and token usage and cost are visible in the experiment table for quicker analysis and comparison.
Connect & Learn with Fellow AI Developers
Join us online and in person, connect with other AI builders, and grow your skills at our upcoming hackathons and community events.
- Commit to Change: An AI Agents Hackathon – Virtual, January 13th – February 19th, 2026
