
Do you want to quickly log your data and visualize it in Comet with the new built-in data panel tool? If yes, you are in the right place.
In this article, we will talk about how to quickly log tabular data(this means data that is displayed in columns or tables) such as generic tabular data (.dat), comma-separated values (.csv), tab-separated values (.tsv), Excel spreadsheet (.xls), Excel 2007 format (.xlsx), OpenDocument spreadsheet (.ods), OpenOffice 1.0 spreadsheet file (.sxc).
If you don’t already know about Comet, it is basically a platform for experimentation that enables you to deploy, monitor, and track your machine-learning experiments. In other to log tabular data in Comet we will make use of the experiment.log_table() method. Let’s dig a little bit deeper into this method.
Experiment.log_table
This method helps to log tabular data in Comet including data such as CSV files, TSV files, and Pandas dataframes. It is very easy to use as it provides very simple arguments.
log_table(filename, tabular_data=None, headers=False)
Where:
filenameis the name of the file ending with “.csv”, or “.tsv” (for tablular data) or “.json”, “.csv”, “.md”, or “.html” (for Pandas dataframe data), and it is required.tabular_datais a 2D tabular data or a Pandas dataframe, and it is also optional.headersthis is simply set to True or False if we want to add column headers or not.
An example:
experiment.log_table("dataset.csv",
...                      [["Name", "Age", "Married"],
...                       ["John", 37, True],
...                       ["Mark", 29, False]])
The Data panel
The primary job of the data panel is to visualize tabular data across our experiment. With the help of the panel, we can aggregate and display data on the panel’s page, filter the data, sort the data and so much more.
In the panel, the logged data are identified using unique and distinctive names e.g if we logged mnist_data.csv in experiment_1 and in experiment_2we will see a single choice to select mnist_data.csv in the data panel. The panel will read our logged CSV files, join them, and visualize them as a single table.
The data selection portion will display all of the data that we log with Experiment.log_table. Since that is how the data is joined, it is crucial to utilize the same file name throughout all of your trials.
The panel functions similarly to the pandas.concat function for aggregating data. We will be able to define the index of the data, the join type (inner/outer), and whether we want to join the data by rows or columns, just like when joining two DataFrames. Comet will add an experiment id column to the join by rows that specifies where the row originated.
Now, let’s walk through the whole process of logging tabular data and visualizing it in the data panel.
Step one: Installation
We will need to install Comet on our computer, if you don’t have it installed by now, quickly use this command in the terminal: pip install comet_ml .
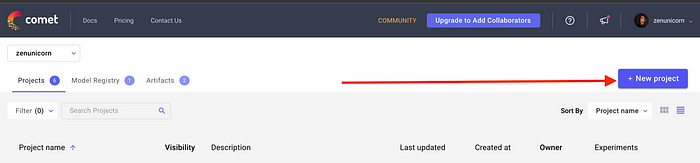
We will create an account on Comet (you can also sign in with your Github account), so that we can use be able to interact with the platform and also get our unique API key, log in to the dashboard and create a new project.
Step two: Start the Comet experiment and log the data
The next step after the successful installation import the necessary libraries and also import Comet into the notebook. This is a very simple tutorial, so we will only import Pandas.
We will grab our API key, project name and our workspace name as this will be needed for the experiment to run.
import numpy as np
import pandas as pd
import comet_ml

from comet_ml import Experiment
from comet_ml.integration.pytorch import log_model

experiment = Experiment(
  api_key = "*****",
  project_name = "testing",
  workspace="zenunicorn"
)
Step three: Import the data and log it to Comet
Using the Pandas read_csv() method we will import our data, for this tutorial we will be using a netflix_stock_price.csv dataset (Note: you are to use your dataset).
We will insert the dataset filename into the experiment.log_table() method and log it to Comet.
#importing the dataset
dataset = pd.read_csv("netflix_stock_price.csv")

# logging the dataset
experiment.log_table("netflix_stock_price.csv")

#ending the experiment
experiment.end()
Step four: Visualizing the tabular data
We will move over to the dashboard and click on our new experiment.
Click on the big blue button with the caption ADD, from the drop down we will click on the New Panel button.
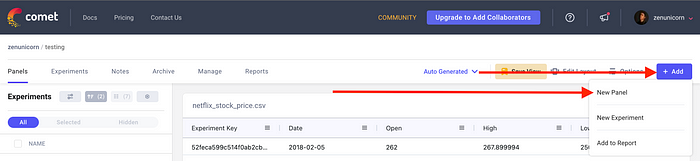
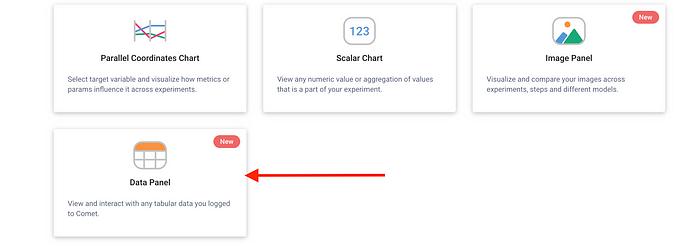
After clicking on the New Panel button, we will scroll down and click on the Data Panel button.
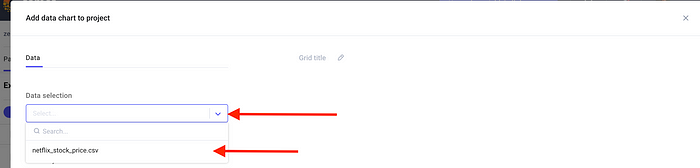
From the Data Panel button, we will be directed to a page where we can select the data from the dropdown in the Data column.
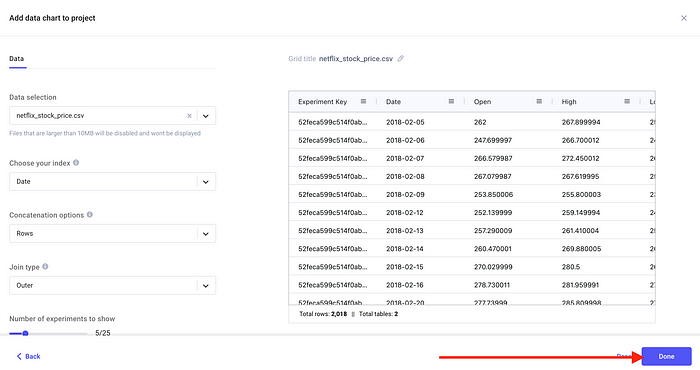
A preview of the data will be displayed on the right-hand side, and we click on Done.
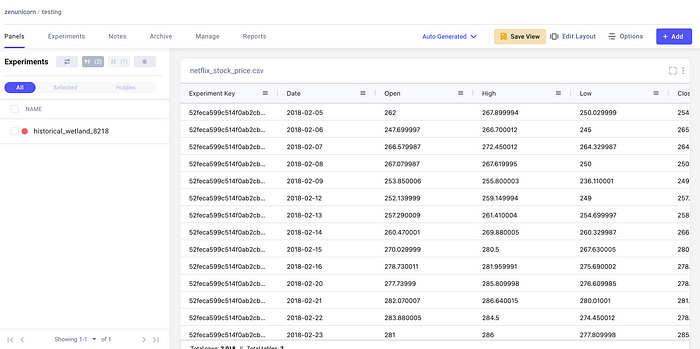
We can now head back to the experiment and we will see data displayed on the screen, where we can scroll and check all the columns in the data.
There is a couple of benefits that come with using the data panel, which include:
- It facilitates the comparison of sample-level predictions across experiments.
- It is also useful to identify the precise data samples that our model might be incorrectly classifying.
Conclusion
In this short and straightforward article, we were able to look into what tabular data means, how to log it to Comet using the experiment.log_table() method and finally visualise it using the data panel.
Resources
