Visualizing data to carry out a detailed EDA, especially for image data, is critical. In computer vision datasets, if we can view and compare the images across different views with their relevant metadata and transformations within a single and well-designed UI, we are one step ahead in solving a CV task. We
In this article, we will explore the following:
- Creating DataGrid with images.
- Adding image metadata.
- Adding bounding boxes
- Adding image masks
- Loading and visualizing image data from hugging face.
Creating DataGrid with images.
There are various ways we can construct a Kangas DataGrid. Check out this tutorial on Constructing and visualizing Kangas DataGrid on Kangas UI.
We can store images on a DataGrid using the Kangas Image() class or as Pillow images(PIL).
Loading images with Image() class
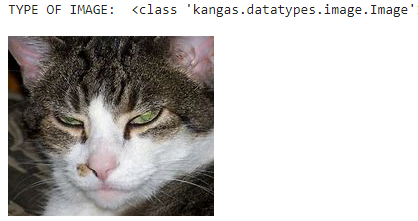
Here we will use an image of a cat and load it using the Image() class.
image = kg.Image('/content/cats-dogs/cat1.jpeg')
print('TYPE OF IMAGE: ', type(image))
print()
image.show()
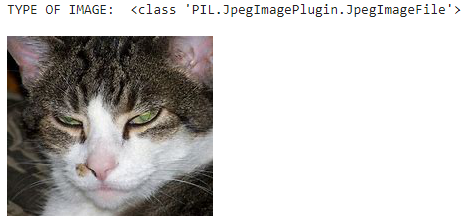
Load image as Pillow (PIL) image with Kangas
Kangas provides a to_pil() method that converts the image into a Pillow image.
image = kg.Image('/content/cats-dogs/cat1.jpeg').to_pil()
print('TYPE OF IMAGE: ', type(image))
print()
image.show()
The image data passed into the Image() class can take a variety of formats. Let’s try to load an image as a NumPy matrix and a TensorFlow Tensor. View more formats on the Creating an Image Asset
# Image
image = kg.Image('/content/cats-dogs/cat1.jpeg').to_pil()
Image data as NumPy matrix:
from numpy import asarray

numpy_img_data = asarray(image)
print(f"Type of data: {type(numpy_img_data)} data:  of Shape: {numpy_img_data.shape}")

print('TYPE OF IMAGE: ', type(image))
print()
image.show()
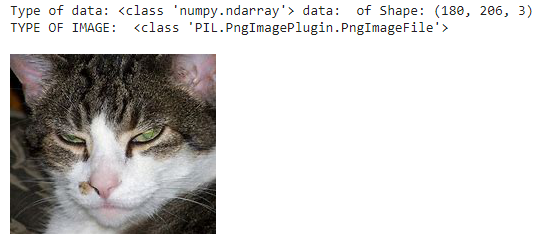
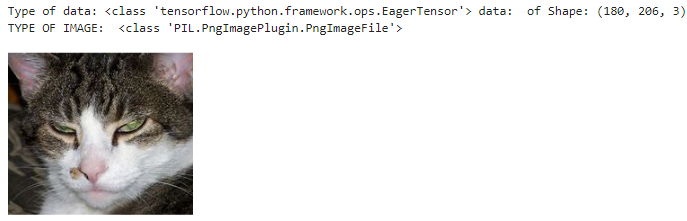
Image data as TensorFlow tensor:
import tensorflow as tf

tensor_img_data = tf.convert_to_tensor(image)
print(f"Type of data: {type(tensor_img_data)} data:  of Shape: {tensor_img_data.shape}")

print('TYPE OF IMAGE: ', type(image))
print()
image.show()
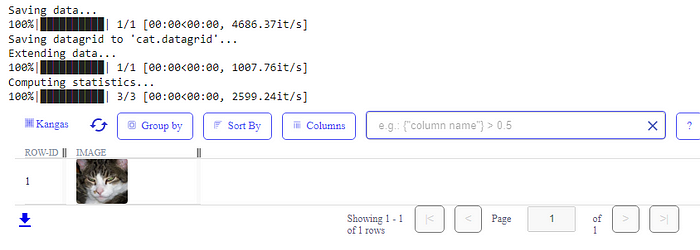
Adding images to a DataGrid
We can load the image to a DataGrid and visualize it with the UI.
image = kg.Image('/content/cats-dogs/cat1.jpeg', name='cat.jpeg') # provide name to be used as filename in metadata
dg = kg.DataGrid(name='Cat') # provide name to be used as the datagrid name
dg.extend([{'image': image}])

# Fire up the UI
dg.show()
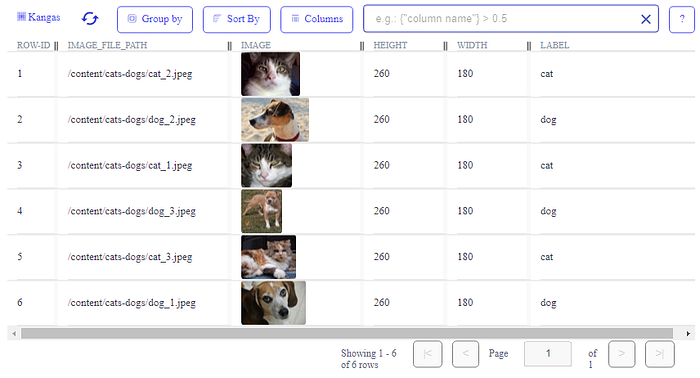
import glob

#instantiate DataGrid
dg = DataGrid(name="Images", columns=["image_file_path", "image", 'height', 'width', "label"])

# append data to DataGrid
for file in glob.iglob("/*/*/*.jpeg"):
  file_name = os.path.basename(file) # file_name to metadata
  image = Image.open(file)
  image_w = image.width
  image_h = image.height
  label = os.path.splitext(file_name)[0][:3]
  dg.append([file, kg.Image(file, name=file_name), image_w, image_h, label])
Adding Image metadata
When we create images, we can specify more data describing various attributes of the images we are working with. By default, Kangas logs out the name(as filename) and theassetId.
We can visualize this on the UI. Click on the image, and a pop window will appear. Locate the “Metadata” section and toggle the dropdown.
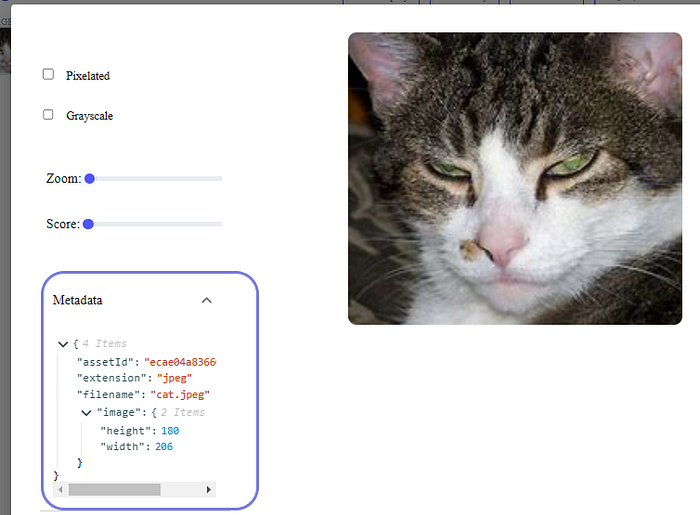
Note that the extension value is derived from the filename value. If the filename(name argument)is not provided, the value would be the file path.
The Image() class provides more optional arguments that we can provide to give more information about the image.
Image annotations like bounding boxes and masks are included as metadata.
Adding bounding boxes to image with Kangas
In object detection tasks, bounding boxes are essential as they help us determine the spatial location of a particular object.
- The bounding box can be represented by the x and y coordinates of the upper-left and lower-right corners of the rectangle.
- We can also represent the bounding box with the (x, y)-axis coordinates of the bounding box center and the width and height of the box.

The Kangas add_bounding_boxes() method can receive either of the above representations. We can pass the following to the method:
- label: a label for the boxes.
- boxes: list or tuples of exactly 2 points (top-left, bottom-right) or 4 ints (x, y, width, height).
- score: the score relevant to the bounding box.
- layer_name: the layer for the label and bounding boxes.
- id: box ids.
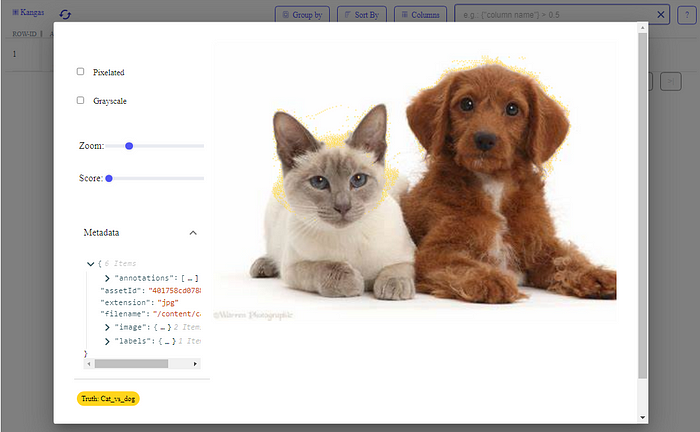
img2_aug = kg.Image('/content/cat_dog.jpg')

box1 = [(40, 65), (210, 280)]
box2 = [(222, 23),(448, 281)]
imgs_bbox = img2_aug.add_bounding_boxes("Cat", box1, score=0.89, layer_name="Truth", id='cat01')
imgs_bbox = img2_aug.add_bounding_boxes("Dog", box2, score=0.89, layer_name="Truth", id='dog01')

img_dg = kg.DataGrid(name='cat_dog')
img_dg.extend([[imgs_bbox]])

img_dg.show()
Image Masking with Kangas
Image masking lets us focus on the parts of the image we are most interested in. For instance, if we build a computer vision model to recognize faces, we can mask the rest of the image and focus on the actual faces.
While we can do image masking in various ways, for example, using OpenCV, Kangas has the add_mask() method we can use when creating an image.
With this method, a mask can be:
- A 2D array or
np.arraywith int values. - An image filename.
- A Pillow or
kangas.Image image.
image = kg.Image('/content/cat_dog.jpg')
mask = PIL.Image.open('/content/mask_truth.png')
image.add_mask({1: 'Cat_vs_dog'}, mask, layer_name='Truth')
dg = kg.DataGrid(name="model1")
dg.append([image])
dg.show()
Loading and visualizing image data from hugging face.
We can visualize and apply built-in functions from Kangas UI on hugging face datasets with Kangas. Hugging Face contains a collection of datasets we can use to build various models.
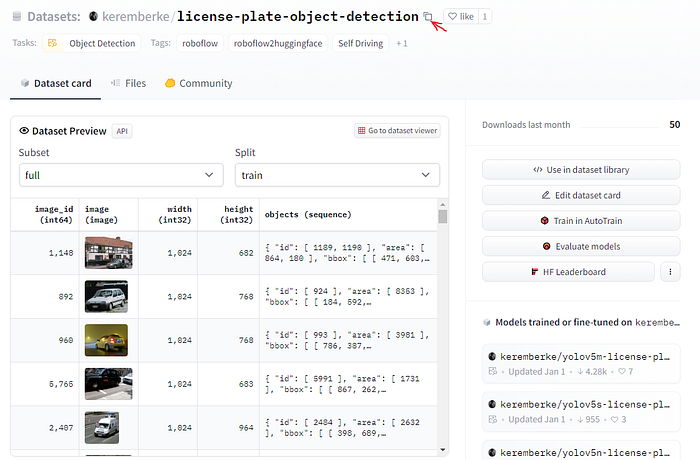
In this section, we will see how to create DataGrid from hugging face datasets and visualize them on the Kangas UI. We will grab the license plate object detection dataset.
First, import the datasets library to enable us to grab the dataset:
%pip install datasets
Next, import the following:
import datasets
from datasets import load_datasets, list_datasets
For the simplicity of this article, we will only split 20 examples from the training set of the dataset.
license_dataset = load_dataset('keremberke/license-plate-object-detection', 'full', split='train[:20]')
license_dataset
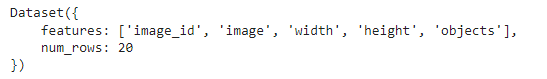
We have 5 features, and we have split 20 examples.
Let’s load the datasets into a Kangas DataGrid and visualize it in the UI:
dg_obj_detection = kg.DataGrid(licence_plate_dataset, name='Licence_plate_obj_detection')

dg_obj_detection.show()
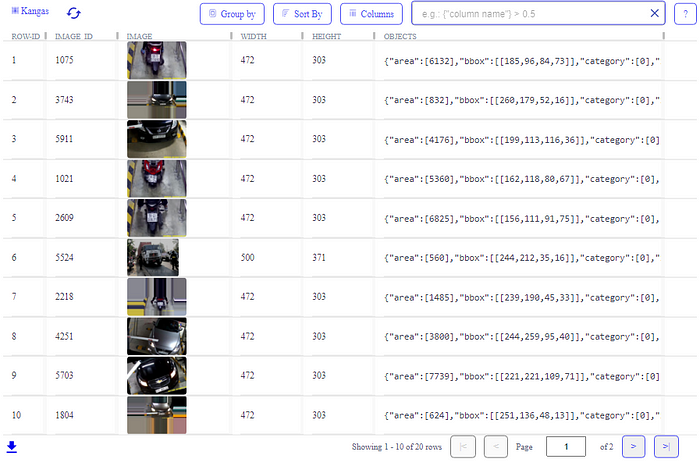
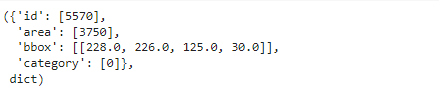
The image annotations are stored as dictionary objects in the ‘objects’ column. Let’s see the annotations of the first image:
annotations = license_dataset[0]['objects']

annotations, type(annotations)
We can also view this clearly by clicking the object column of any of the images:
Final thoughts
This article taught us how to create and visualize image data on the Kangas UI. We can visualize image data more efficiently, quickly, and with few lines of code without complicated functions and libraries.
While this is an overview, there is still more that we can do with Kangas. Be sure to explore more on the Kangas repo.
