Introduction
Object detection tasks can be particularly tedious to debug. If you’ve worked with large object detection datasets in the past, chances are you’ve run into incorrectly labelled data or data that’s missing labels that end up killing your evaluation metrics. Identifying these issues usually involves manually inspecting the individual problematic examples in your dataset.
The other issue with object detection is that these models usually output multiple detection boxes for a given image, and evaluation metrics have to be calculated based on different threshold parameters that control the strictness of our detection criteria.
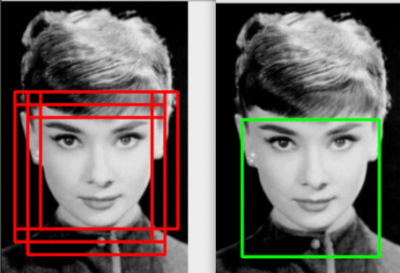
Applying Non Max Suppression to Predicted Bounding Boxes to produce a Single Bounding Box Prediction
The most important parameter in this case, is the Intersection over Union (IoU) threshold. This parameter controls the number of returned bounding boxes in the model’s prediction via Non-Max Suppression (NMS), and it also determines how strictly we evaluate whether or not the model has detected a valid object.
The Mean Average Precision (mAP) and Recall metrics for object detection models are usually reported at a particular IoU threshold.
The Problem
Let’s say you’re evaluating an Aerial Object Detection model based on drone data. You have a sense of how your model is performing at a particular IoU threshold, but you can’t help wonder what would happen if you’d tried a higher threshold value when running the evaluation?
Additionally, you find that your evaluation dataset has examples of incorrectly labelled data that you’d like to remove. What do you do then?
Ordinarily, these steps this would involve writing a script to remove bad examples from the dataset, and re-running your evaluation script or notebook with updated parameters. Depending on the size of the dataset and model, this can take quite a while. Also, if you’re making edits to your dataset, you need to be able to track which examples are being removed or updated so that you can ensure you’re not changing the distributions within your dataset.
Wouldn’t it be nice if we could just upload our data and predictions somewhere, compute evaluation metrics in a more ad-hoc manner, identify bad data points, and update the dataset without having to change or write additional code?
Wouldn’t it be nice if we could just upload our data and predictions somewhere, compute evaluation metrics in a more ad-hoc manner, identify bad data points, and update the dataset without having to change or write additional code?
It used to take weeks of work to build a system like this. But in this post, I’m going to show you how you can set up this system in an afternoon using Comet and Aquarium.
Aquarium is an ML data management platform that focuses on improving models by providing tooling to explore and improve datasets.
Comet is an MLOps Platform that is designed to help Data Scientists and Teams build better models faster by providing tooling to track, explain, manage, and monitor models in a single place.
The Proposed Solution
You can follow along with the steps to build this solution in this Colab Notebook
Our objective is to build an evaluation system that lets us:
- Track the dataset that was used in the evaluation process
- Explore this dataset as needed
- Adjust metric thresholds when evaluating predictions
- Flexibly make updates to the dataset
For this example, we’re going to use the DOTA dataset and a pretrained object detection model based on FasterRCNN.
Tracking the Data with Comet Artifacts
The first thing we need is a way to track the data samples that we’re going to use in our model evaluation.
Our entire dataset lives in a remote S3 bucket. The bucket includes a folder with images and a metadata file containing the annotations in the COCO format.
Comet Artifacts is a tool that provides a convenient way to log, version, and browse data from all parts of their experimentation pipelines. It allows you to track and version local or remote datasets, ensuring that you know exactly what data your model used.
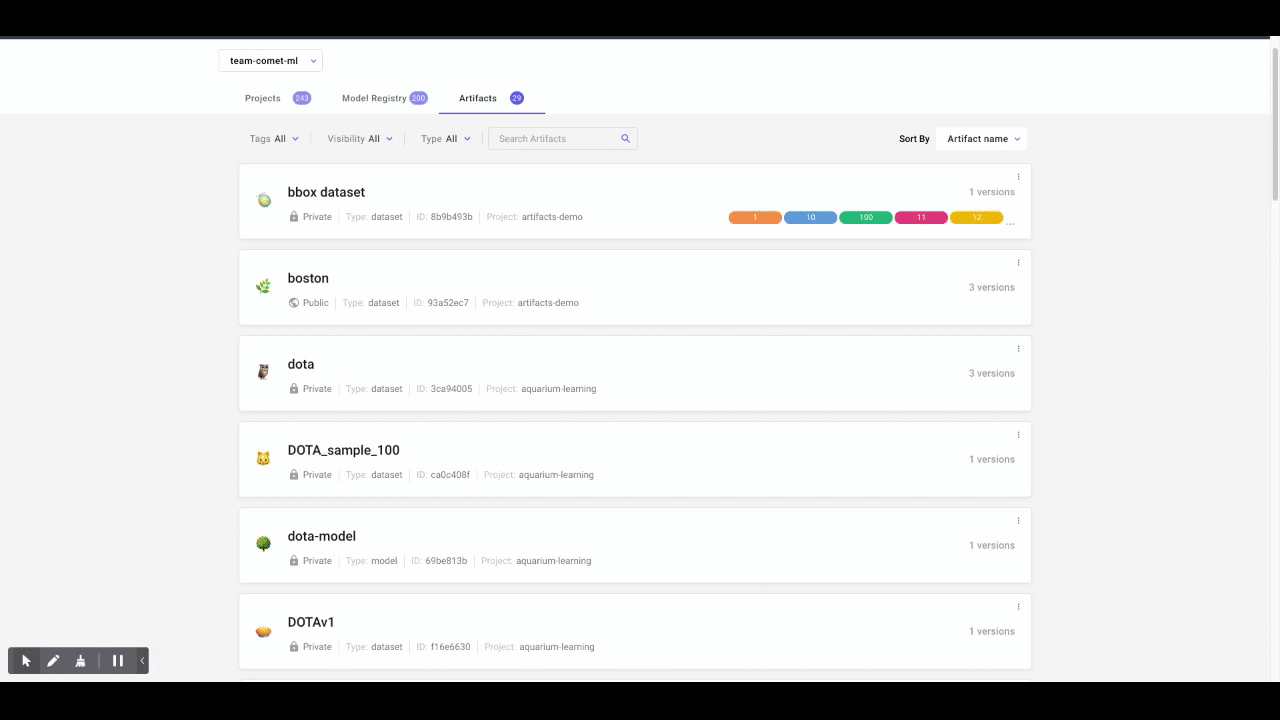
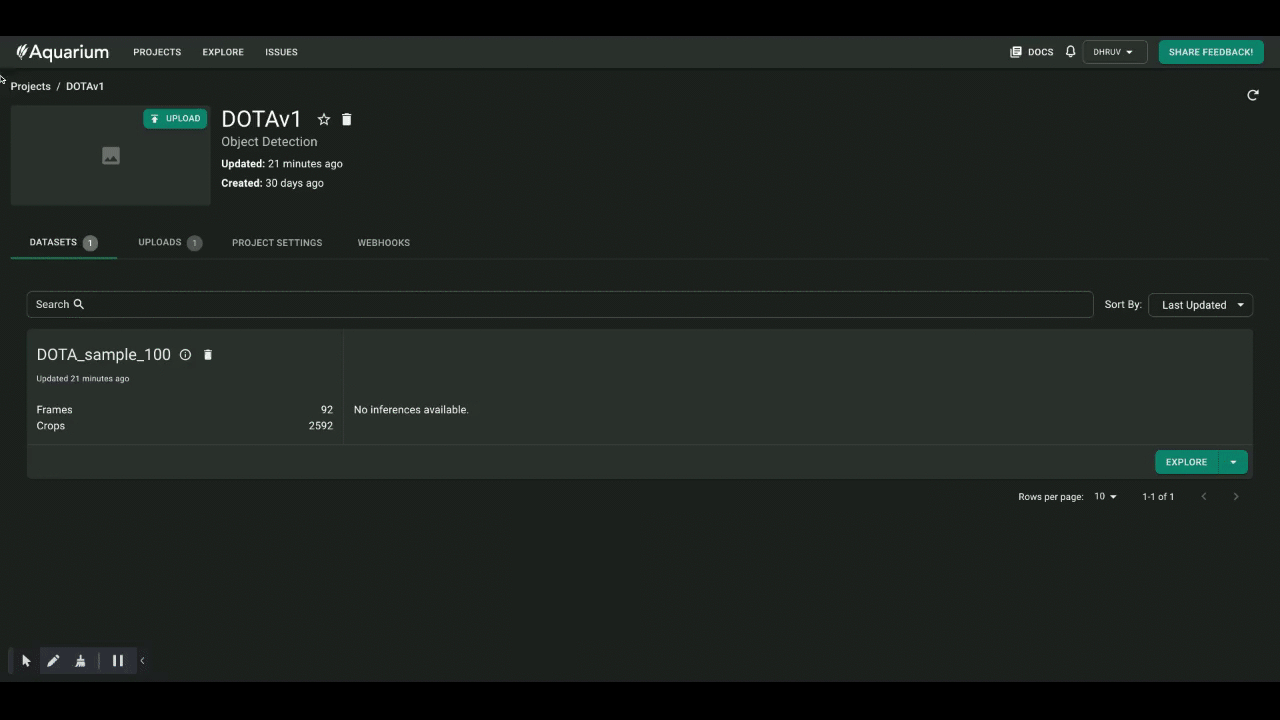
Tracking the DOTA Dataset with Artifacts
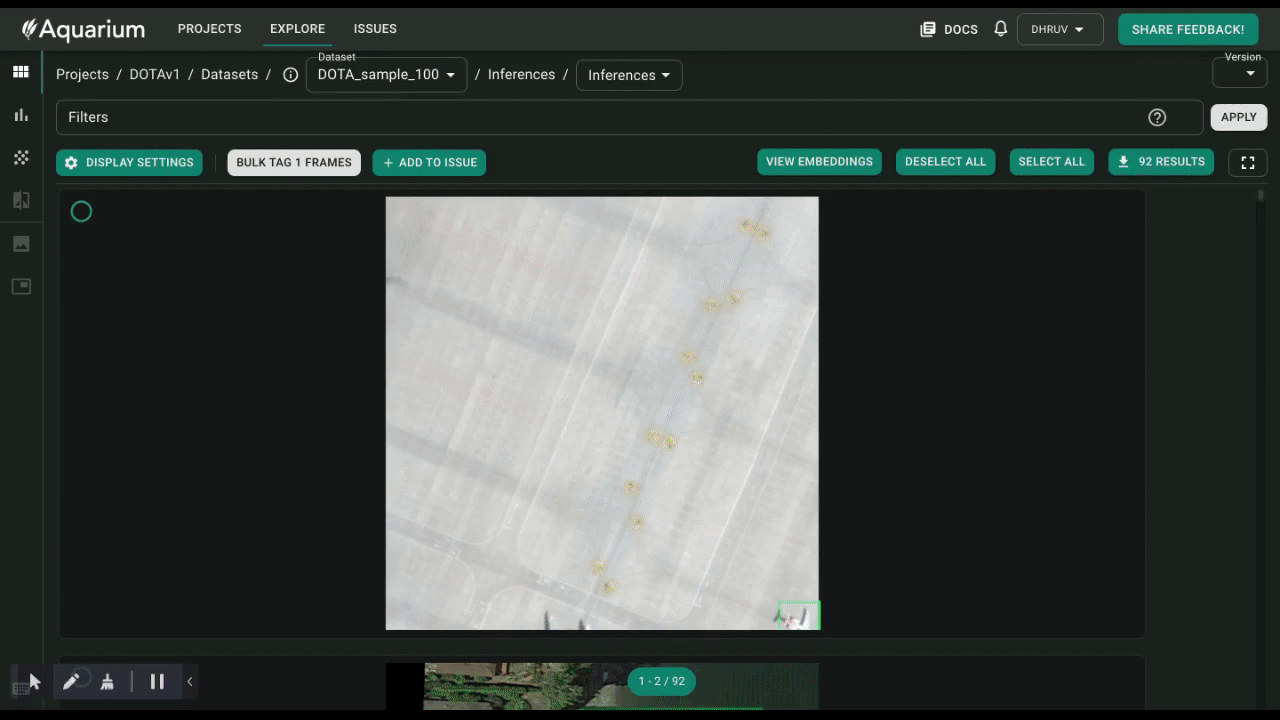
Data Exploration With Aquarium
Exploring Individual Examples
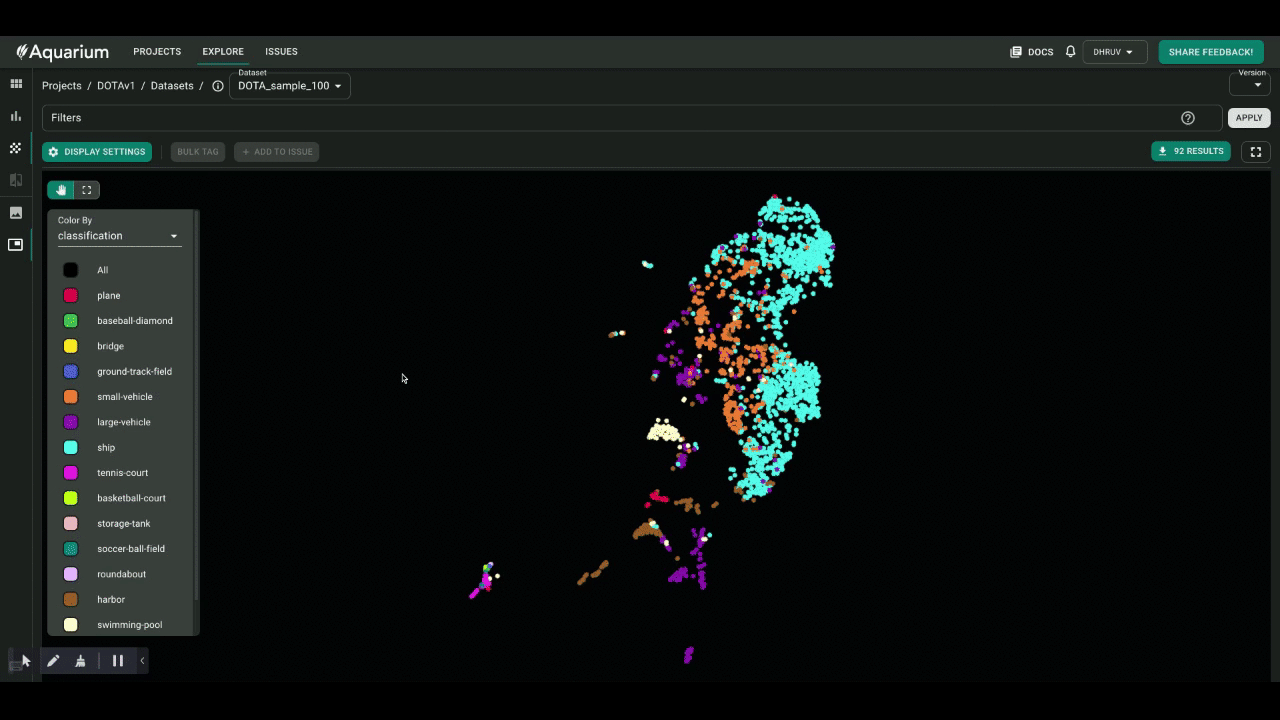
Aquarium allows you to view individual examples in the data, visualize the distribution of labels, and traverse the entire dataset using the built in embeddings viewer. Embeddings can be generated for the entire image, as well as for the individual objects present inside the bounding boxes.
Embedding Viewer
Below, you can see how we use the embeddings viewer to highlight similar examples in the data. Highlighting images with swimming pools shows us a collection of pictures with a harbor. We can also see that one of images has not been correctly labelled. The image “harbor 9950” does not actually have a harbor in it. Other images in this sample could have issues, too. Let’s try running our model on this data to find out.
Identifying Incorrectly Labeled Samples
Running an Evaluation With Artifacts
For this example, I’ve already trained an object detection model using FasterRCNN and saved it as an Artifact. An Artifact Version is linked to the Comet Experiment that produced it, so you can easily view the model training metrics, hyperparameters, and training code that produced this model.
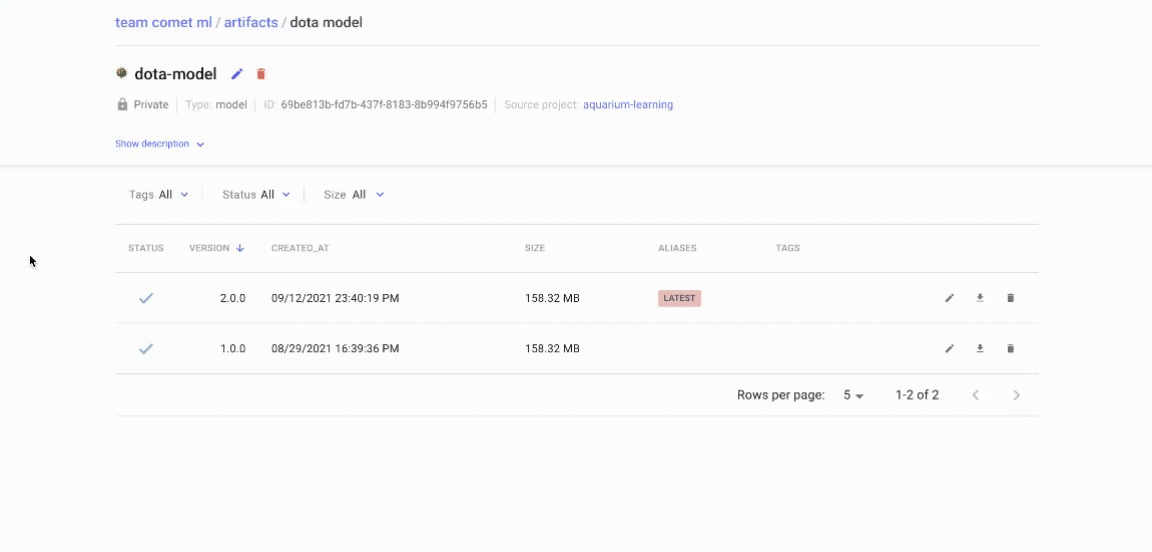
Using Artifacts to track Model Information
We’re going to fetch this model using Comet and log inferences from it to Aquarium. Once these are logged, we can use the Model Metrics tab to compute evaluation metrics at any threshold we like—we can also view the examples or label classes that the model is most confused by, and create issues to deal with problematic data points.
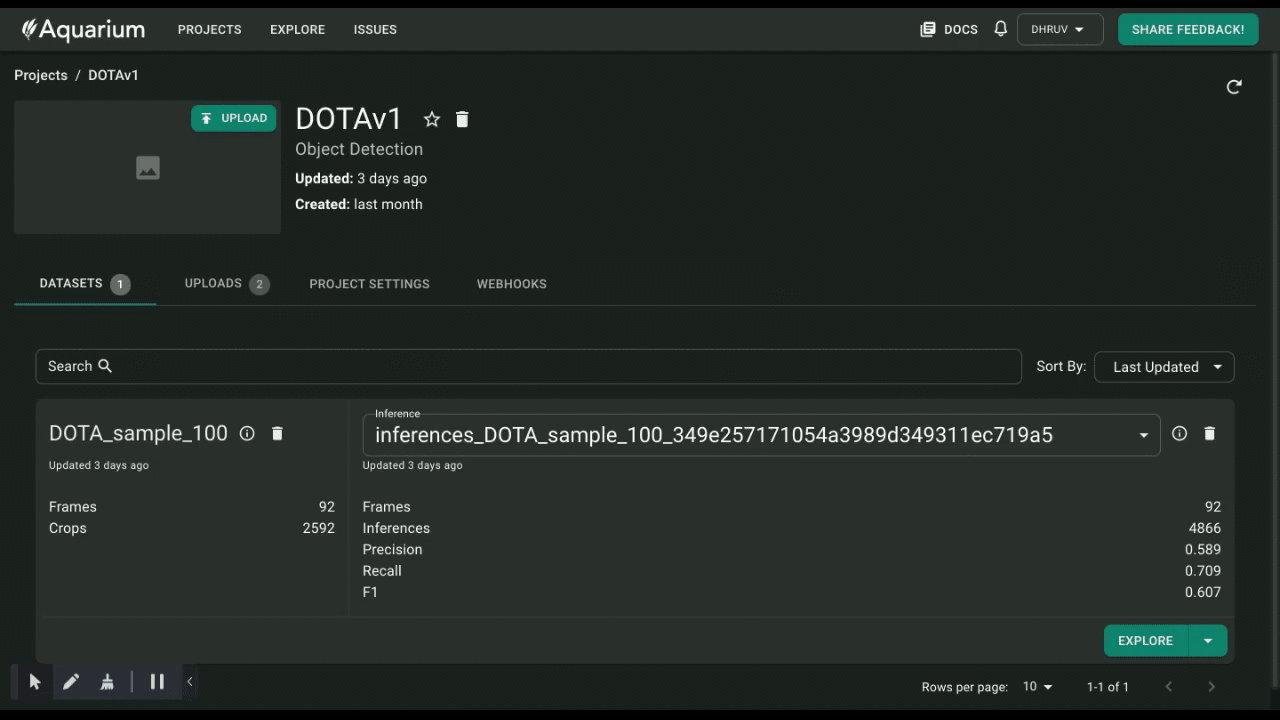
Evaluating Model Inferences in Aquarium
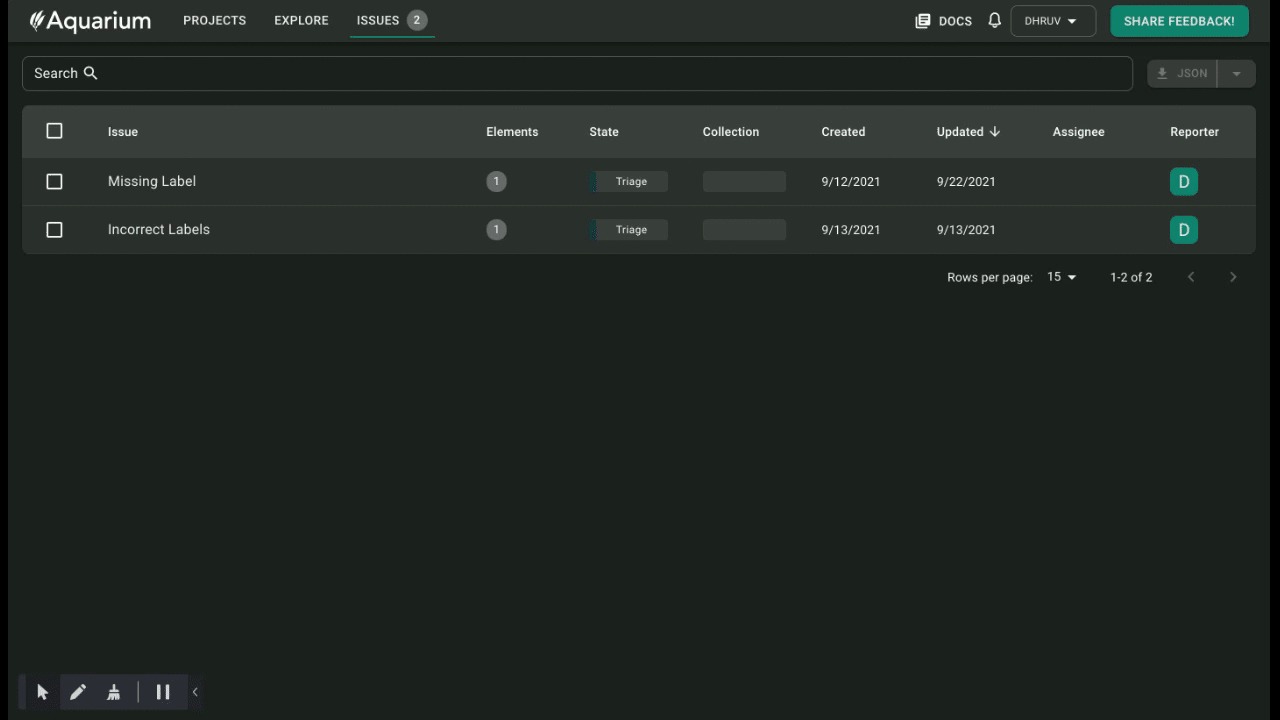
We can use the Confusion Matrix to drill down into the most problematic examples. Just select a cell in the Confusion Matrix and Aquarium will pull up a list of data points where the inference disagrees with the data. These data points are sorted based on their loss values. This allows us to quickly identify data points that might have labelling issues.
Below we see examples that have the Ground Truth label set to “background”, but in fact have valid objects present inside the image. We can select these examples and add them to an Issue for missing labels.

Updating an Artifact with Aquarium Webhooks
Now that we’ve identified these problematic data points, let’s remove them from our dataset.
Aquarium provides options for defining and running Webhooks based on specific events. In this example, we’re going to modify the “Export to Label” Webhook to update the Artifact directly. Of course, we can also run the issue through a labelling service to fix the bad label before updating it, but we’ll leave that for another time.
Exporting the Issue to a Webhook
This is the Webhook we’re running in the backend. It extracts the problematic frame id, P0603__1.0__0___600.png, and updates the Artifact to not include this image anymore.

Updating an Artifact via Webhook
As you can see above, the problematic image has been removed from the sample Artifact.
Takeaways
In this post, we created a system to evaluate an object detection model that can track the model and dataset sample used to creates the predictions, explore the predictions and data in an interactive way, evaluate the model metrics at various thresholds, identify issues in the data, and finally, update the sample dataset to remove these issues.
This workflow allows you or your team to conduct model evaluations significantly faster, without having to write custom code or random one-off scripts. This makes it much easier to adopt, since this evaluation process can be standardized.