Observability for Google Agent Development Kit (Python) with Opik
Observability for Google Agent Development Kit (Python) with Opik
In Opik 2.0, datasets and experiments are project-scoped. Make sure to specify a project_name when creating datasets and running experiments so they are associated with the correct project.
Agent Development Kit (ADK) is a flexible and modular framework for developing and deploying AI agents. ADK can be used with popular LLMs and open-source generative AI tools and is designed with a focus on tight integration with the Google ecosystem and Gemini models. ADK makes it easy to get started with simple agents powered by Gemini models and Google AI tools while providing the control and structure needed for more complex agent architectures and orchestration.
In this guide, we will showcase how to integrate Opik with Google ADK so that all the ADK calls are logged as traces in Opik. We’ll cover three key integration patterns:
- Automatic Agent Tracking - Recommended approach using
track_adk_agent_recursivefor effortless instrumentation - Manual Callback Configuration - Alternative approach with explicit callback setup for fine-grained control
- Hybrid Tracing - Combining Opik decorators with ADK callbacks for comprehensive observability
Account Setup
Comet provides a hosted version of the Opik platform, simply create an account and grab your API Key.
You can also run the Opik platform locally, see the installation guide for more information.
Opik provides comprehensive integration with ADK, automatically logging traces for all agent executions, tool calls, and LLM interactions with detailed cost tracking and error monitoring.
Key Features
- One-line instrumentation with
track_adk_agent_recursivefor automatic tracing of entire agent hierarchies - Automatic cost tracking for all supported LLM providers including LiteLLM models (OpenAI, Anthropic, Google AI, AWS Bedrock, and more)
- Full compatibility with the
@opik.trackdecorator for hybrid tracing approaches - Thread support for conversational applications using ADK sessions
- Automatic agent graph visualization with Mermaid diagrams for complex multi-agent workflows
- Comprehensive error tracking with detailed error information and stack traces
Getting Started
Installation
First, ensure you have both opik and google-adk installed:
Configuring Opik
Configure the Opik Python SDK for your deployment type. See the Python SDK Configuration guide for detailed instructions on:
- CLI configuration:
opik configure - Code configuration:
opik.configure() - Self-hosted vs Cloud vs Enterprise setup
- Configuration files and environment variables
Configuring Google ADK
In order to configure Google ADK, you will need to have your LLM provider API key. For this example, we’ll use OpenAI. You can find or create your OpenAI API Key in this page.
You can set it as an environment variable:
Or set it programmatically:
Example 1: Automatic Agent Tracking (Recommended)
The recommended way to track ADK agents is using track_adk_agent_recursive and OpikTracer, which automatically instruments your entire agent hierarchy with a single function call. This approach is ideal for both single agents and complex multi-agent setups:
Each agent execution will now be automatically logged to the Opik platform with detailed trace information:
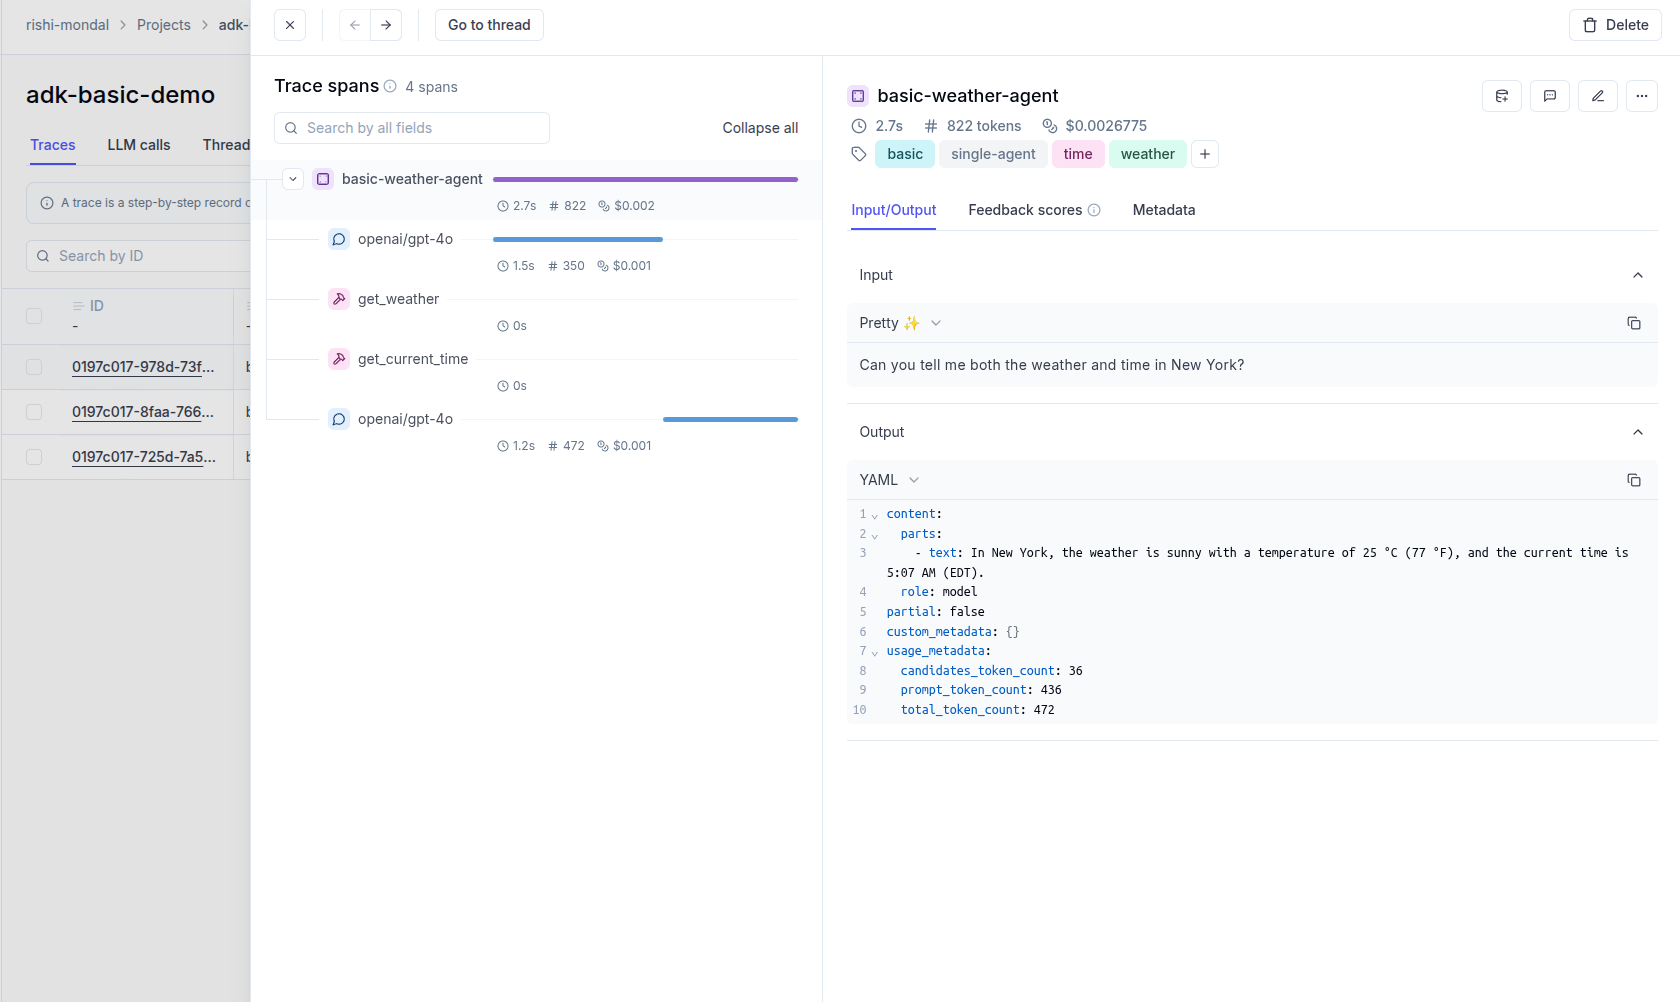
This approach automatically handles:
- All agent callbacks (before/after agent, model, and tool executions)
- Sub-agents and nested agent hierarchies
- Agent tools that contain other agents
- Complex workflows with minimal code
Example 2: Manual Callback Configuration (Alternative Approach)
For a fine-grained control over which callbacks to instrument, you can manually configure the OpikTracer callbacks. This approach gives you explicit control but requires more setup code:
For most use cases, we recommend using track_adk_agent_recursive (shown in Example 1) as it requires less code and automatically handles complex agent hierarchies.
Example 3: Multi-Agent Setup with Hierarchical Tracing
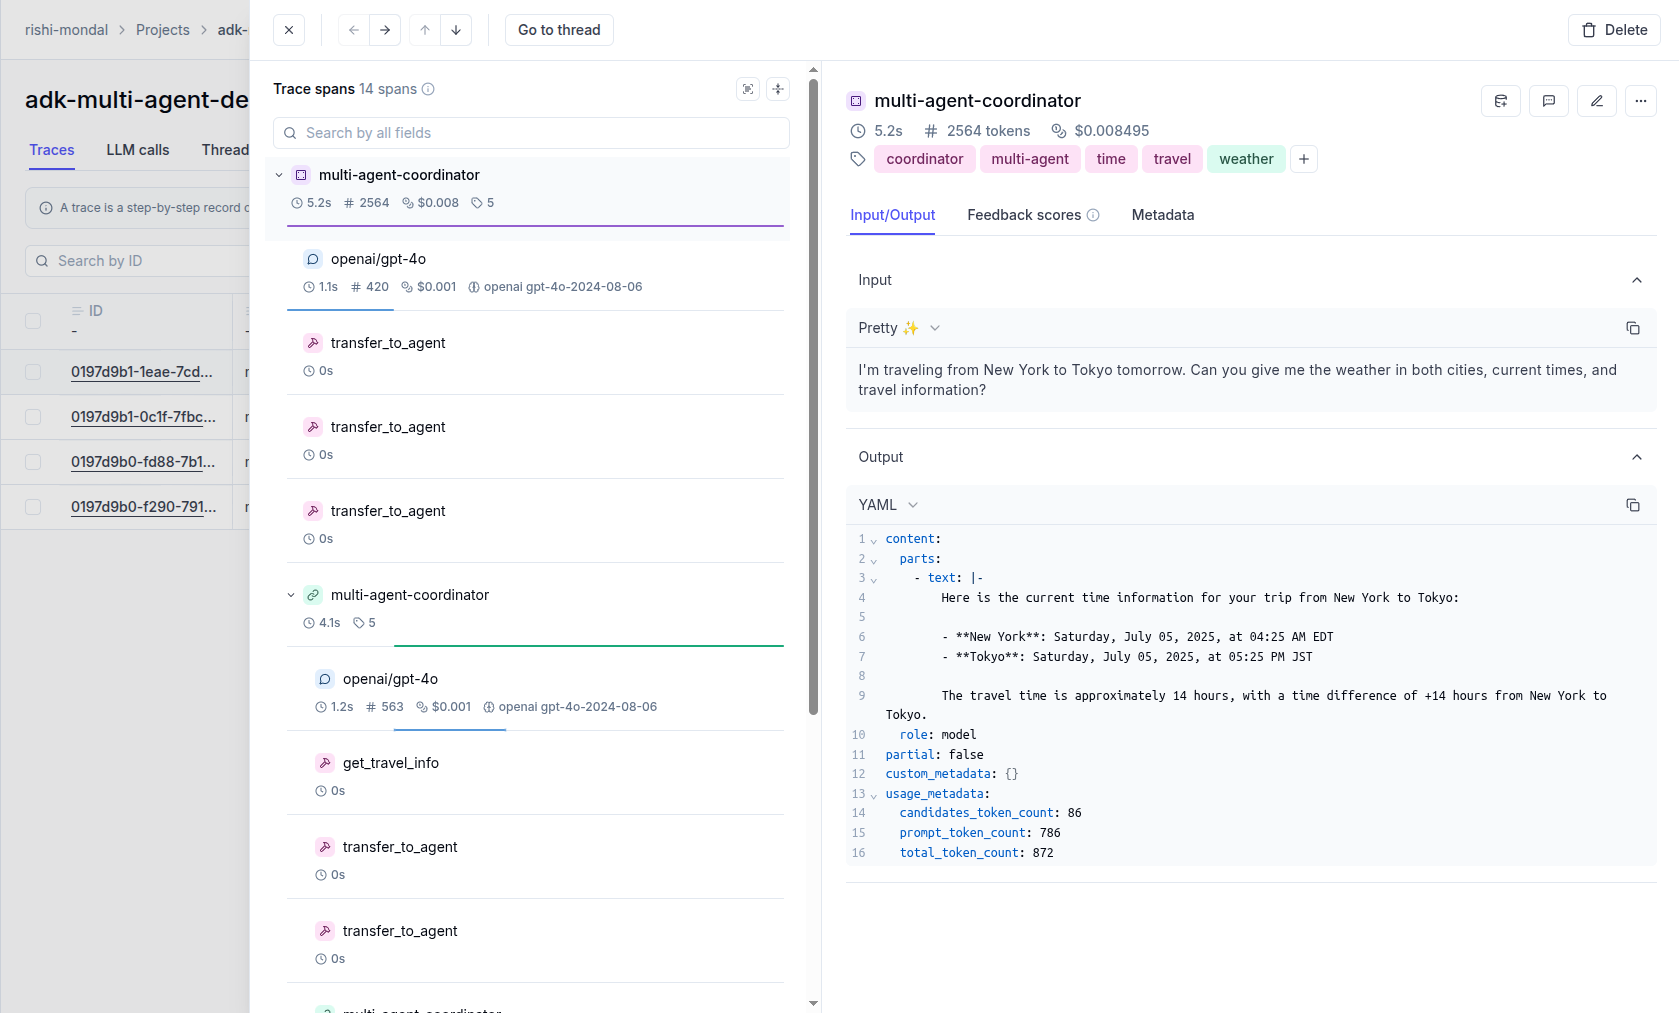
This example demonstrates a complex multi-agent setup where we have specialized agents for different tasks. Using track_adk_agent_recursive, you can instrument the entire hierarchy with a single function call:
The trace can now be viewed in the UI, showing the complete hierarchy:
The track_adk_agent_recursive approach is particularly powerful for:
- Multi-agent systems with coordinator and specialist agents
- Sequential agents with multiple processing steps
- Parallel agents executing tasks concurrently
- Loop agents with iterative workflows
- Agent tools that contain nested agents
- Complex hierarchies with deeply nested agent structures
By calling track_adk_agent_recursive once on the top-level agent, all child agents and their operations are automatically instrumented without any additional code
Cost Tracking
Opik automatically tracks token usage and cost for all LLM calls during the agent execution, not only for the Gemini LLMs, but including the models accessed via LiteLLM.
View the complete list of supported models and providers on the Supported Models page.
Agent Graph Visualization
Opik automatically generates visual representations of your agent workflows using Mermaid diagrams. The graph shows:
- Agent hierarchy and relationships
- Sequential execution flows
- Parallel processing branches
- Loop structures and iterations
- Tool connections and dependencies
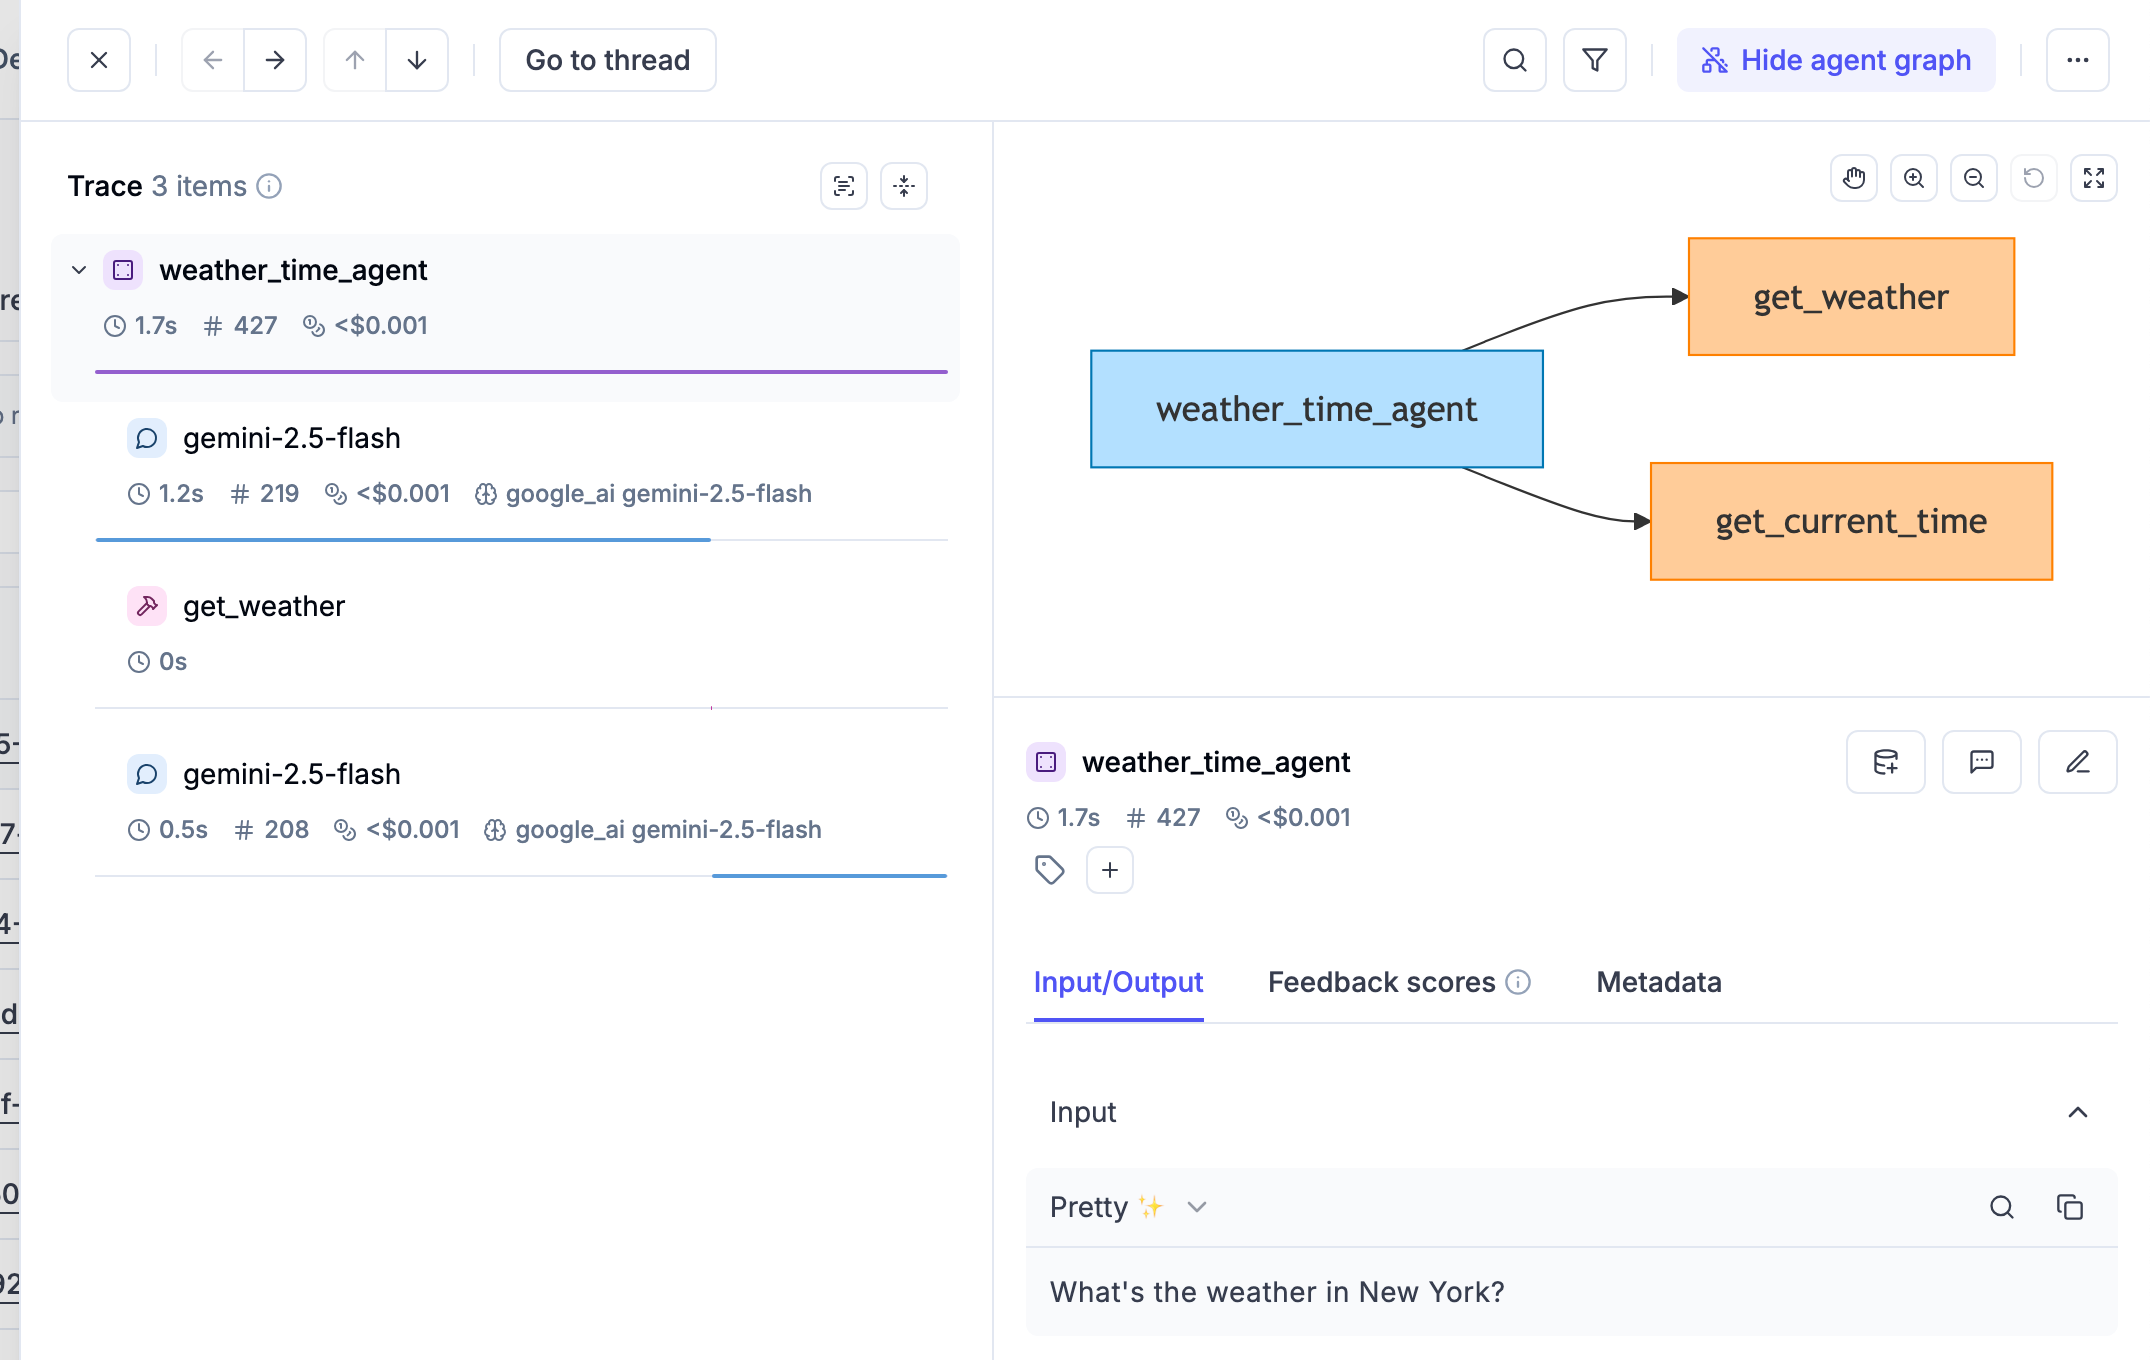
The graph is automatically computed and stored with each trace, providing a clear visual understanding of your agent’s execution flow:
For weather time agent the graph will look like that:
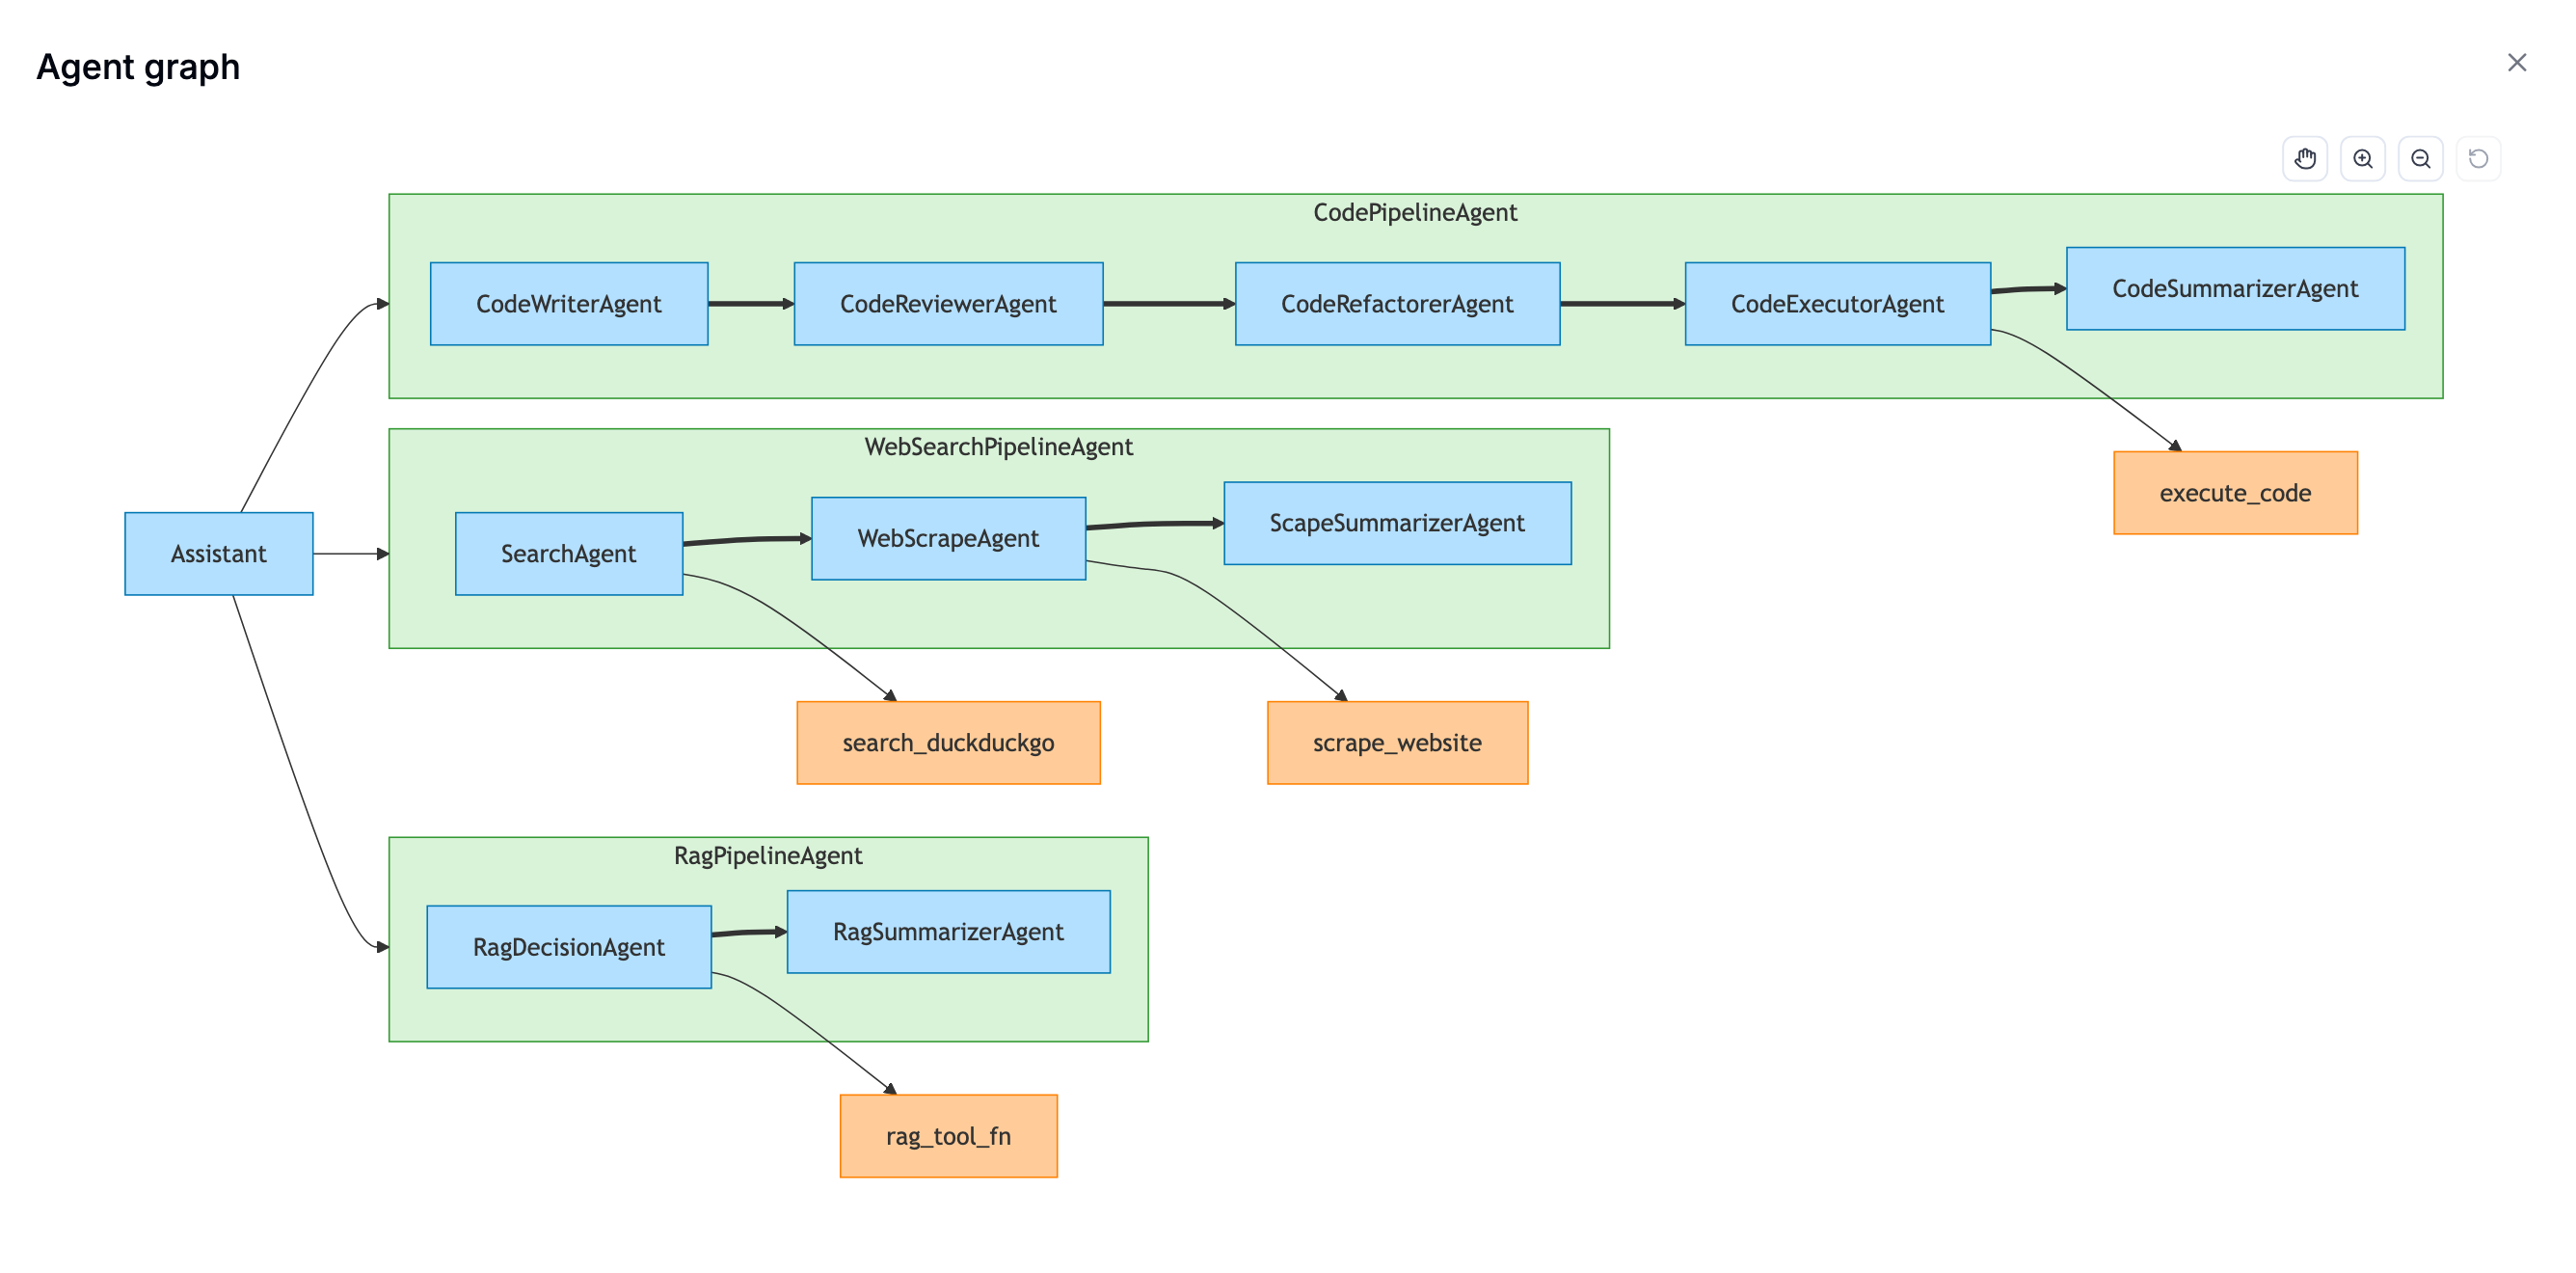
For more complex agent architectures displaying a graph may be even more beneficial:
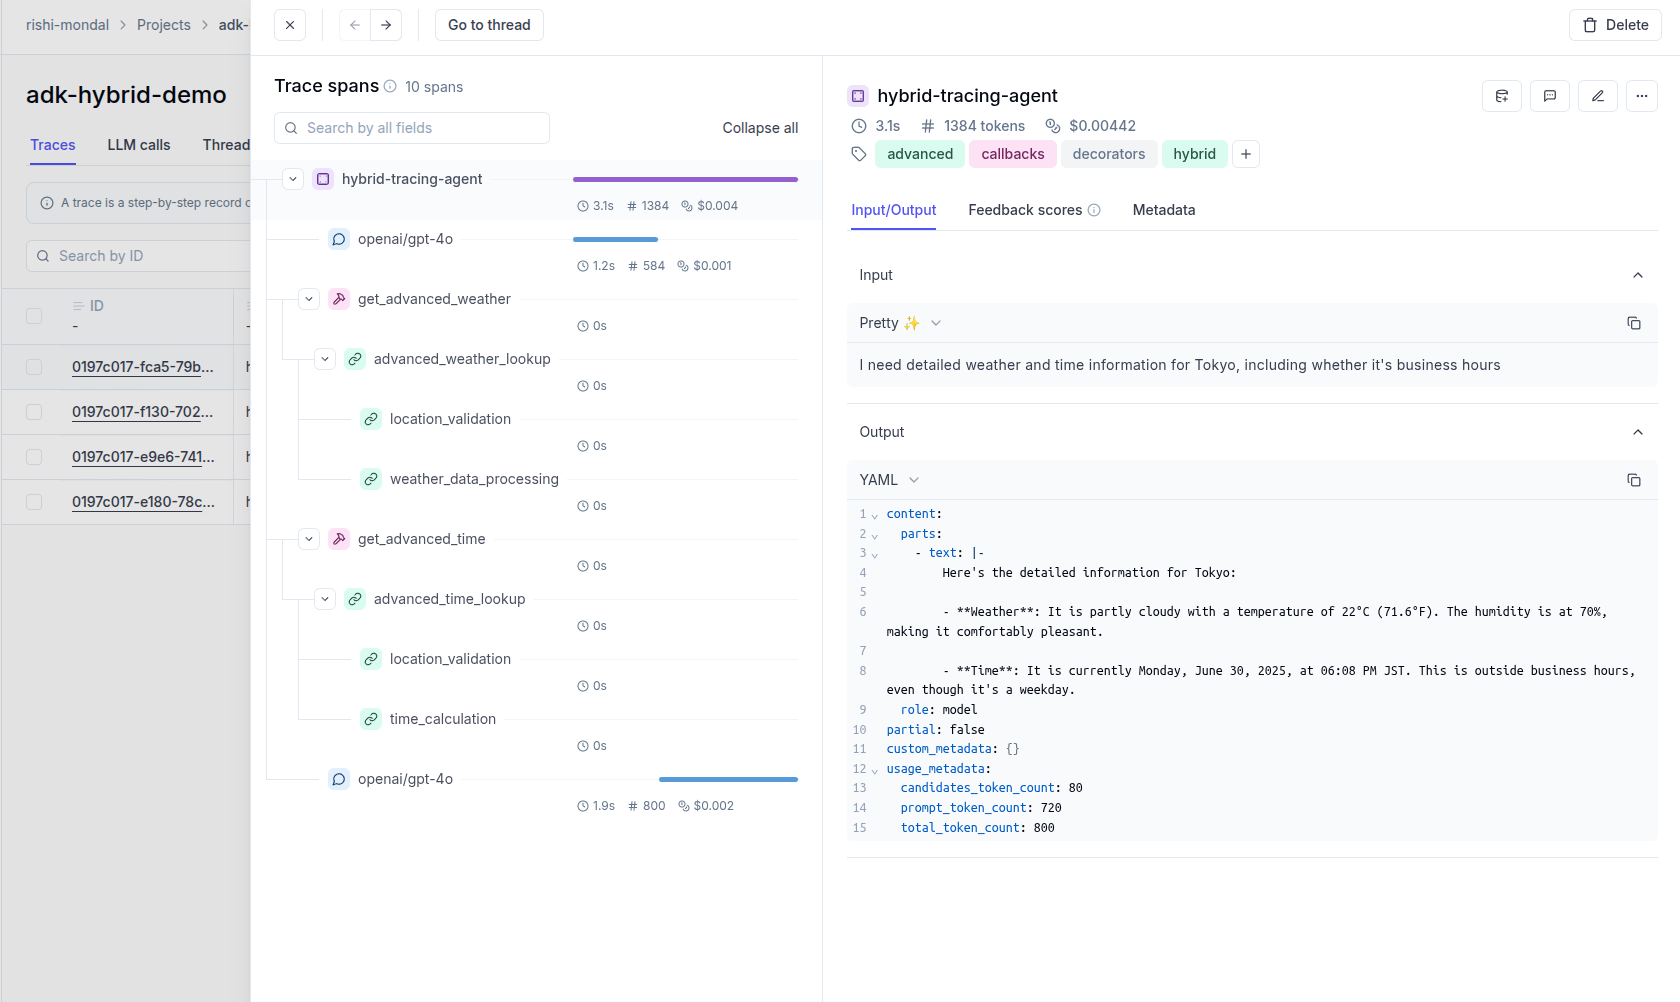
Example 4: Hybrid Tracing - Combining Opik Decorators with ADK Callbacks
This advanced example shows how to combine Opik’s @opik.track decorator with ADK’s callback system. This is powerful when you have complex multi-step tools that perform their own internal operations that you want to trace separately, while still maintaining the overall agent trace context.
You can use track_adk_agent_recursive together with @opik.track decorators on your tool functions for maximum visibility:
The trace can now be viewed in the UI:
Compatibility with @track Decorator
The OpikTracer is fully compatible with the @track decorator, allowing you to create hybrid tracing approaches that combine ADK agent tracking with custom function tracing.
You can both invoke your agent from inside another tracked function and call tracked functions inside your tool functions, all the spans and traces parent-child relationships will be preserved!
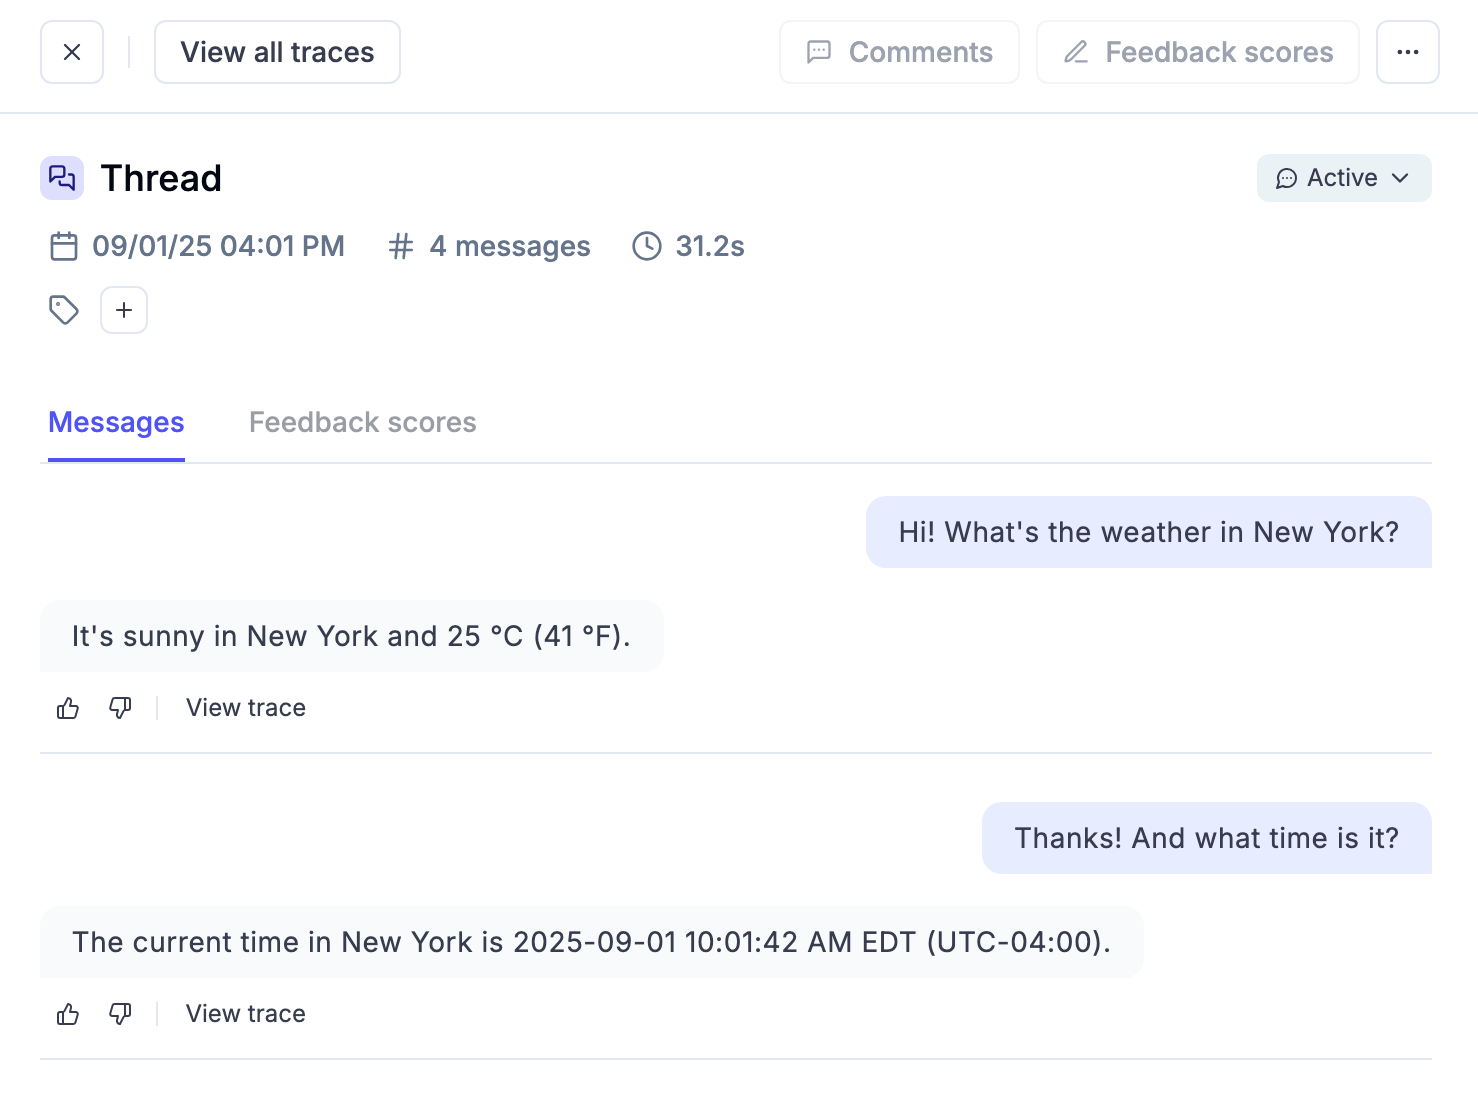
Thread Support
The Opik integration automatically handles ADK sessions and maps them to Opik threads for conversational applications:
The integration automatically:
- Uses the ADK session ID as the Opik thread ID
- Groups related conversations and interactions
- Logs app_name and user_id as metadata
- Maintains conversation context across multiple interactions
You can view your session as a whole conversation and easily navigate to any specific trace you need.
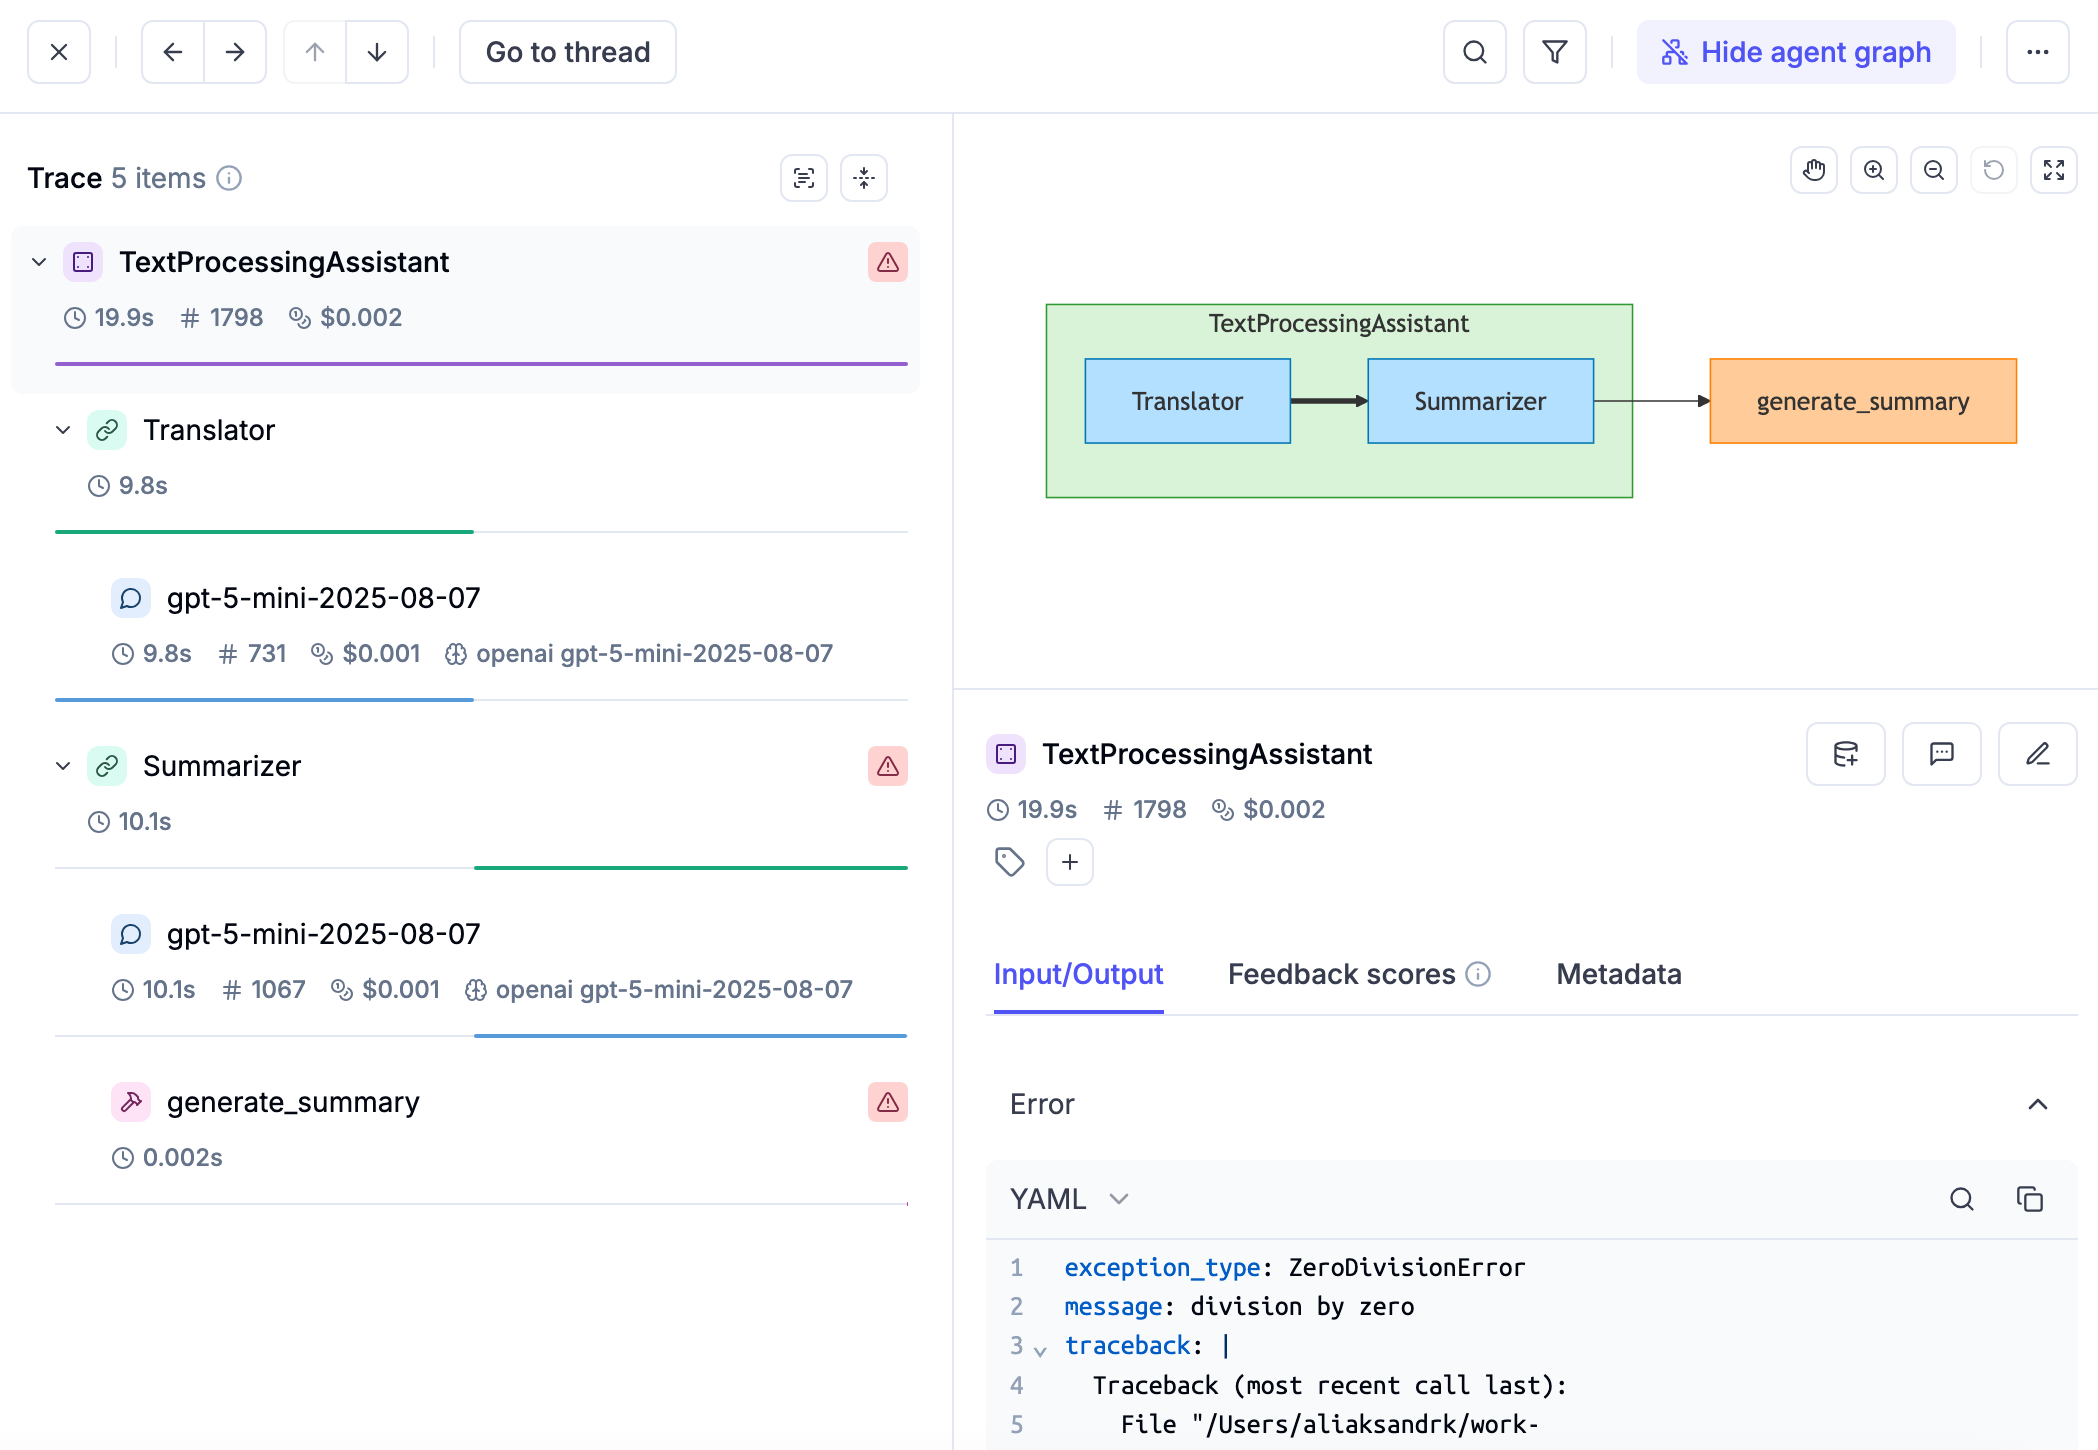
Error Tracking
The OpikTracer provides comprehensive error tracking and monitoring:
- Automatic error capture for agent execution failures
- Detailed stack traces with full context information
- Tool execution errors with input/output data
- Model call failures with provider-specific error details
Error information is automatically logged to spans and traces, making it easy to debug issues in production:
Troubleshooting: Missing Trace
When using Runner.run_async, make sure to process all events completely, even after finding the final response (when event.is_final_response() is True). If you exit the loop too early, OpikTracer won’t log the final response and your trace will be incomplete. Don’t use code that stops processing events prematurely:
There is an upstream discussion about how to best solve this source of confusion: https://github.com/google/adk-python/issues/1695.
Our team tried to address those issues and make the integration as robust as possible. If you are facing similar
problems, the first thing we recommend is to update both opik and google-adk to the latest versions. We are
actively working on improving this integration, so with the most recent versions you’ll most likely get the best UX!.
Flushing Traces
The OpikTracer object has a flush method that ensures all traces are logged to the Opik platform before you exit a script:
Prompts integration
The OpikTracer can be used together with the Opik prompt library
to easily access your existing prompts or create new ones, and then associate them with traces or spans within an ADK agent flow.