Powering Anomaly Detection for Industry 4.0
What is Industry 4.0?
You’ve probably heard the buzz: Industry 4.0 is revolutionizing the way companies manufacture, develop and distribute their products. But, what exactly is Industry 4.0?
To understand the Fourth Industrial Revolution, it helps to remember the first three.
The First Industrial Revolution began at the end of the 18th century and focused on mechanizing industrial processes. The Second Industrial Revolution introduced electrification, and the Third Industrial Revolution championed automatization. Each of these periods focused on reducing human intervention in industry, but what’s left once factories are mechanized, electrified, and automated? The Fourth Industrial Revolution is all about harnessing the power of data and leveraging it to simulate cognition in industry.
More than anything, Industry 4.0 is a paradigm shift in the way we organize and manage industrial processes to make the most of cyber-physical systems. These smart manufacturing processes include artificial intelligence, machine learning, cloud- and edge-computing, Industrial IoT, distributed computing, augmented reality, and much, much more.
What is Anomaly Detection?
One of the most popular ways that artificial intelligence is being incorporated into industrial manufacturing is through automated defect detection or anomaly detection. Anomaly detection is the process of identifying anomalous items in a stream of input data and is a critical component of quality assurance in any production line.
Traditional manual defect detection methods are not only expensive and time-consuming but can also often be ineffective, as not all anomalies are visible to the human eye. However, with the advent of machine learning, computer vision can be leveraged to facilitate human operator work– or even completely automate this process!
Challenges of Anomaly Detection
Anomaly detection faces several unique challenges. It’s often difficult to obtain a large amount of anomalous data, making traditional supervised learning techniques impractical. These class imbalances also mean that popular evaluation metrics like accuracy aren’t relevant.
Furthermore, the difference between a normal sample and an anomalous one can be microscopic. It isn’t always feasible to predefine all types of anomalies at the outset of an experiment. Fortunately, to address each of these challenges and more, a team of artificial intelligence researchers at Intel have developed a cutting-edge, easy-to-implement, open-source package called Anomalib.
What is Anomalib?
Anomalib is an open-source deep learning library developed by Intel that makes it easy to benchmark different anomaly detection algorithms on both public and custom datasets, all by simply modifying a config file. As the largest public collection of anomaly detection algorithms and datasets, it has a strong focus on image-based anomaly detection. It’s a comprehensive, end-to-end solution that includes cutting-edge algorithms, relevant evaluation methods, prediction visualizations, hyperparameter optimization, and inference deployment code with Intel’s OpenVINO Toolkit.
Anomalib uses unsupervised ML techniques to learn an implicit representation of normality with AutoEncoders, GANs, or a combination of both. During inference, new samples are compared against the embeddings of normal samples to determine whether or not they are anomalous. In this way, Anomalib allows you to save your sparse anomalous data for testing purposes only. It currently supports ten cutting-edge anomaly detection models, including FastFlow, PaDiM, PatchCore, and CFlow models, but is also continuously updated with the latest state-of-the-art algorithms. You can also train models with custom data or access public datasets like the MVTec or BeanTech datasets through the API. What’s best, Anomalib makes end-to-end anomaly detection possible straight out-of-the-box, and without additional GPUs or super long training times.
Why Anomalib?
Anomalib can do more than just support POC projects, however. In the real world, machine learning is a highly iterative process, and the details of all these iterations can get pretty confusing, pretty fast. To optimize your model and get it production-ready, you’ll need to log, manage, and version these details in an experiment tracking tool like Comet.
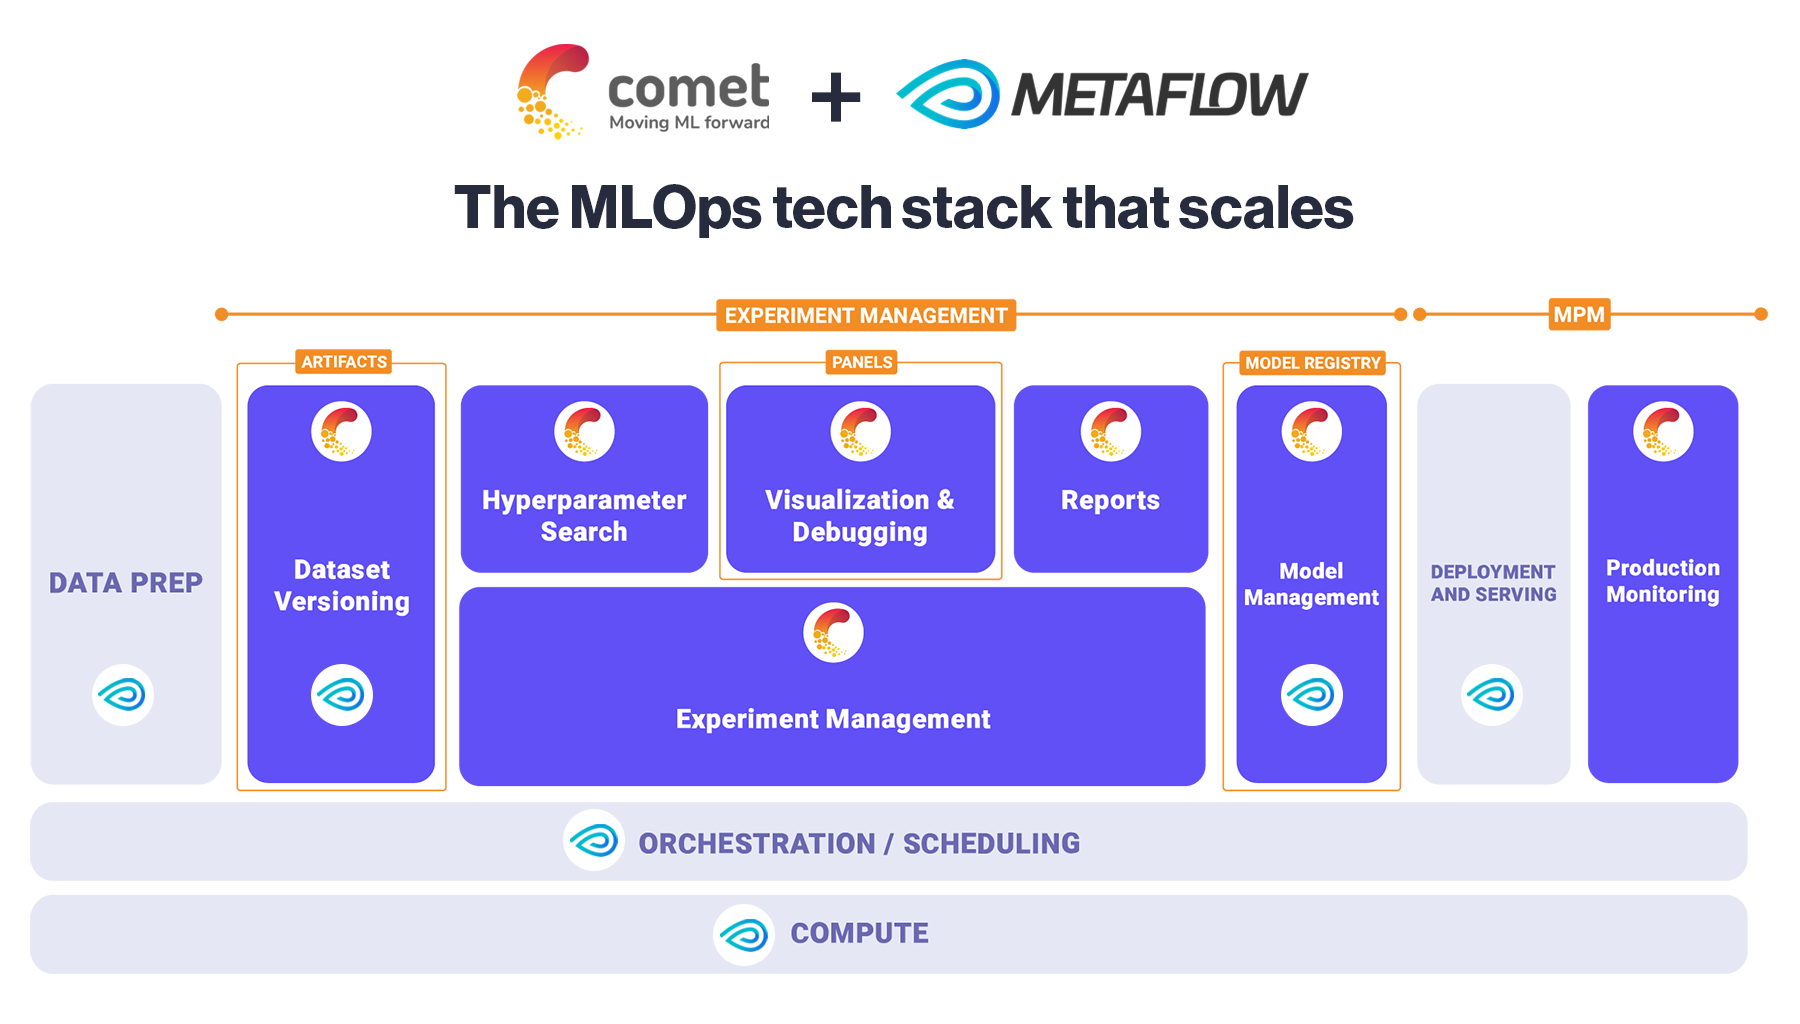
By pairing Anomalib with Comet, you can take advantage of all of the cutting-edge models of Anomalib, keep track of your model iterations with Comet, and then implement them in a production environment with Comet’s model management tools. In these ways, Anomalib and Comet make the perfect pair to power production-grade anomaly detection for Industry 4.0!
Anomalib + Comet for Anomaly Detection
Comet is a powerful tool that allows you to manage and version your training data, track and compare training runs, and monitor your models in production — all in one platform. And now Comet is fully integrated with Anomalib for experiment management, benchmarking, and hyperparameter optimization!
The Comet + Anomalib integration offers the following features:
- Autologging and custom logging of experiment- and project-level metrics and features, including system metrics, hyperparameters, graph definition, evaluation metrics, and more.
- Organize your project-level dashboard with Comet’s custom panels for an overview that tailors to your team’s specific needs.
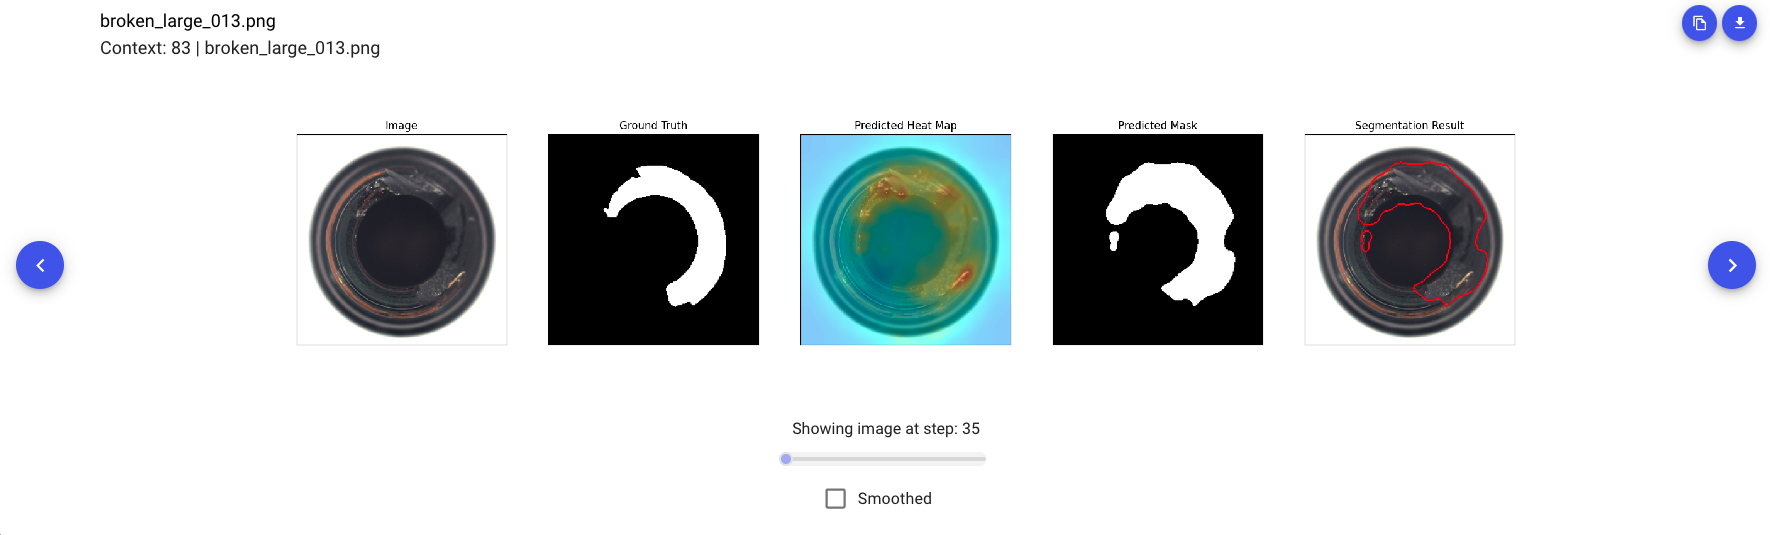
- [New!] Image Panels allow you to compare your images across different experiments and throughout different steps. Search for individual images and showcase selected images across individual experiment runs.
- Log benchmarked results to Comet as a means to track model drift.
- Isolate the best hyperparameters with HPO powered by the Comet Optimizer.
Logging
Experiment-level
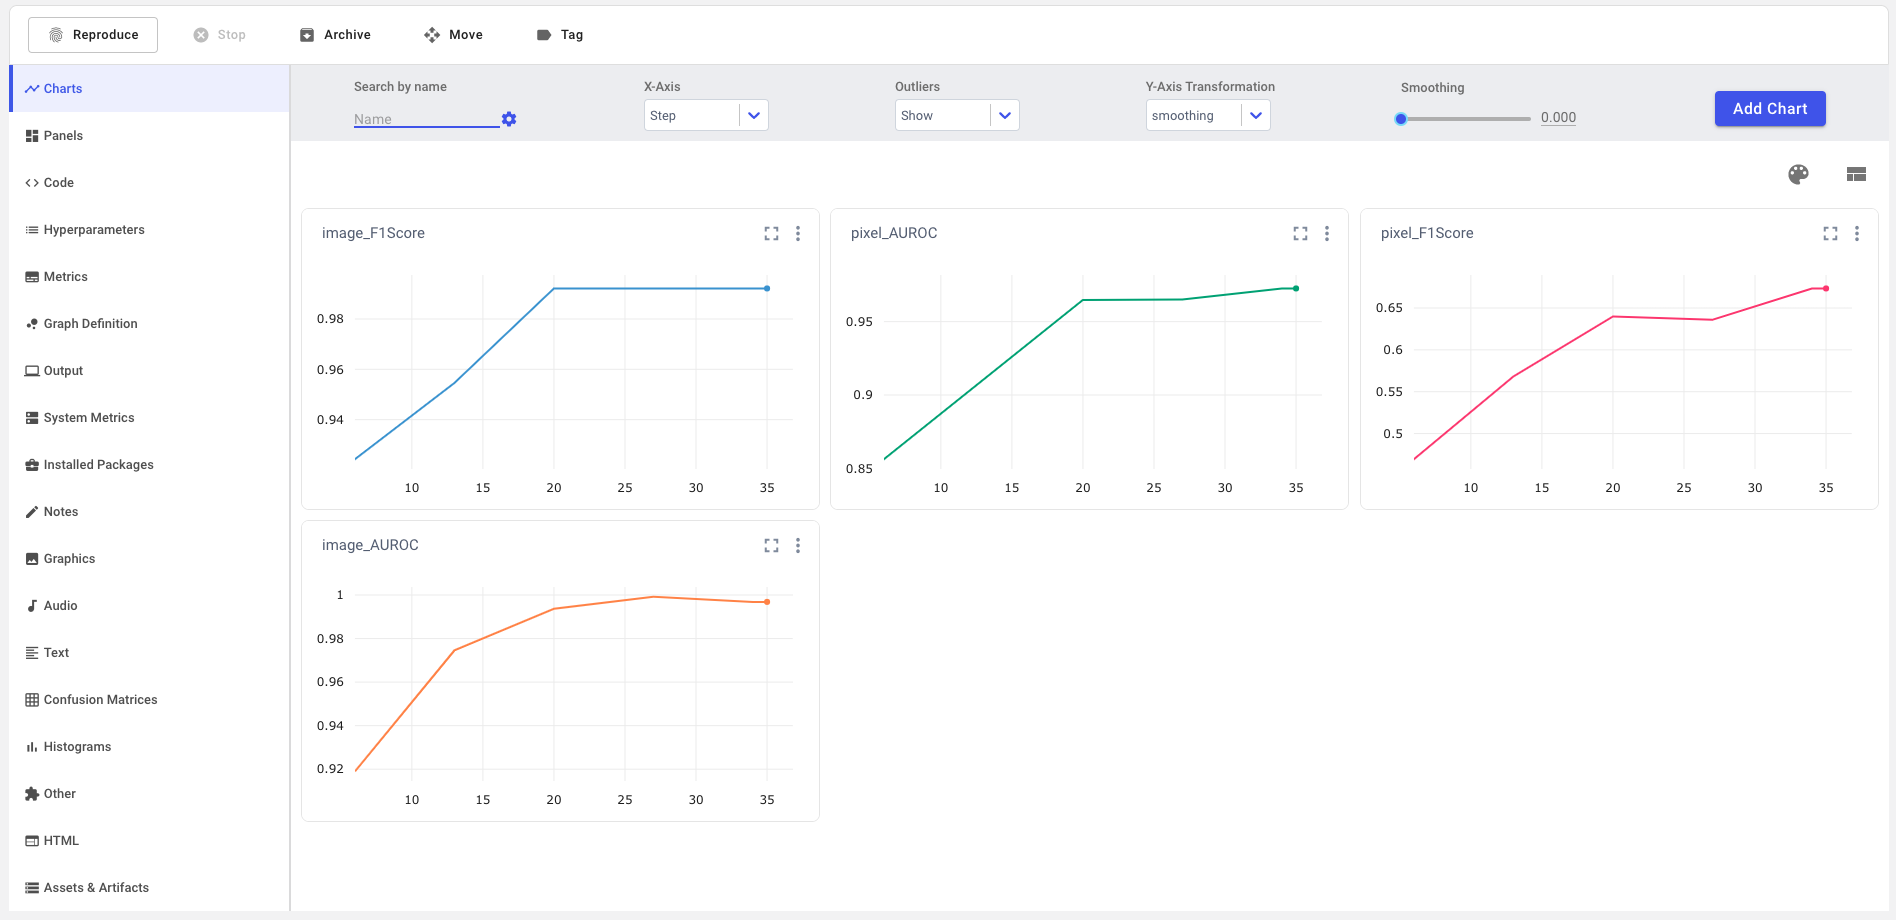
In single-experiment view, Comet logs appropriate evaluation metrics in both tabular and chart form. By definition, anomaly detection is a problem of class imbalances, and this makes for poor performance with traditional ML metrics like accuracy, which are designed around an assumption of balanced class distribution.
Instead, Anomalib + Comet calculates the F1 score and AUROC at both image and pixel levels. The F1 score combines precision and recall into a single metric by taking their harmonic mean, while still accounting for the precision-recall tradeoff. The AUROC curve describes how well a model can distinguish between classes by plotting a probability curve at various thresholds, or degrees of separability, and is another very important metric for evaluating classification problems with class imbalances.
But that’s not all! Scrolling through the left-hand sidebar of the single-experiment view, you’ll find that quite a few metrics and features are automatically logged for you! Basic contextual information like source code, system metrics, installed packages, and output are all logged. Experiment-specific hyperparameters, metrics, and graph definitions are also auto-logged, and with a simple edit to the Anomalib config file, you can also log images and other graphics to Comet. Keeping track of all these metrics is essential for producing production-ready models and monitoring them for concept and data drift.
Project-level
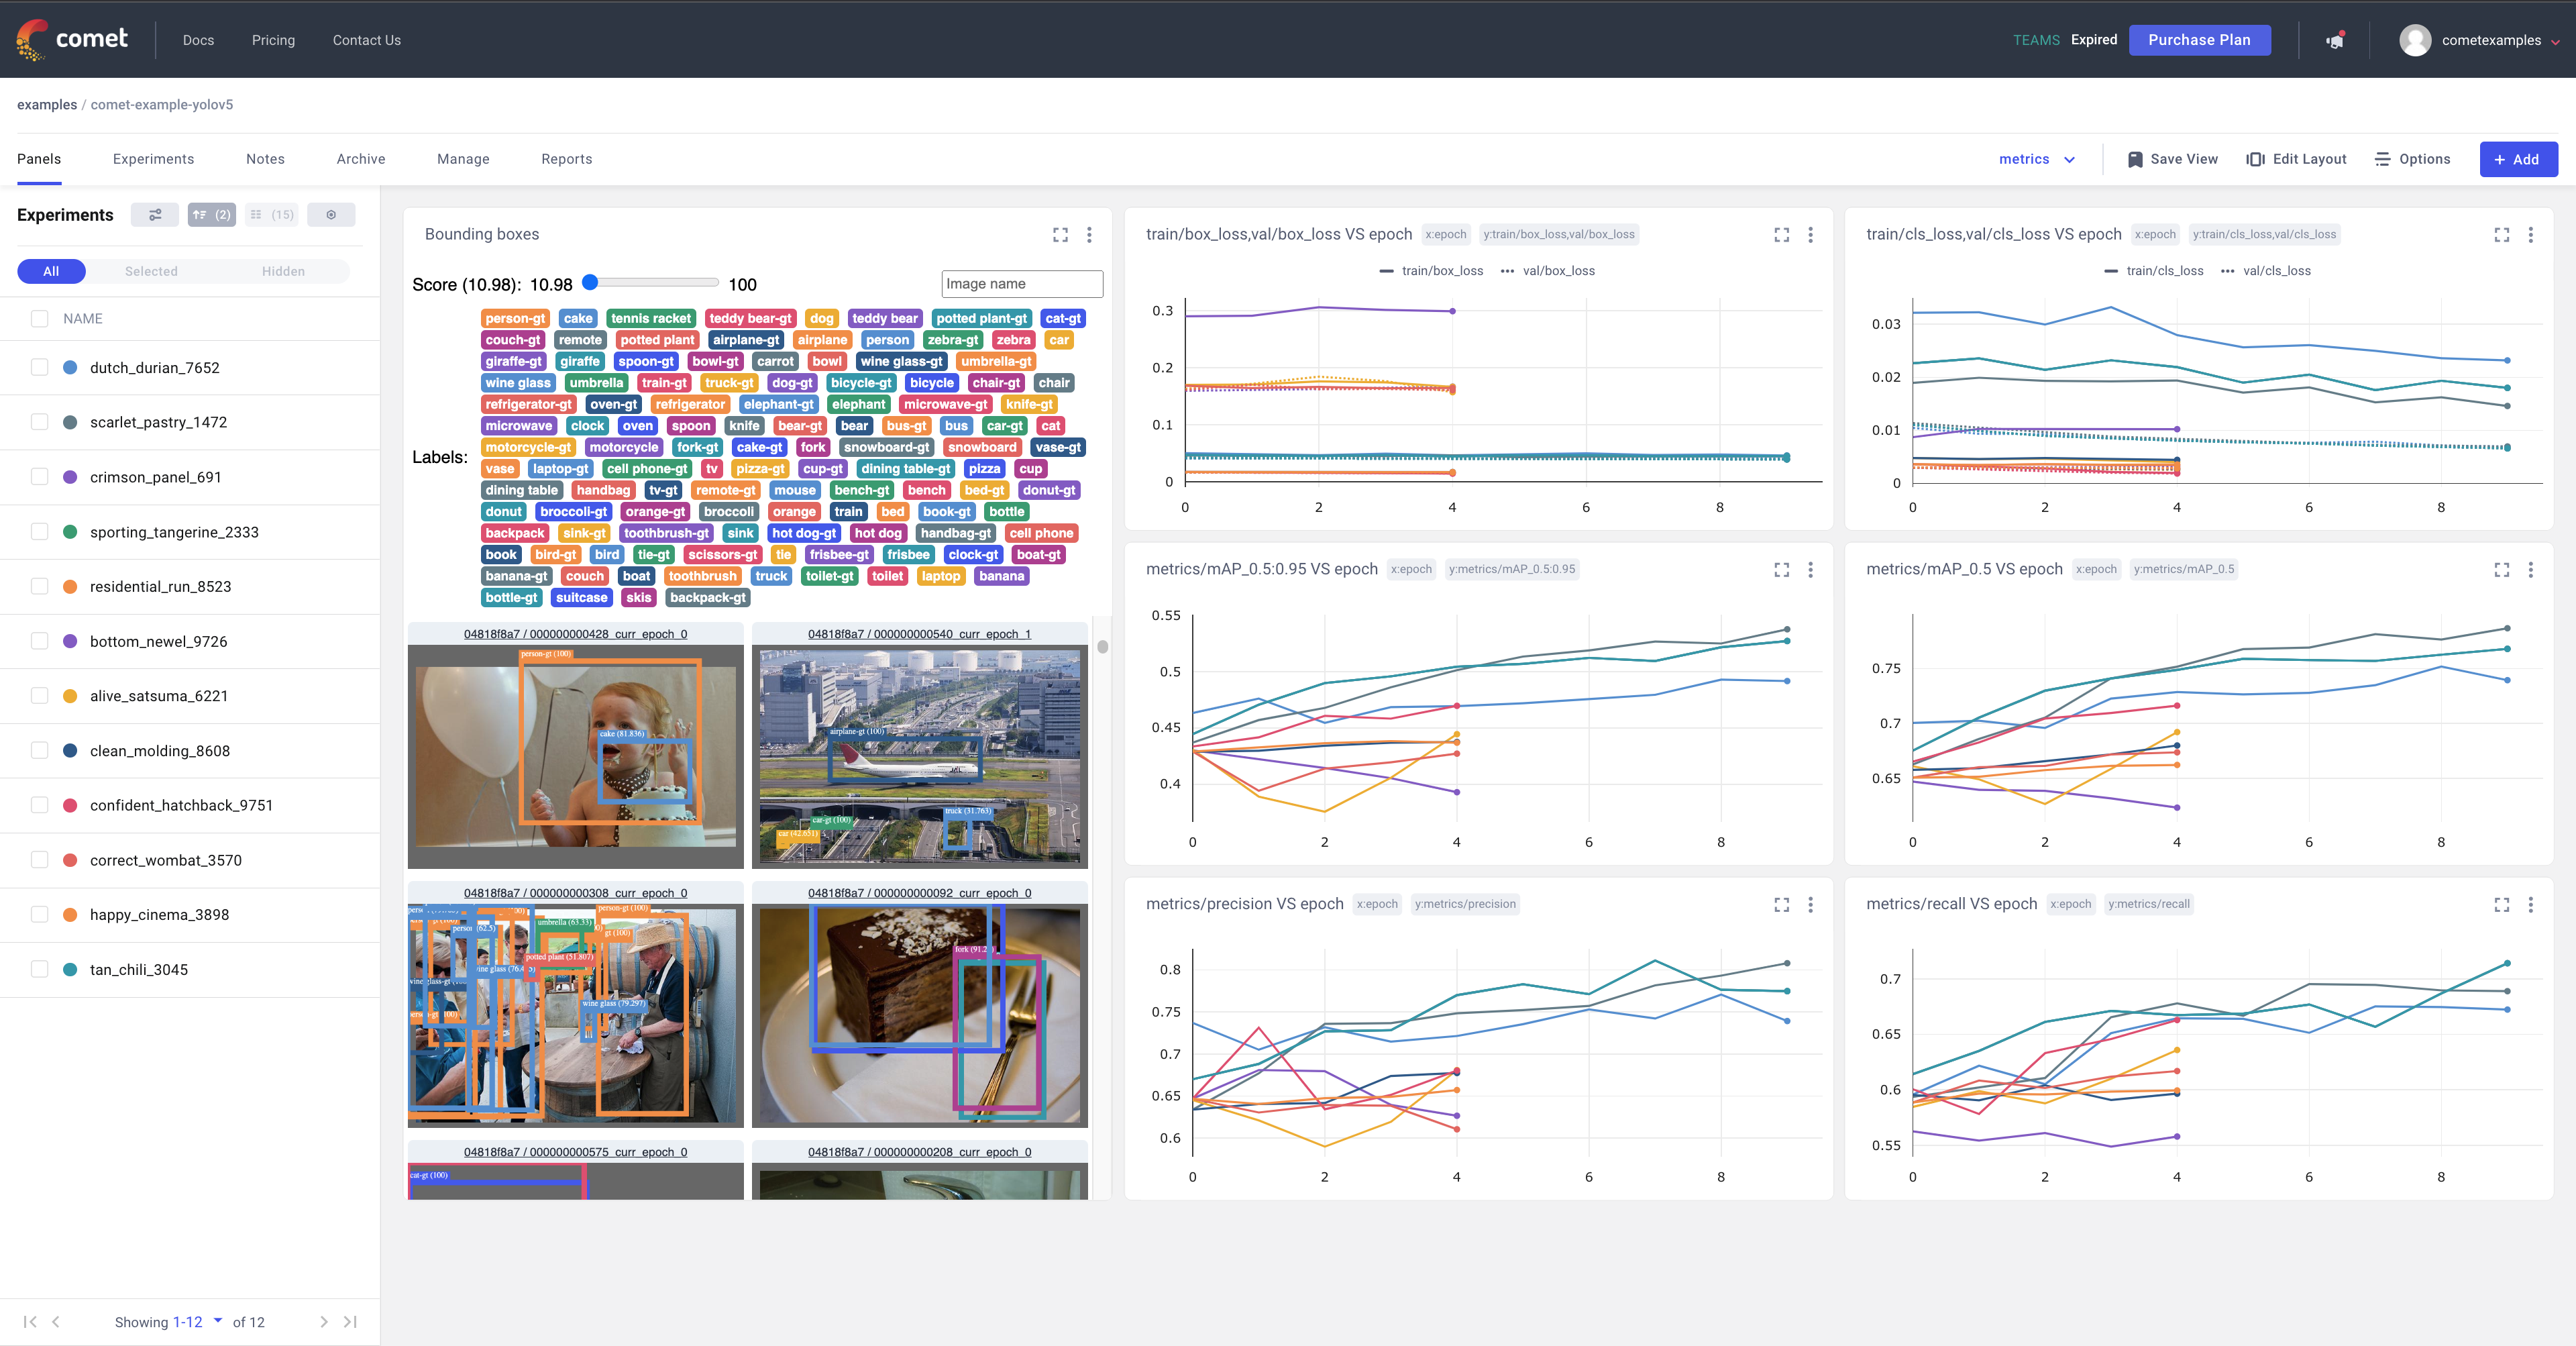
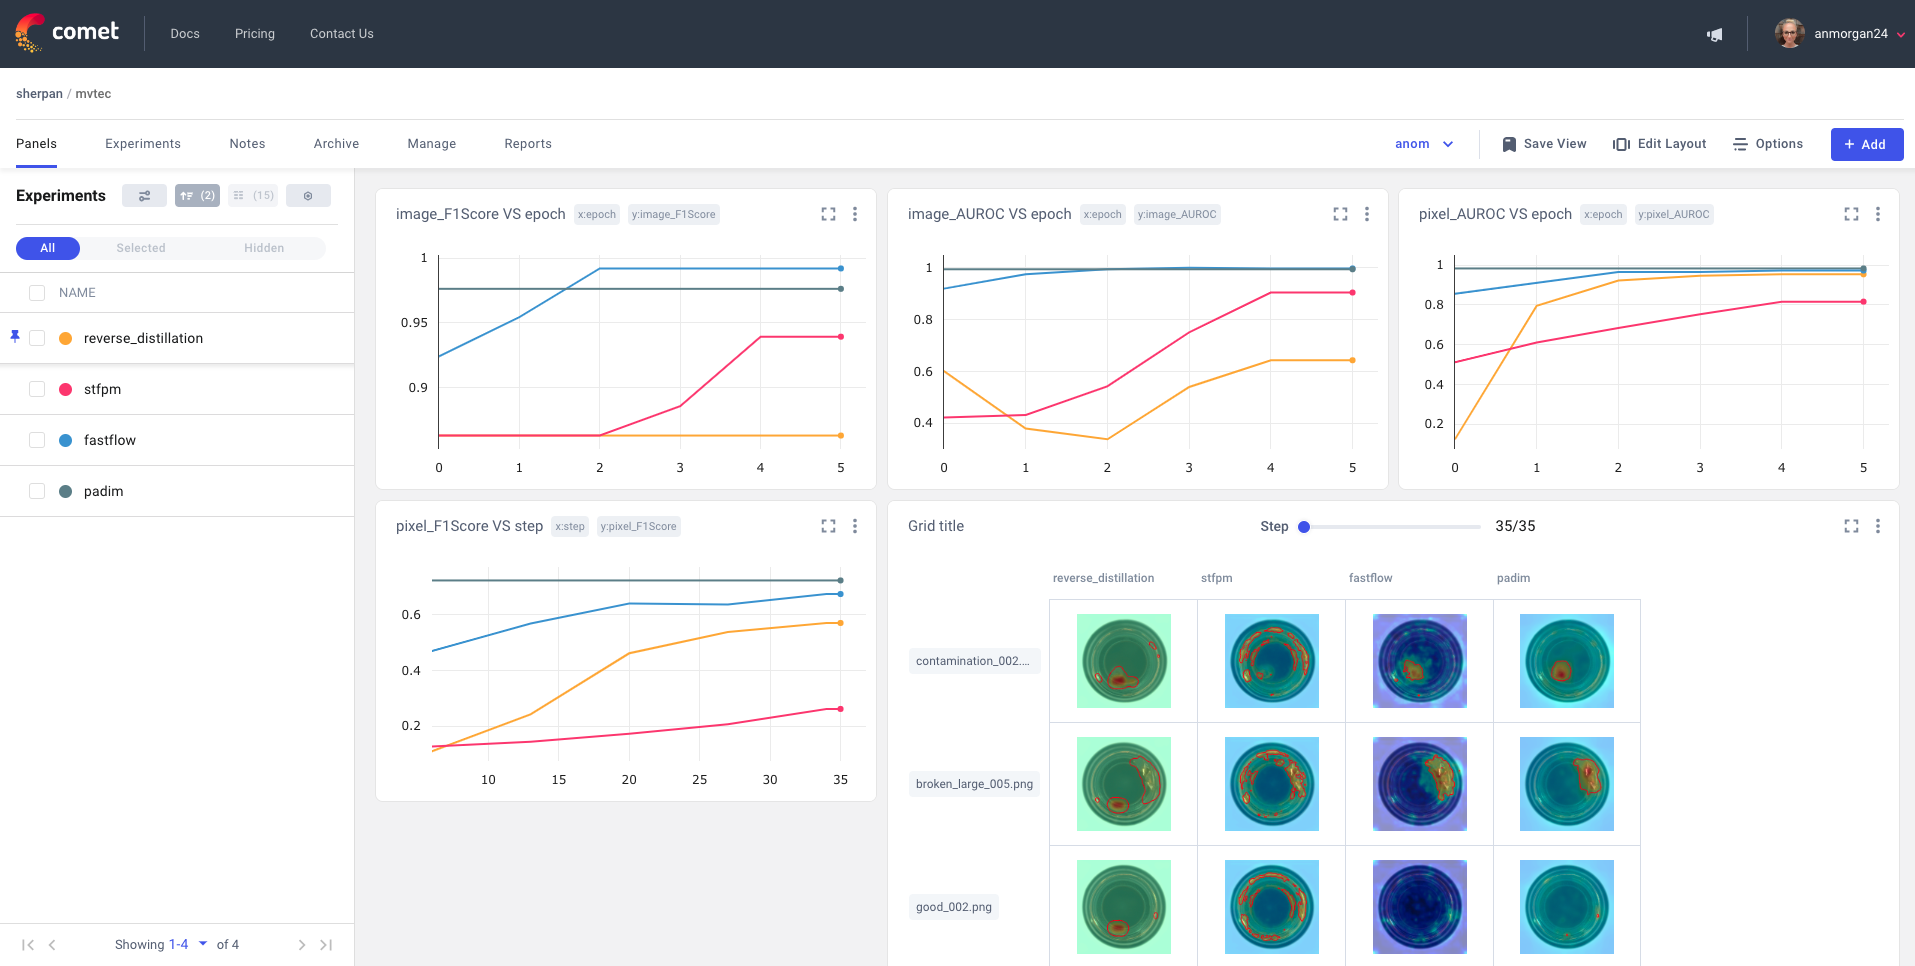
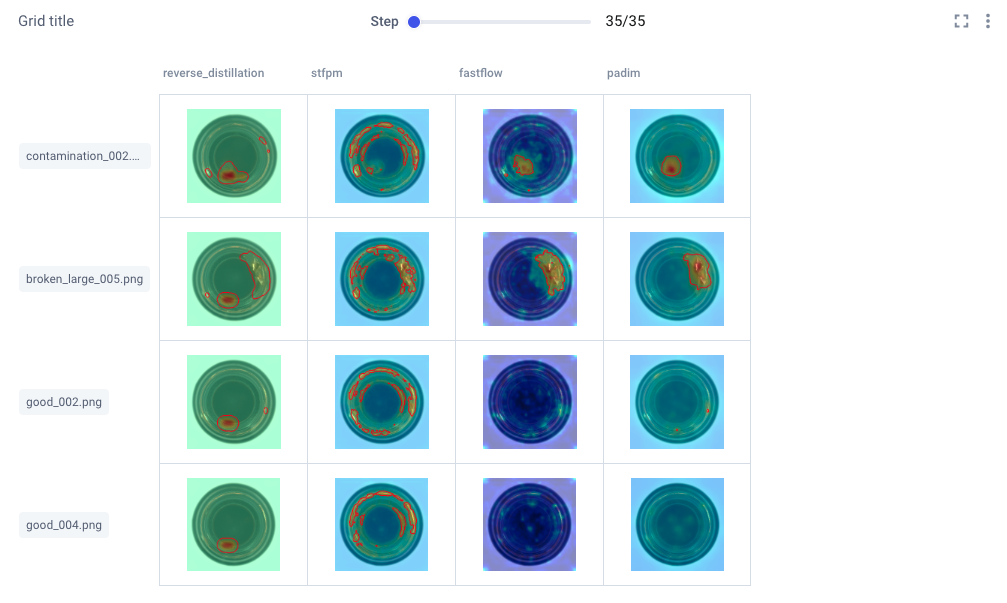
In the panel-level view, you’ll see charts automatically populated with performance metrics for a bird’s eye view of your project across experiment runs. You can also add Comet’s new Image Panels to this view to visualize specific prediction images across different experiments, as shown below:
Lastly, it can be really important to see how things are shaping up between two specific experiment runs. Comet allows you to diff selected runs for a more cross-sectional view of your project. This also allows you to compare specific metrics and parameters:
Benchmarking
Anomalib also includes a benchmarking script for relating results across different combinations of models, their parameters, and dataset categories. Log the model performance and throughputs to Comet as a means to track model drift, or export them to a CSV file. You can check out the full documentation here, and once your configuration is decided, perform your benchmarking with one simple command:
python tools/benchmarking/benchmark.py \
--config <relative-or-absolute-path>/<paramfile>.yaml
Hyperparameter Optimization
Anomalib also supports hyperparameter optimization with the Comet Optimizer, making it easier to isolate the right combination of hyperparameters. See here for Anomalib’s HPO docs, or see here for details on other possible configurations with Comet’s Optimizer.
At the top of your Comet optimizer report, you’ll find each of your hyperparameters ranked by the evaluation method of your choice, in order of the largest magnitude of Spearman correlation coefficient, to the smallest. In the snapshot below, the learning rate had the largest correlation coefficient with the model’s F1 score.
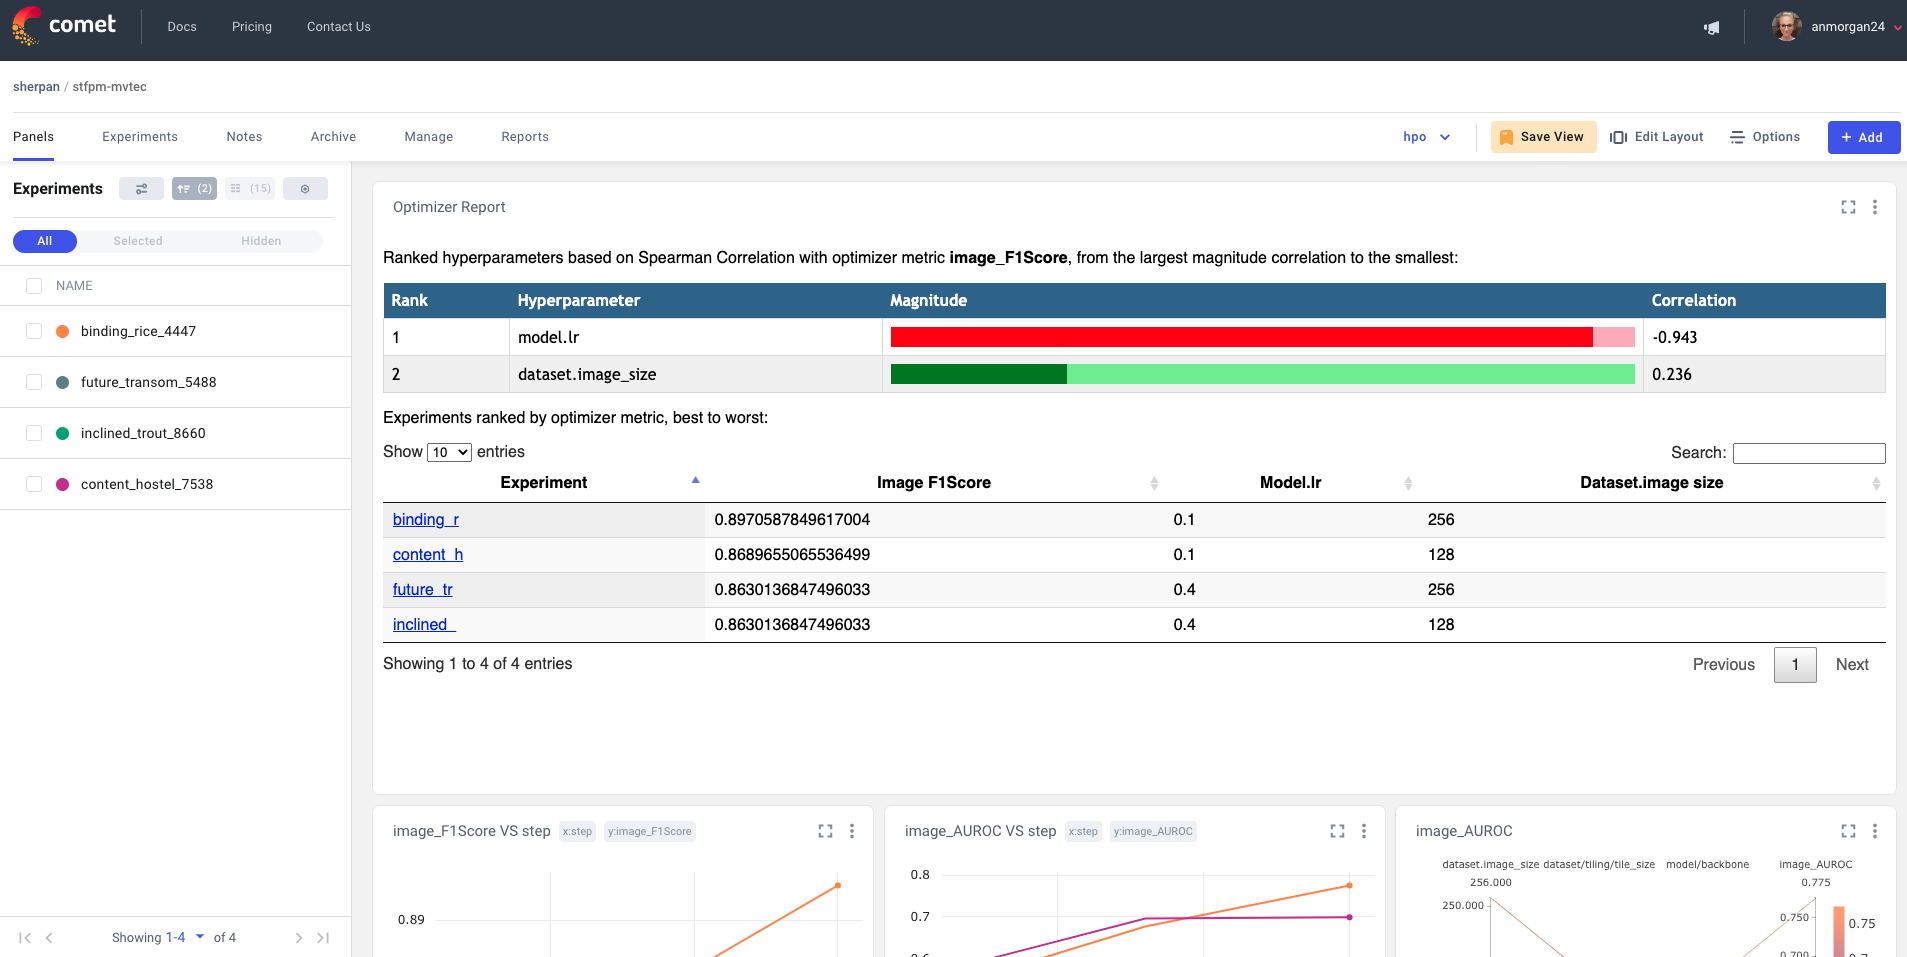
You’ll also find all of your experiment runs ranked by your evaluation metric, with the additional option to toggle the ranking based on any of the model’s parameters. Lastly, Comet plots your evaluation metrics across all experiment runs in line plots, and feel free to add any of Comet’s publicly available custom panels!
Getting Started
To start tracking your Anomalib projects with Comet, just follow the four quick steps below. Feel free to follow along with this Colab tutorial, and be sure to check out this completed Anomalib project here, courtesy of Comet’s own ML Growth Engineer, Sid Mehta.
0. Setup and Installation
Clone the Anomalib repo into your environment and install the necessary dependencies:
git clone https://github.com/openvinotoolkit/anomalib.git
cd anomalib
pip install . --q
1. Configure Comet Credentials
If you don’t already have a Comet account, you can sign up for free here. Make sure to grab your API key from your account settings so you can configure your Comet credentials in any of several ways. For the sake of simplicity, we’ll set them directly through environment variables here:
export COMET_API_KEY = <Your-Comet-API-Key>
export COMET_PROJECT_NAME = <Your-Comet-Project-Name> # this will default to the name of your dataset
2. Modify the Anomalib config File
Next, we’ll need to modify our Anomalib config file to enable logging. The easiest way to do this is to open the existing configuration file at anomalib/anomalib/models/<model-of-your-choice>/config.yaml and adjust the following parameters:
visualization:
    show_images: true
    save_images: true
    log_images: true
    mode: full # options: ["full", "simple"]
logging:
    logger: comet
    log_graph: true
Alternatively, you can copy your particular model’s default config template into a new YAML file and adjust the parameters as needed. In this Colab notebook, we’ve also demonstrated how to use pyyaml to write a config file in an interactive environment. Note that each model supported by Anomalib has a different config file structure.
3. Training
By default, !python tools/train.py runs the PaDiM model on the bottle category from the MVTec AD (CC BY-NC SA 4.0) dataset.
To use a different algorithm, just switch out the model name in the config file path to another supported algorithm. To use a custom dataset, just update the relevant Anomalib config file accordingly with the path to your dataset.
python tools/train.py \
--config anomalib/models/<specific-model-name>/<config-file>.yaml
Now just head over to the Comet UI to check out your results!
In the real world, machine learning is a highly iterative process and you’ll likely have many more training runs to visualize and organize. Comet makes it easy to track these runs, share them with members of your team, and collaborate within your organization. By pairing Anomalib with Comet, you can take advantage of all the cutting-edge algorithms of Anomalib, and create production-worthy, maintainable models for your next Industry 4.0 project.
Beyond Model Training
Used the Anomalib+Comet integration to train an anomaly detection model that you are now ready to deploy? Comet’s role in aiding your Industry 4.0 journey doesn’t stop at Experiment Management; Comet also provides a Model Production Monitoring (MPM) platform and Model Registry. With MPM, you can monitor your model while it is in production in a manufacturing environment. MPM can send alerts when it detects anomalies or data drift, signaling it is time to re-train.
Contact the Comet team today to learn more about MPM!
Related Articles