Opik is Comet’s open-source platform for tracing, evaluating, testing, and monitoring LLM and agent applications. It tracks every call an application makes, including prompts, tool calls, retrievals, and LLM outputs. This gives teams tools to understand the application’s behavior, find where it goes wrong, and identify what to improve, from the developer workstation to production.
LLM and agent applications are hard to test, mainly because they are not deterministic. The same input can produce different outputs from one run to the next, and changing a prompt, a model, or a tool can have unintended effects that break expected system behavior. To reliably know whether a change caused the intended behavior, run the application over a fixed set of cases and compare the results with previous runs. In Opik, this kind of set is called a dataset or test suite. These are versioned collections of inputs and often their expected outputs. In the case of test suites, they go one step further, their items state the expected behavior as natural-language assertions, which an LLM judge checks against the actual outputs.
An experiment is a run of the application over a dataset or test suite that records every item produced and its scores. This lets us compare runs item by item and see the full state of the application.
Every evaluation runs the application on each dataset item and writes an experiment item with its trace and scores, which then are read back to compare runs. All this data, the dataset items and the experiment results, lands in ClickHouse, our analytics database. So how fast an evaluation runs depends both on how fast the application produces its outputs and on how fast Opik can write and read that data.
Running periodic evaluations on large datasets wasn’t practical in Opik: a large dataset upload could take close to an hour, and we couldn’t run experiments on such datasets in a reasonable time. Once our engineering team figured that out, we set out to fix that, so teams with large datasets could run evaluations in Opik as often as they need.
We measured the whole dataset and experiment pipeline to learn where the time and resources went and how far each setup could go. The resulting changes made dataset uploads up to ~30× faster and experiments ~20× faster, all while using far less memory than before.
The problem: periodic evaluation at scale
Periodic evaluations repeat the same cycles on every run. Each run uploads or refreshes the datasets/test suites, runs the experiment, and writes its results, then reads them back to compare. At around 100K items, every step of the cycle was too slow to repeat, and the first step often didn’t finish in a reasonable time. For testing, we defined a dataset with 100K relatively small items, and a heavier one with 30K but much larger items.
Step in the cycle | Where we started | Why it blocked periodic evaluations |
|---|---|---|
Upload the dataset | About 40 minutes and 17.8 GiB RAM for 30K large rows (SDK 2.2.44) | 40 minutes per run, and memory grew with the dataset |
Upload a larger dataset | The full 100K small rows needed ~72 GB RAM, many times the size of the data itself | It could not run on a 32 GiB machine, let alone a laptop or CI runner |
Write the experiment | 5 minutes for 100K items, single-threaded | Five minutes with the client idle three-quarters of the time |
Read the results back | 4 min 33 s for 100K items (SDK 2.2.74); HTTP 500 when read concurrently | Over four minutes, just to look at results |
Our starting point was to test scenarios representative of the workloads we were targeting and measure how the system would behave in each one before changing anything.
Overall latency was a crucial KPI, but not the only one. A change that is faster but holds the dataset in memory, sends more bytes, or fails less clearly is not a win for someone running evaluations on a schedule or on their CI. So every scenario recorded KPIs on both sides of the wire. On the client, we measured:
What we measured | How | Why it mattered |
|---|---|---|
Latency | Wall time and items/s per run, plus request p50 | The headline: how long one step of the cycle takes |
Client memory | Peak RSS of the uploading process | Decides whether a large upload runs at all on a laptop or CI runner |
Client CPU | CPU ms per item | Shows whether a change removed work or only spread it over more threads |
Efficiency | Requests in flight against the thread count; time waiting versus working | Shows whether the client was idle or the bottleneck |
Bytes sent | Wire bytes and request count | Rules out “faster because it sends less” and tracks egress cost |
Developer experience | Error handling and validation behavior | A faster upload must still fail clearly and early on bad input |
On the backend and ClickHouse:
What we measured | How | Why it mattered |
|---|---|---|
Query efficiency | ClickHouse rows read per row written, and per page returned, from system.query_log | Exposes queries whose cost grows with the experiment instead of the request |
CPU | Backend pod core-seconds per upload; ClickHouse CPU per query type | Shows what each upload costs the server, not just how long it takes |
Memory | ClickHouse memory per query; memory-limit errors | Decides whether concurrent reads succeed or fail with HTTP 500 |
Latency | Backend request p50; ClickHouse query duration | Separates server time from client time |
Concurrency | Throughput and backend CPU as client threads increase | Shows whether extra parallelism buys throughput or just contention |
We tracked those KPIs because client timings only show how long the client waited, not what the server spent in the meantime or where that time went.
Test Scenarios
Once we knew what we were looking for, we prepared the test scenarios: large data-heavy ones, small ones, large numbers of items with small payload per item, and edge cases. We checked every run item by item against the server, so we didn’t add any run that lost or failed items to the comparison.
The next step was an environment where we could run these scenarios many times, with as few external factors as possible. To make every measurement reproducible, we ran the client and the server on dedicated infrastructure, with no other load and no other components.
Finally, timings say that something is slow, but they don’t say where. Each layer had its own instrumentation, and we located every bottleneck with it rather than guessing.
Layer | What we used | What it located |
|---|---|---|
Backend | OpenTelemetry metrics: request latency, throughput, and resource use per endpoint | Whether time went to the backend at all, and which endpoint paid for it |
ClickHouse | system.query_log grouped by query shape (rows read, duration, memory, CPU), EXPLAIN, and table-level metrics | The aggregates query reading 99.4% of all rows during a bulk upload; a paging scan reading 1.24M rows to return 2,000 |
SDK | Profiling (cProfile), per-phase CPU timing, a memory sampler, and requests-in-flight counts | 85% of read time spent converting responses into models; four upload passes taking 17.4 s before the first request |
What we found, and how we fixed it
Each finding follows the same path, in the order we worked through it:
- Symptom: A finding started from a number that looked wrong, like an upload slower than its data justified, a client idle while it should have been sending, memory growing with the dataset, or a server doing more work than the data required. The symptom said that something was off, not why.
- How we located it: We traced the symptom to its cause across layers, including client CPU, requests in flight, backend request times, the ClickHouse query log, and lock and thread metrics. Pinpointing the cause helped us understand the findings.
- The fix: The change and the release that shipped it.
- What it bought: We ran the same scenarios again, before and after, on the same environment, measuring both the client and the backend. Each finding’s tables come from their own interleaved runs so that the same release can differ by a few seconds from one finding to the next. Each fix also moved the bottleneck elsewhere, and the next finding starts there.
Finding 1: Dataset versioning serialized every batch behind one lock
Symptom: On the 100K small items, the backend, not the client, set the pace: the client waited on every batch, and batches took longer the further the upload went.
How we located it: Opik datasets are versioned. Every upload batch lands in a dataset version, and the backend determines which incoming items are new and which already exist so it can maintain the version’s count. The whole batch write ran inside a per-dataset lock; the lock had been added to prevent concurrent uploads from racing on the dataset’s latest version pointer and causing silent dropping of rows. But it covered far more than that race. A single dataset.insert() of ~100K rows is one version creation followed by 99 appends, so 99 of 100 batches queued on a lock they did not need. And everything inside the lock added up, batch after batch:
- The new-versus-existing check, the aggregates query that read 99.4% of all rows during a bulk upload, read the whole version. To classify 1,000 incoming items, each batch read every item already in the version, so batch k read k × 1,000 rows and the cost grew quadratically over an upload.
- The version counters took three MySQL round trips per batch: read the version, write totals computed in Java, read it back.
The fix, in two steps:
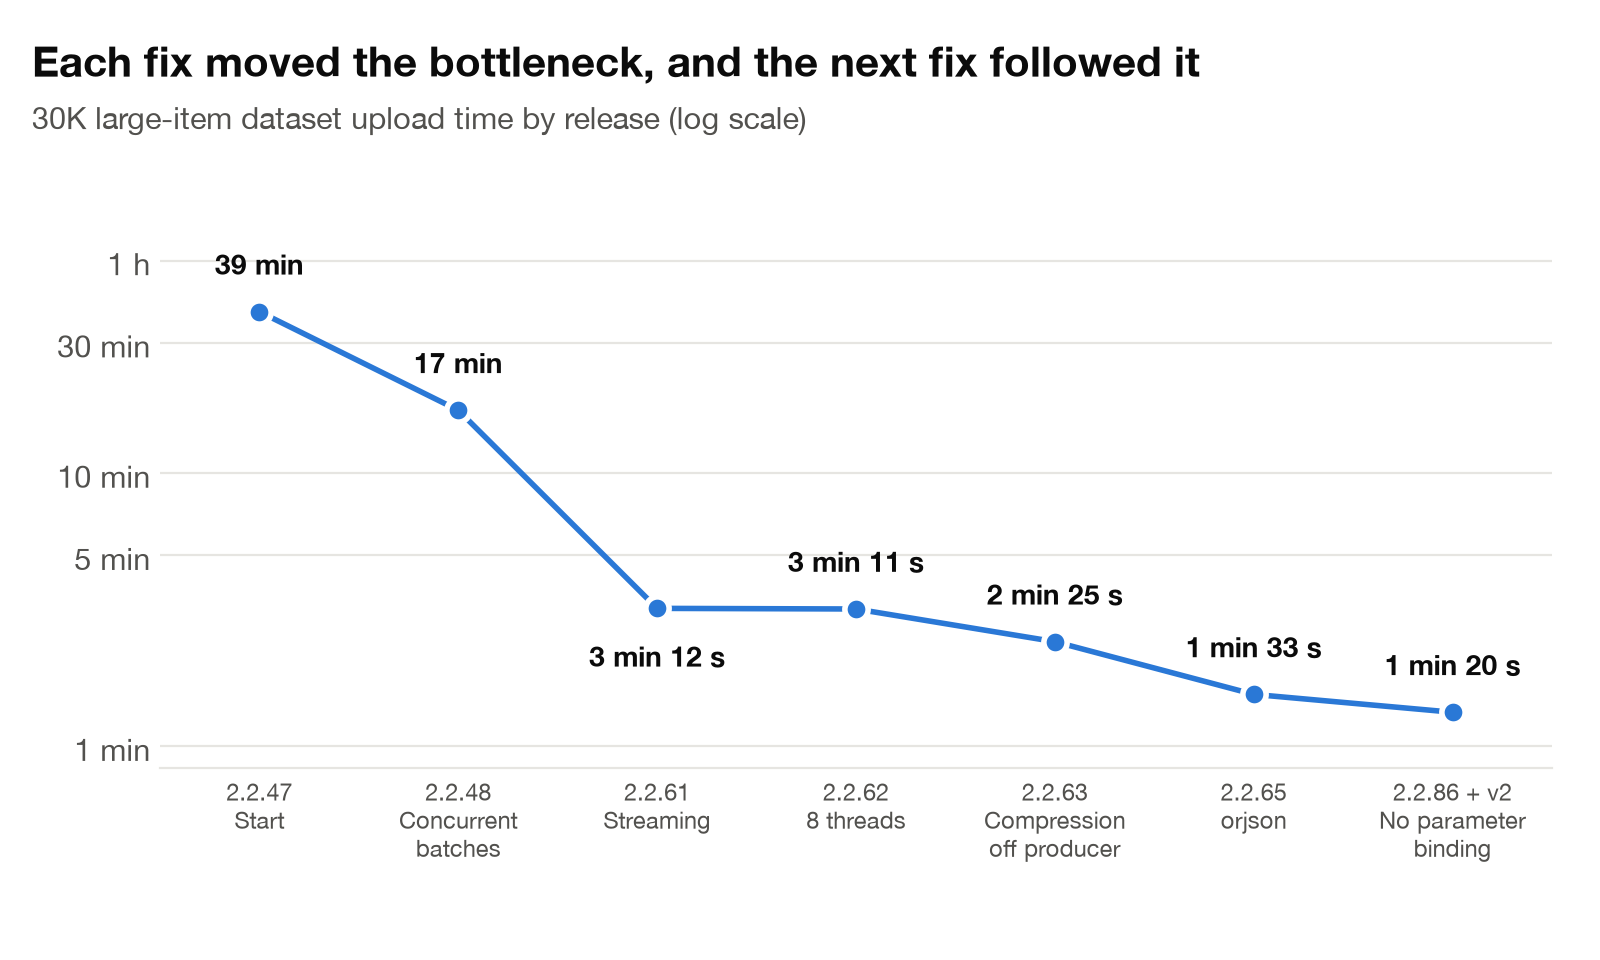
- Version 2.2.45: Signed atomic counter updates in one SQL statement, instead of three MySQL round trips
- Version 2.2.46: Appends into an existing version run without the lock; only version creation keeps it, re-checked inside
What it bought: With the 2.2.46 lock change, the same SDK uploading the same 100K small items into a new dataset went from 89.1 s to 41 s, a 2.17× improvement. These gains are for many small items, where the server was the bottleneck. With 30K large, deeply nested items, the same releases all took ~1030 s. Before 2.2.46, the lock was taken once per batch (832 times), but it cost only about 3 s in total, because the client kept only ~0.2 requests in flight. On that workload, the client was the bottleneck, which led us to Finding 2.
Finding 2: With the lock gone, the bottleneck moved to the client
Symptom: Once the server stopped serializing batches, it could accept uploads faster than the SDK could produce them. The bottleneck was no longer in the backend or ClickHouse; it was in the client.
How we located it: The client-side instruments showed two different bottlenecks, one for each kind of data. On small items, the client mostly waited; it used 20 s of CPU across a 1 min 45 s upload and averaged 0.81 requests in flight, meaning it sent one batch and waited for the response, then sent the next. On large items, the client was busy instead, using about 36 minutes of CPU across a 39-minute upload to prepare each item before sending it.
The fix, in two steps:
- Version 2.2.48: Send batches concurrently; uploads went from one thread to four by default, so up to four batches are in flight at once and the waits between them overlap. Users control it with the num_threads argument in Dataset.insert(). The SDK only does this against backends that include the Finding 1 fix, where concurrent batches of the same upload are safe.
- Version 2.2.48: Make deduplication optional; before sending anything, the SDK hashes every item to drop duplicates. When adding to a dataset that already exists, it first downloads and hashes every existing item. A periodic job adding to the same large dataset pays that on every run. Using deduplication=False skips both steps when the caller knows the items are unique.
What it bought: Uploads finished 2.58× faster on small items and 2.30× on large ones, with the same client CPU. The client did the same work, but leveraging the available resources, on the same backend, uploading into a new dataset:
Dataset | SDK (default threads) | Upload time | Requests in flight | Client CPU | ClickHouse inserts running at once |
|---|---|---|---|---|---|
100K small items | 2.2.47 (1 thread) | 1 min 45 s | 0.81 | 20.0 s | 0.36 |
100K small items | 2.2.48 (4 threads) | 40.7 s | 2.85 | 20.1 s | 1.2–1.7 |
30K large items | 2.2.47 (1 thread) | 39 minutes | 0.09 | 36 minutes | 0.03 |
30K large items | 2.2.48 (4 threads) | 17 minutes | 0.21 | 36 minutes | 0.06–0.07 |
Turning off deduplication saved 35 s of client CPU on large items, but made no measurable difference on the small one. On large items, four threads could not help with the preparation itself: the client still spent about 8 min 45 s preparing items before its first request. That is where Finding 3 starts.
Finding 3: Stream the upload instead of loading it
Symptom: Even with four threads sending, large uploads still took half their time before the first request. On 30K large items, about 8 min 45 s of a 17-minute upload passed before anything was sent, and the client held 17.8 GiB of memory while it waited.
How we located it: Two instruments pointed at the same place; the client memory grew with the source size, meaning the SDK held every item at once. Also, the delay before the first request, on the client, matched the delay before the first insert in ClickHouse’s query log. Nothing reached the backend until the SDK had read the whole source and split it into batches. The time was spent loading, not sending.
The fix, in two steps:
- Version 2.2.61: Stream the source. Items are now read, batched, and sent as they go: each batch leaves as soon as it is full, and no items are kept once their request has been sent. Users get this by passing a generator, or any other iterator that produces items on demand, to Dataset.insert(), or by loading the file with Dataset.read_jsonl_from_file(). A list still works, but it is already fully in memory before the upload starts, so it gains nothing.
- Version 2.2.61: Keep the validation guarantee, and make it optional. These methods promised that every item was checked before any request was sent to the backend, and streaming could not quietly drop that. So by default, read_jsonl_from_file() now makes one fast validation pass over the file and then streams it, the same guarantee, at a fraction of the memory. Also, with validate_before_upload=False, the SDK starts streaming immediately and stops at the first bad item. That suits files that were already validated when they were generated, and because datasets are versioned, you fix a bad upload by uploading a new version.
What it bought: In the 30K large items case, uploading the file went from running out of memory to about 3 minutes with the default settings, and about 2 min 40 s without the validation pass. On small items, streaming cut client memory by about 3× and client CPU by about 4×; on large items, memory fell from running out to under 200 MiB. On the 100K small items case, uploaded from a file, on the same backend:
SDK | Upload time | Client CPU | Peak client memory | Requests in flight |
|---|---|---|---|---|
2.2.48 (loads the whole file) | 38.5 s | 19.7 s | 384 MiB | 2.88 |
2.2.61, validation on (default) | 32.7 s | 4.6 s | 127 MiB | 3.80 |
2.2.61, validation off | 31.8 s | 3.3 s | 127 MiB | 3.94 |
The backend saw the difference too; its first insert arrived 8 s into the upload with 2.2.48, 3 s with 2.2.61, and 2 s when the validation pass was off. On small items, the pass cost about 1.2 s of the client CPU and had no measurable effect on upload time.
30K large items dataset | Upload time | Client CPU | Peak client memory | First request after |
|---|---|---|---|---|
2.2.48 | OOM | all of the machine’s available memory | never | |
2.2.61, validation on (default) | 3 min 12 s | 3 min 12 s | 193 MiB | 32–43 s |
2.2.61, validation off | 2 min 39 s | 2 min 41 s | 193 MiB | 2 s |
Uploading the same 30K large items from a file was worse than the in-memory upload in Finding 2. In 2.2.48, read_jsonl_from_file() parsed every line, turned the whole list back into one JSON string, and parsed it again, doing several full copies of the whole file that sat in memory at once. Also, in that case, the validation pass was no longer free. It cost about 33 s, which is exactly what validate_before_upload=False gives back. Then, with the client much lighter and almost all four requests in flight on small items, the next question was whether more of them would help. That led us to Finding 4.
Finding 4: More concurrency, now that the producer can keep up
Symptom: After streaming, the client almost always had a request waiting to go out. On the 100K small items, it kept about 3.8 of its 4 threads busy, so the thread count became the limit, and the backend seemed far from busy.
How we located it: Two measurements had to agree before adding threads was worth trying. The SDK has two parts on the upload path: the producer, a single thread that reads, validates, deduplicates, and fills batches, and the dispatcher, a pool of threads that sends them. The producer had capacity to spare. On the small items, it used around 17% of one core. The requests in flight were set at the thread limit, not below it. Together, they meant the client could prepare batches faster than four threads could send them.
The fix: Raise the default number of threads in SDK 2.2.62. Dataset uploads went from 4 to 8 threads, and bulk experiments did too. Users control it with the same num_threads argument as before, and a lower value caps the requests in flight.
What it bought. It depends on who was waiting for whom. On the same backend, uploading from a file into a new dataset:
Data | Threads | Upload time | Requests in flight | ClickHouse insert concurrency | Producer thread, share of one core |
|---|---|---|---|---|---|
100K small items | 4 (2.2.61) | 32.4 s | 3.80 | ~1.9 | 15–19% |
100K small items | 8 (2.2.62) | 27.6 s | 7.41 | ~3.9 | 17–21% |
30K large items | 4 (2.2.61) | 3 min 10 s | 1.56 | 0.8 | 99–100% |
30K large items | 8 (2.2.62) | 3 min 11 s | 1.55 | 0.8 | 99–100% |
On small items, the producer had capacity to spare, so it used the extra threads; almost eight requests were in flight, the backend’s inserts overlapped twice as much, and the upload finished 1.18× faster than before. On the other hand, with large items, nothing changed; the producer thread ran at 100% on one core for the whole upload and couldn’t fill even two requests at a time. The producer itself was now the bottleneck; that is where Finding 5 starts.
Finding 5: Move compression off the producer
Symptom: On large items, more dispatcher threads changed nothing: the producer ran at 100% of one core for the whole upload, and requests in flight stayed around 1.5.
How we located it: Splitting client CPU by threads showed where the time went. On the 30K large items, the producer used 3 min 11 s of CPU in a 3 min 11 s upload, while all the dispatcher threads together used 2 s. The producer was also gzip-compressing every batch as it built it, and compression is the one that doesn’t need to run in item order. It could run anywhere.
The fix: In SDK 2.2.63, compression moved to the dispatcher; each dispatcher thread now compresses the batch it is about to send, so batches are compressed concurrently, leaving the producer to read and prepare them.
What it bought: On the 30K large items, uploads finished 1.31× faster. About 47 s of compression left the producer and spread across the dispatcher threads, so more requests were in flight, and the backend’s inserts overlapped twice as much. Uploading datasets from file into the system:
Data | SDK | Upload time | Producer CPU | Dispatcher CPU | Requests in flight | Peak client memory |
|---|---|---|---|---|---|---|
30K large items | 2.2.62 | 3 min 11 s | 3 min 11 s | 2 s | 1.57 | 193 MiB |
30K large items | 2.2.63 | 2 min 25 s | 2 min 24 s | ~46 s | 2.8 | ~350 MiB |
100K small items | 2.2.62 | 29.1 s | 5.2 s | 0.2 s | 7.4 | 130 MiB |
100K small items | 2.2.63 | 26.8 s | 5.3 s | 0.8 s | 7.1 | 138 MiB |
The trade-off was memory, since raw batches now wait for a worker to compress them, so peak client memory nearly doubled during a large-item upload. On small items, compression had never been significant, and the difference stayed within run-to-run variation. On the other hand, on large items, the producer was still busy 100% of the time with what it had left, like reading, validating, deduplicating, and serializing. This is the starting point for Finding 6.
Finding 6: A faster serializer
Symptom: After moving compression, the producer on large items was still at 99% of one core, and each row still cost it about 4.7 ms. The only way forward was to make that work cheaper.
How we found it: We measured the producer’s CPU time per large item at about 4.7 ms. Most of it was serialization, which ran twice per item: once for the request body and once for the context hash that deduplication computes. Unlike compression, serialization couldn’t move to the dispatcher threads. gzip releases Python’s global interpreter lock while it works, but the JSON encoder holds it so that more threads wouldn’t have made it faster.
The fix, in two steps:
- Version 2.2.65: Serialize with orjson where it is available. Python’s standard json library is not the fastest encoder, so the SDK now uses orjson for both request bodies and the deduplication hash. There is nothing to configure; 2.2.65 installs orjson by default wherever a prebuilt package exists, and anywhere it is not available, the SDK falls back to the standard library, set up to produce the same values earlier releases sent.
- Version 2.2.65: Write bytes directly; each serialization used to produce text and then convert it to bytes, so orjson now writes bytes directly and removes that conversion. Part of the gain comes from the faster library, and part from removing the intermediate conversion.
What it bought: In the 30K large items case, the producer’s work per row fell from 4.7 ms to 2.6 ms, and uploads finished 1.57× faster. Uploading from a file into a new dataset with the default settings:
Data | SDK | Upload time | Producer CPU per row | Producer busy | Requests | Requests in flight | Peak client memory |
|---|---|---|---|---|---|---|---|
30K large items | 2.2.63 | 2 min 25 s | 4.78 ms | 99% | 923 | 2.9 | ~350 MiB |
30K large items | 2.2.65 | 1 min 33 s | 2.65 ms | 86% | 832 | 4.7 | ~615 MiB |
100K small items | 2.2.63 | 30.7 s | 0.053 ms | 18% | 100 | 7.2 | 138 MiB |
100K small items | 2.2.65 | 31.2 s | 0.043 ms | 14% | 100 | 7.3 | 185 MiB |
For the first time, the producer was not pinned at 100%, so the dispatcher kept more requests in flight and the backend’s inserts overlapped more. The more compact output of orjson also packed the same items into fewer requests. The trade-off was memory again: peak client memory on large items rose from about 350 MiB to about 615 MiB, with more batches in flight at once. On small items, work per row fell too, but upload time didn’t change because the backend already set the pace. This led us to Finding 7.
Finding 7: Stop binding parameters on the backend
Symptom: With the client no longer the bottleneck, the backend set the pace on small items. Each 1K-row request spent 2 s in the backend, but only 1.01 s of that was related to ClickHouse.
How we located it: The gap between the backend’s time per request and ClickHouse’s insert latency was the hint. Much of the request passed before ClickHouse even saw the insert. A JFR profile of the backend during a bulk upload showed where that time went. The ClickHouse R2DBC driver’s parameter binding resolves every bind(name, value) with namedParameters.indexOf(name), a linear scan over all of the statement’s parameter names. Bulk inserts render one placeholder per column per row, so that list grows with the batch, and binding a full batch becomes O(n²).
The fix, in two steps:
- Versions 2.2.73…2.2.79: Stream rows through ClickHouse’s v2 client, so the backend now sends rows to ClickHouse as JSONEachRow, so there are no parameter names to look up and no inlined statement to parse, all behind the ANALYTICS_DB_BULK_INSERT_V2_CLIENT_ENABLED toggle, which is off by default.
- Version 2.2.101: Removes the toggle, and the R2DBC bulk APIs now use the new client.
What it bought: Up to 3.7× faster uploads, depending on how many rows each request carries. Uploading from a file into a new dataset with the default settings, using version 2.2.65 vs 2.2.86 with the v2 client toggle on:
Data | Rows per request | Backend insert path | Upload time | Backend time per request | ClickHouse time per insert | Client CPU |
|---|---|---|---|---|---|---|
100K small items | 1K | R2DBC, bound parameters | 28.9 s | 2.08 s | 1.01 s | 4.6 s |
100K small items | 1K | v2 client, JSONEachRow | 7.7 s | 0.36 s | 0.32 s | 4.5 s |
30K large items | ~36 | R2DBC, bound parameters | 1 min 29 s | 0.47 s | 0.23 s | 2 min 9 s |
30K large items | ~36 | v2 client, JSONEachRow | 1 min 20 s | 0.30 s | 0.13 s | 2 min 6 s |
The gain depends on the batch size because the cost of binding grows with the square of the rows in a request. So it lands hardest on full batches. Small items fill the SDK’s 1K-item batch, and each request’s backend time fell almost 6×, from 2.08 s to 0.36 s. Large items reach the request size limit at around 36 rows, so binding was already cheap.
On top of this fastest configuration, we turned off the SDK’s validation pass and deduplication, which is safe when the file is already known to be valid and duplicate-free. The large-item upload fell from 1 min 20 s to 46 s (1.74× faster), and the small-item upload fell from 7.7 s to 6.6 s (1.17× faster).
Finding 8: Experiments shared the bottlenecks, so they shared the fixes
Symptom: Experiments were as slow as datasets on the first test runs using SDK 2.2.48; uploading 100K small items into an experiment took 5 min 34 s. With 30K large items, the upload stored only about 37% of the items after 30 minutes in all three runs.
How we located it: We used the same instruments pointed at the same places. On upload, the client was busy rather than waiting, so we checked, and SDK preparation was again the bottleneck; the backend wrote experiment items, traces, and spans through the same R2DBC binding as dataset items. Reads were also expensive; pages read almost the entire experiment to be built.
The fix, in six steps:
- Version 2.2.62: Raise the SDK default threads for the experiment dispatcher
- Version 2.2.70: Replace the four full passes the SDK made before sending anything (17.4 s of single-threaded CPU on a ~120K-item upload) with a single streaming pass, and add the validate_before_upload=False flag.
- Version 2.2.78: Increase the number of items fetched per page, allow concurrent page fetching using the num_threads argument on Experiment.get_items(), and stop parsing each page into generated models, which had taken ~85% of the client’s read time.
- Version 2.2.79: Ship the v2 client for all entities involved in the experiment ingestion.
- Version 2.2.82: Make each page cost its size, not the whole experiment. Before, a paging scan read 1.24M rows to return the page size.
- Version 2.2.143: Build each page on light columns first, and join the heavy input, output, and metadata once per page, so a page of large items no longer carries every payload through the grouping.
What it bought: Uploading and reading back an experiment became 19.6× faster. We compared the initial version against the final one (SDK 2.2.86 on backend 2.2.86 with v2 client toggle on), uploading 100K small items into a new experiment linked to a new dataset and then reading them back, each with the SDK default settings:
Step | First version | Final version | Faster |
|---|---|---|---|
Upload | 5 min 34 s | 18.4 s | 18.2× |
Read back | 4 min 27 s | 12.3 s | 21.7× |
Upload and read | 10 min 2 s | 30.7 s | 19.6× |
The upload used a tenth of the client CPU (2 minutes down to 12.3 s), and peak memory fell from 1.2 GiB to 264 MiB. The read now takes 53 requests instead of 1029. With each page reading only its own rows, concurrent reads of the 100K small item experiment no longer failed with HTTP 500. For the 30K large items, we lowered num_threads from the default eight to four, since each page of large items uses much more memory. The reading now takes about 5 minutes. For the 30K large items, the gap is wider: the first version stored only 37% of the items after 30 minutes, while the final one uploaded all 30K in around 2 minutes.
Conclusion
We set out to make periodic evaluation on large datasets practical in Opik. At the start, uploading a large dataset took about 40 minutes for 30K rows; uploading from a large file couldn’t run on small machines. An experiment took minutes to write, minutes to read back.
No single change got us there; each improvement removed a bottleneck and exposed the next one:
- The backend lock that serialized every batch
- A client that sent one batch at a time
- An SDK that loaded the whole source before sending anything
- Lack of concurrency to use resources more efficiently once the producer could keep up
- Compression, then serialization, on the producer thread
- Parameter binding in the backend
The improvements spanned the SDK, the backend, and ClickHouse. What made this work was a methodical process of measuring, assessing, evaluating, and applying changes on both sides of the wire every time. So we always knew whether the client or the backend was setting the pace. The ~30× was a compounding effect; it was never the goal, but the outcome of an iterative loop process.
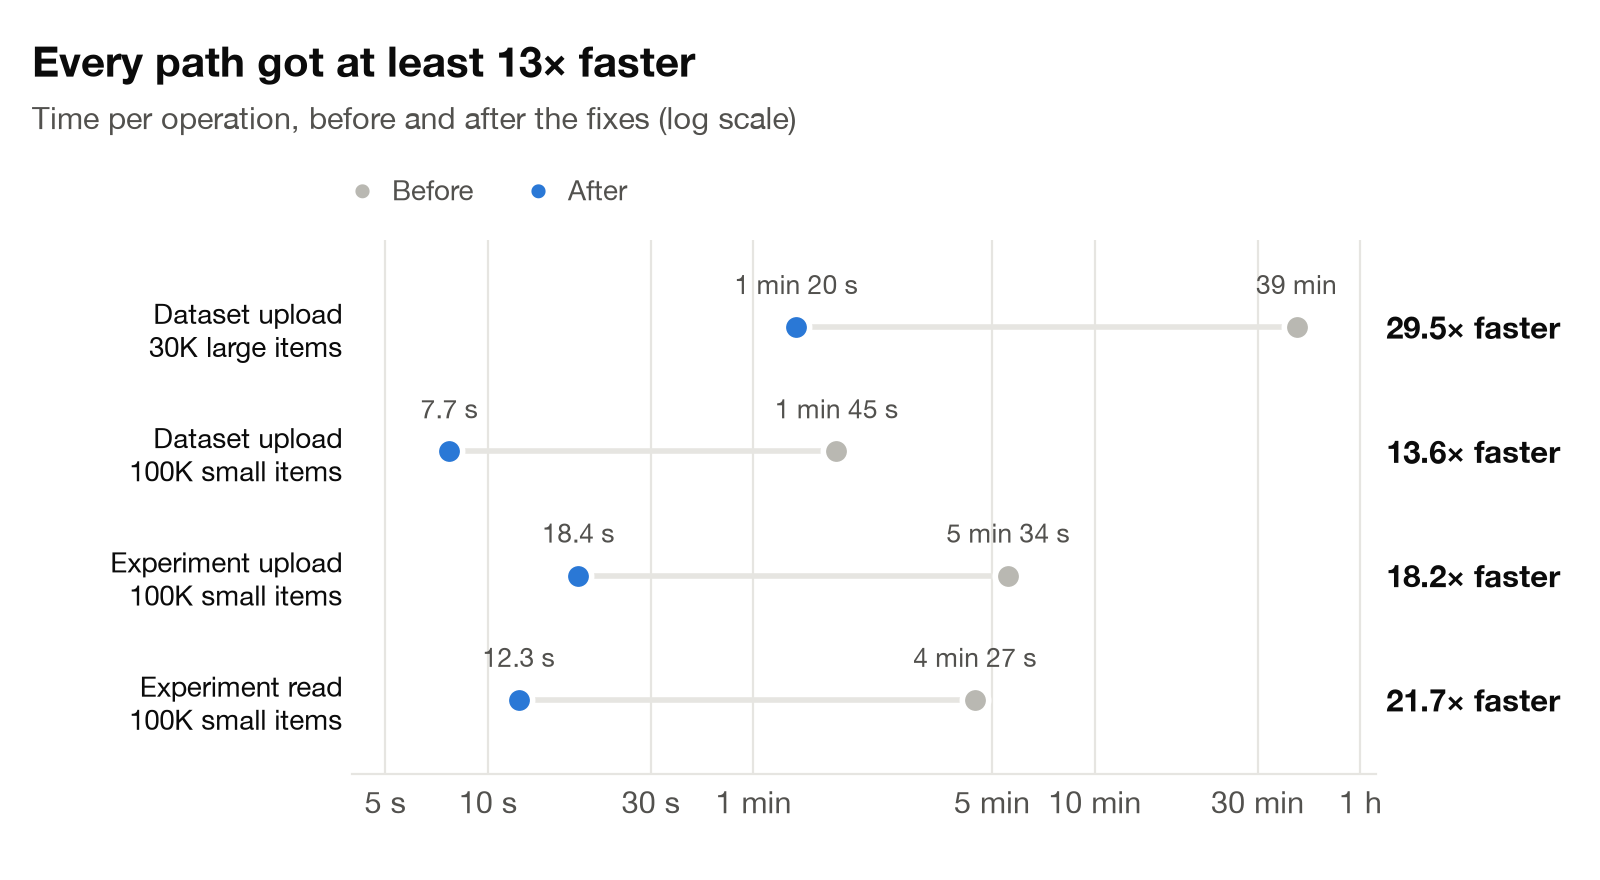
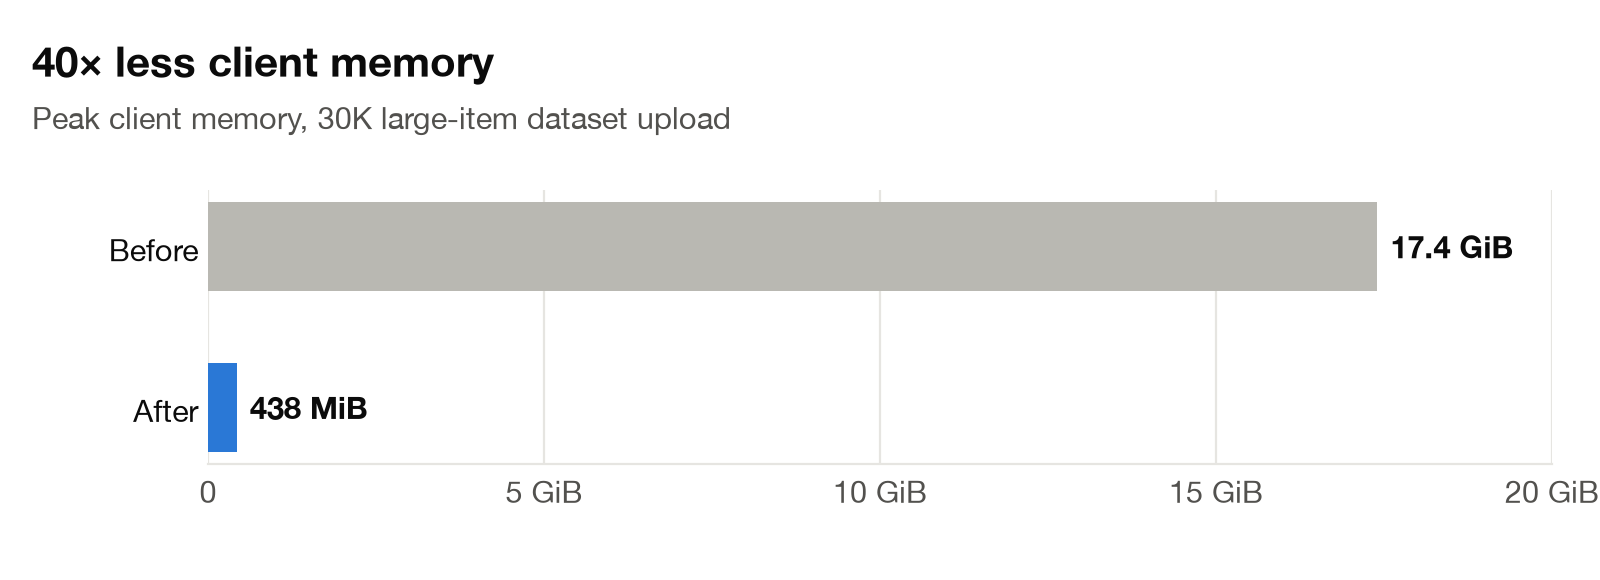
We uploaded 30K large items into a new dataset with the SDK’s default settings. With version 2.2.46, it took 39 minutes and 17.4 GiB of client memory. With version 2.2.86, with the v2 toggle on, it took 1 min 20 s and 438 MiB: 29.5× faster, with 40× less memory.
Every other path got at least 13× faster. Each figure is the median of three or four interleaved runs on the benchmark environment, with every upload checked item by item against what the backend stored.
Path | Workload | Before | After | Change |
|---|---|---|---|---|
Dataset upload | 30K large items | 39 minutes, 17.4 GiB | 1 min 20 s, 438 MiB | 29.5× faster, 40× less memory |
Dataset upload | 30K large items, from a 4.8 GB file | could not run (out of memory) | 1 min 20 s | now possible |
Dataset upload | 100K small items | 1 min 45 s, 398 MiB | 7.7 s, 187 MiB | 13.6× faster |
Experiment upload | 100K small items | 5 min 34 s, 1.2 GiB | 18.4 s, 264 MiB | 18.2× faster |
Experiment read | 100K small items | 4 min 27 s | 12.3 s | 21.7× faster |
Experiment upload | 30K large items | 37% stored after 30 minutes | 1 min 57 s | over 15× faster |
Experiment read | 30K large items | not possible (upload never completed) | 5 min 1 s | now possible |
Both columns upload the same items read from the same file. Before: SDK 2.2.47 on backend 2.2.46, where Dataset.insert() collected every item into memory before sending the first one. With that SDK, the file loader ran out of memory on the large file. After: SDK 2.2.65 on backend 2.2.86 with the v2 client, uploading with Dataset.read_jsonl_from_file(), which streams. The 30K large-item read ran on backend 2.2.143, with four concurrent pages.
With validation and deduplication also turned off, the large dataset upload took 46.0 s and the small one 6.6 s.
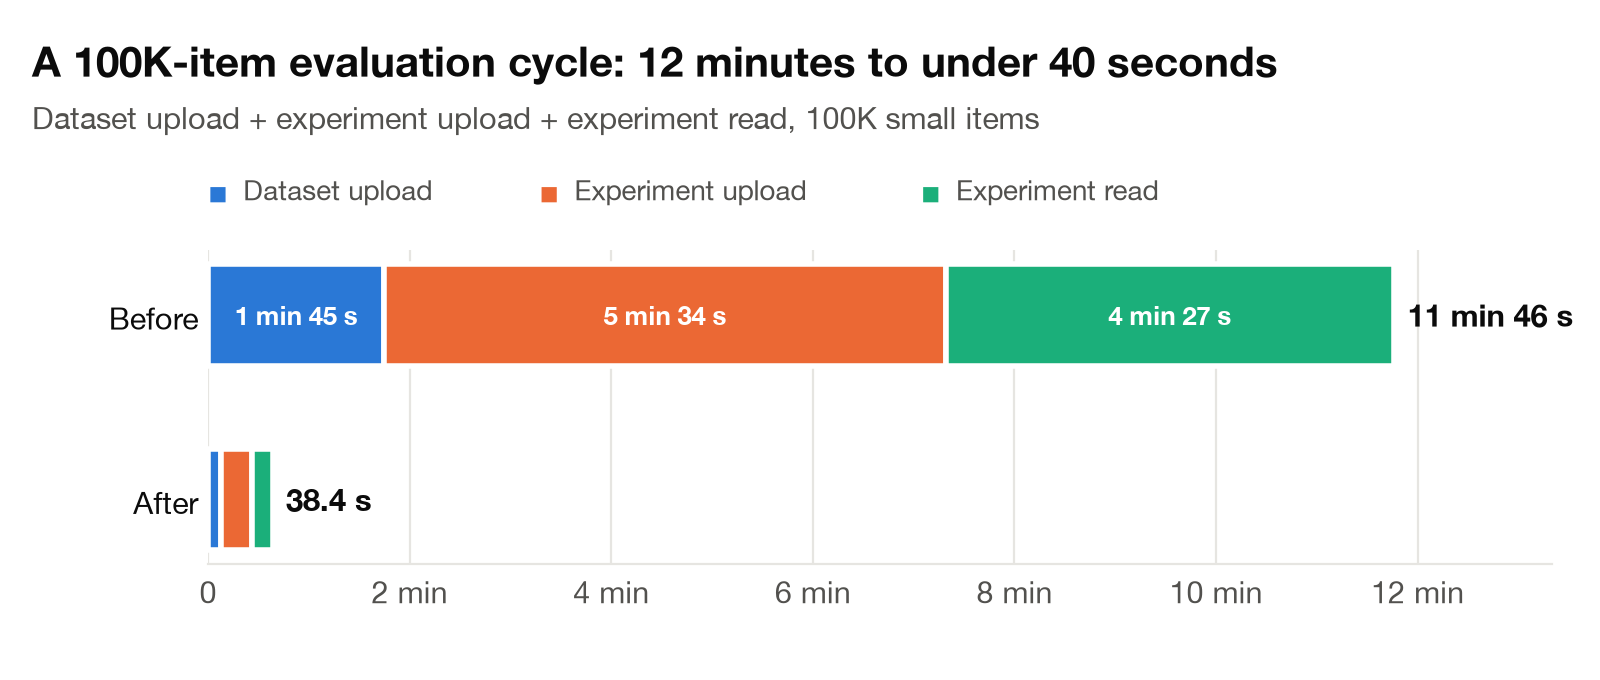
On 100K small items, a full evaluation cycle (uploading the dataset, writing the experiment, and reading it back) went from 12 minutes to under 40 seconds. On 30K large items, the same cycle previously couldn’t be completed, and now finishes in about 8 minutes. That is the kind of short cycle that was our goal.
What’s next
We’ll keep improving the ingestion and retrieval pipelines so that any kind of evaluation and testing can run after every change to an LLM or agent application monitored by Opik. We also recommend checking our blog on AI Evaluation.
We also welcome you to contribute to Opik on our GitHub repository, with code or by opening an issue when you find something that can be improved.