Image transformations such as cartooning images are a common hobby for many people. Cartoons were a great source of entertainment during our childhood and image cartooning has been trending for a while and people use different applications to transform their images into cartoon images.
In this article, we are interested in the process involved in the transformation of RGB images to cartoon images. We aim to use OpenCV and Python to transform images into its cartoon.
What is OpenCV?
OpenCV is an open-source, cross-platform library used for real-time computer vision and model execution for Machine Learning. It is commonly used for image processing and transformation, object detection, face recognition among others. OpenCV is also used in creating image processing or rendering applications.
We intend to perform some image transformations such as making sketches, smoothening, cartooning on images using CV2 version of OpenCV. You can access the full code of this project in Google Colab here. In this project we will go through the following steps:
1. Install OpenCV
2. Import required libraries
3. Uploading and reading the image
4. Transform image to grayscale
5. Smoothing the grayscale image
6. Detect and enhance the image edges
7. Create a mask image
8. Cartoonify the image
9. Plot all transitions
10. Other image transformations
Installing OpenCV
We will run the following command to install OpenCV:
#installing opencv%pip install opencv-python
We are now ready to start our image transformation process.
Libraries
We will import the following required libraries:
#importing required librariesimport cv2import numpy as npimport matplotlib.pyplot as plt
CV2 — this will be used for image processing.
Numpy — Images are normally stored and processed as arrays. Numpy is optimized for dealing with arrays.
Matplotlib — This library will be used to plot the transformed images.
Uploading and Reading the Image
The colab function allows us to select an image from a device. Imread is a function in CV2 used to store images in the form of numbers. The image is read as a numpy array where the cell values depict R, G, and B values of a pixel. This helps to perform custom operations on the image.
#upload image file using colab functionfrom google.colab import filesuploaded_image=files.upload()#reading imageoriginal_image = cv2.imread('passport_new.jpg')original_image = cv2.cvtColor(original_image,cv2.COLOR_BGR2RGB)resized1=cv2.resize(original_image, (960,840))plt.imshow(resized1)

Transform Image to Grayscale
The cvtColor (image, flag) method in CV2 transforms an image into the color-spaced referred to as ‘flag’. We can choose any color flag but, in this case, we opted for the grayscale and thus used the BGR2GRAY flag.
#transforming image to grayscalegrayscale_image=cv2.cvtColor(original_image, cv2.COLOR_BGR2GRAY)resized2=cv2.resize(grayscale_image, (960,840))plt.imshow(resized2,cmap='gray')

Smoothing the Grayscale Image
We apply the blur effect using the medianBlur() function to smooth the image. The center pixel is assigned a mean value of all the pixels which in turn creates a blurring effect.
#apply median blur to smoothen an imagesmooth_grayscale=cv2.medianBlur(grayscale_image,5)resized3=cv2.resize(smooth_grayscale,(960,840))plt.imshow(resized3,cmap='gray')

Introducing the Comet AI art gallery — a public forum to log experiments, test different parameters, and share your AI-generated art! Learn more about our integration with Gradio to create this one-of-a-kind space.
Detect and Enhance the Image Edges
Cartooning an image is more about detecting the image’s edges and highlighting them. In this step, we detect and enhance the edges of the image by the thresholding technique. The threshold value is the mean of the neighborhood pixel values area minus constant C. Thresh_binary is the type of threshold applied and (9, 9) the block size.
#retrieve the edges for cartoon effect using threshold effectimage_edge=cv2.adaptiveThreshold(smooth_grayscale,255,cv2.ADAPTIVE_THRESH_MEAN_C,cv2.THRESH_BINARY,9,9)resized4=cv2.resize(image_edge,(960,840))plt.imshow(resized4,cmap='gray')

Creating a Mask Image
The bilateralFilter() function enables us to keep the image edges sharp and textures smooth. The second value (9) is the diameter of the pixel neighborhood i.e. the number of pixels around a certain pixel that determines its value. The third and fourth values (350, 350) determine the sigmaColor and sigmaSpace. These values give the sigma effect i.e. the image looks sharp with smooth textures. We can change the value of sigmaColor and sigmaSpace to see the change in the output of the image.
#using bilateral filter to remove noise and keep edge sharpcolored_image=cv2.bilateralFilter(original_image,9,350,350)resized5=cv2.resize(colored_image,(960,840))plt.imshow(resized5,cmap='gray')

Cartoonify the Image
We will now combine the image outputs through masking. The CV2 bitwise function enables us to mask the images and give a cartoon effect to the image output with thicker lines and blurred colors.
#cartooning the imagecartoon_image=cv2.bitwise_and(colored_image,colored_image,mask=image_edge)resized6=cv2.resize(cartoon_image,(960,840))plt.imshow(resized6,cmap='gray')

Plotting all Transitions
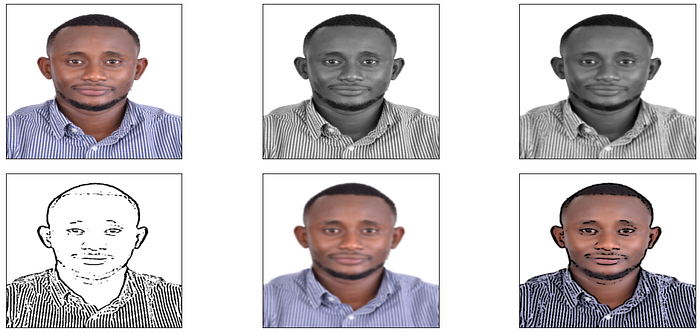
We will first make a list of all image outputs. The image list contains all the resized images. The output plot displays the image transitions from the original to the cartoon image.
#plotting all transitionsimage_list=[resized1,resized2,resized3,resized4,resized5,resized6]fig, axes=plt.subplots(2,3, figsize=(18,8),subplot_kw={'xticks':[],'yticks':[]},gridspec_kw=dict(hspace=0.1,wspace=0.1))for i, ax in enumerate (axes.flat):ax.imshow(image_list[i],cmap='gray')plt.show()
Other Image Transformations
Stylization: In this transformation, we use the stylization technique to create a cartoon of the image. We can edit the sigma color and radius to get a better output.
#stylization techniquestylization_image=cv2.stylization(original_image,sigma_s=100,sigma_r=0.1)plt.figure(figsize=(18,8))plt.imshow(stylization_image,cmap='gray')

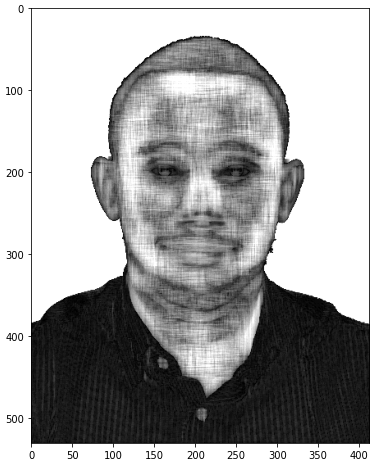
Pencil Sketch: We will implement the pencil sketch to create a cartoon image in this transformation. The cv2.pencilSketch() function automatically applies the dodging and burning effects to the original image. These techniques were commonly used in traditional photography. Dodging lightens an image, whereas burning darkens it.
#pencil sketch techniquepencilsketch_image1,pencilsketch_image2=cv2.pencilSketch(original_image,sigma_s=50,sigma_r=0.3,shade_factor=0.02)plt.figure(figsize=(18,8))plt.imshow(pencilsketch_image1,cmap='gray')
Conclusion
In this article, we have demonstrated how we can use OpenCV in Python to create different image transformations. Feel free to try these transformations on your own. In case of any questions, comments you can get in touch via my Linkedln profile. Thanks for reading!
