
If you run an AI agent in production, you already know the drill. Something goes wrong, a user complains, or you just get a nagging feeling the agent isn’t behaving quite right. So you open Opik, your AI observability and agent tracing tool, find the trace, and read through it until you spot the problem.
That works for debugging one trace. It doesn’t work for the thousands your agent produces in a day.
We wanted to fix that. Here’s how we built Diagnostics, our automated agent debugging tool, for Opik — and the two false starts it took to get there.
The Problem With Reading Traces One at a Time
Talk to any team running agents in production and you’ll hear a version of the same workflow:
- A developer, QA engineer, or end user notices something is off.
- They go into Opik, find the trace, and download it.
- They paste the trace JSON into Claude Code (or whatever LLM they have handy) to figure out what went wrong.
This works, but it’s entirely manual, and it only surfaces the one issue someone happened to trip over. The more disciplined teams also run periodic “review sessions,” where someone reads through a random sample of traces looking for patterns nobody’s reported yet. It’s a good instinct, but reading traces one at a time to spot patterns is like trying to understand a city’s traffic by watching a single car — it doesn’t scale past a handful of traces a week, and it’ll never tell you that the same tool call has been failing for a missing parameter all week, or that a prompt tweak quietly doubled how often the agent retries itself.
Worse, the failures that matter most rarely throw an exception in the first place. An agent that quietly retries a failing tool three times with no strategy change, or burns ten short reasoning turns without making progress, doesn’t crash — it just produces a worse, slower, or more expensive answer. That kind of silent failure is invisible from a stack trace, and fixing it might mean touching a prompt, a tool definition, the agent’s code, or something further upstream like a RAG pipeline feeding it bad context. None of that shows up unless you go looking for it.
We wanted an agent that goes looking for it — reading the traces so you don’t have to, and coming back with something more useful than “here’s a trace that looks weird.”
Agent Debugging Tools We Already Had to Work With
We didn’t start from zero. Ollie, our in-house agent, already knew how to explore Opik’s traces and spans and reason about debugging them. We also had a daily report feature that would summarize a project’s overall activity — patterns, anomalies, and headline metrics for the day.
The daily report told you what happened. What we needed next was something that could tell you why, and what to do about it.
First Attempt: Point Ollie at the Outliers
Our first idea followed naturally from the daily report: a fire-and-forget agent that would dig into causes rather than just describe symptoms.
We already had an endpoint that computed per-project statistics — run time, error rate, tool call counts, trace size — so we used that as a compass. The agent would pull the previous day’s statistics, flag traces that looked suspicious relative to the norm (too slow, too fast, too expensive, too cheap), and dig into just those. We built a dedicated TraceInvestigationAgent sub-agent whose only job was to go deep on one flagged trace, so the parent agent’s context stayed lean instead of filling up with full trace bodies.
We tested it on the most available dataset we had: our own usage of Ollie. Which meant Ollie was investigating Ollie’s own mistakes — a genuinely fun bit of dogfooding, and every issue it found doubled as a bug report for this very project.
But this approach hit a wall we couldn’t tool our way out of: we had no way to confirm findings at scale. If the agent flagged an issue in one trace, we had no idea whether it was a one-off fluke or something affecting every fifth request. And answering that question the obvious way — having the agent read through a large sample of yesterday’s traces one by one — was both too slow and too expensive to ever ship. We eventually ripped out the dedicated stats tool and the standalone trace-investigation agent entirely; neither survived the rework.
The Rework: From Reading Traces to Querying Them
Our first instinct for the rework was to split the agent debugging work across two models: an expensive one to generate theories, and a cheaper one to confirm them across the full dataset. We tried this locally with GLM-4.7-Flash in the “confirm at scale” role. It still wasn’t fast or cheap enough. The users who’d benefit most from Diagnostics are exactly the ones with the highest trace volume, and no matter how inexpensive the model, reading every trace one at a time doesn’t scale to that.
We also looked at pre-computing a summary for every trace at ingestion time, so confirmation would just be a lookup instead of a fresh read. That ran into the same wall from the other direction: instead of paying the cost of a cheap model once, per suspicious trace, we’d be paying it on every single trace that came in, whether anyone ever asked about it or not. At real trace volumes, that’s not a discount — it’s a much bigger bill for something most of it would never be used for.
The real breakthrough was simpler than any of that:
Stop asking the agent to read the data — let it query the data instead.
Every trace and span we store lives in ClickHouse, a column-oriented database built for exactly this kind of aggregate analysis. If the agent could query it, it wouldn’t need to read a single trace to answer “how often does this actually happen?” — it could just ask.
A quick local prototype confirmed the idea immediately. Not only did the findings improve, we could see the difference in kind: some issues we’d previously flagged turned out to barely matter once we could measure their real prevalence, while others we’d have never surfaced through spot-checking turned out to be widespread.
A Query Specialist, Not a Raw Database Connection
We didn’t hand the main agent a database connection and walk away. For production, we built a dedicated ClickHouse sub-agent — one that knows our schema, our SQL dialect quirks, and the query patterns that are efficient against our tables — and gave it a single tool: clickhouse_select.
The main agent gives that sub-agent a plain-language question — “how often does a tool call fail due to a missing parameter in this window?” — and the sub-agent turns it into SQL. If a query errors or comes back empty, it reads the error, adjusts, and retries on its own, within a small turn budget. Only once it’s satisfied does it hand a tight, aggregated answer back to the main agent: a sentence describing what the numbers are, the data itself, and a caveat only when one materially changes how to read the result. No speculation, no “you might also want to check” — the sub-agent’s job ends when the data is on the page, and the main agent owns all the interpretation.
That division of labor keeps the main agent’s context focused on reasoning about findings instead of query mechanics, and it means query quality doesn’t depend on the orchestrating agent’s own SQL skills.
Making Direct Database Access Safe
Giving an LLM-driven agent any path to a production database is worth being paranoid about, and we treated it that way. The clickhouse_select tool doesn’t talk to ClickHouse directly at all — it calls a purpose-built, read-only endpoint on the Opik backend, which is where the real enforcement lives:
- Locked-down access, enforced server-side. The backend runs every query as a read-only user, scoped to the caller’s workspace and project via row policies — not something the agent’s tool code has to get right on its own.
- A narrow, explicit table allowlist. Only three tables are queryable at all:
traces,spans, andauthored_feedback_scores. Anything else — experiments, datasets, prompts — is denied outright. - Dangerous SQL is rejected before it ever runs. Multi-statement queries, DDL/DML, and any
SETTINGSorSETclause (top-level or buried in a subquery) are rejected up front. - Hard resource ceilings. Every query is capped at 180 seconds, 8 GB of memory, and 100k result rows, so even a poorly-shaped aggregation can’t degrade the shared cluster.
Together, this means a hallucinated or malformed instruction from the main agent has nowhere to go: no write access, no cross-tenant access, no way to starve the cluster, and no table outside the three it’s allowed to see.
Where it Landed: Automated Agent Debugging
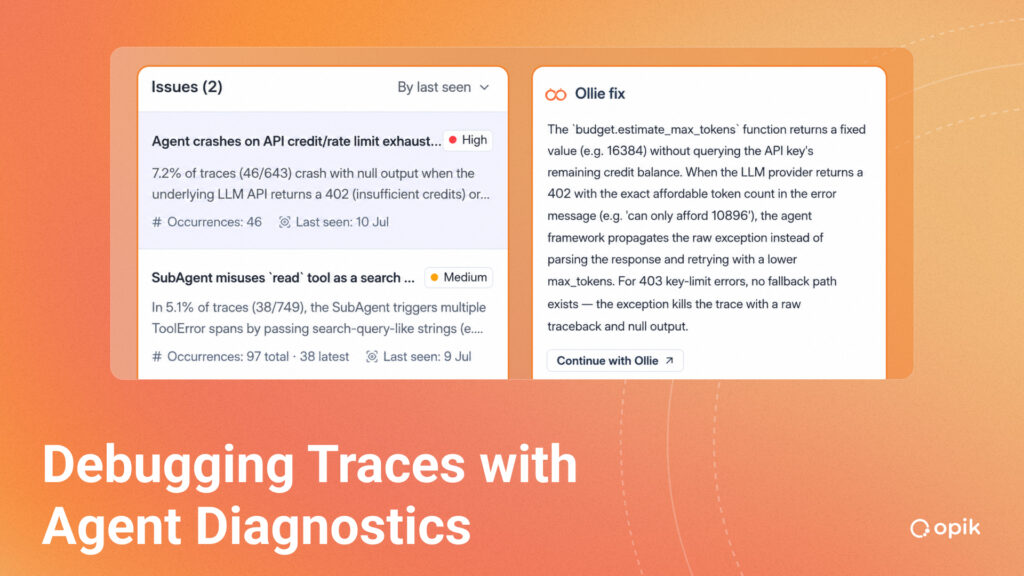
The combination worked better than we expected. The audit agent now delegates exploration to the ClickHouse sub-agent, narrows in on real patterns — repeated tool-call loops, retry storms with no strategy change, over-deliberation with no forward progress, cost or duration outliers driven by the agent’s own choices — and only reports a finding once it’s confirmed the issue affects a meaningful share of traces in the window, not just the one it happened to notice. Every finding carries a severity, a confidence level, and the trace-level evidence behind it, so a rare-but-corrupting issue doesn’t get buried under a common-but-harmless one.
It also remembers. Each run re-verifies previously reported issues against fresh data — confirming ones that persist, quietly dropping ones that have fallen below the threshold, and never re-surfacing an issue a user has already marked as expected behavior.
We’ve been running it against our own Ollie usage the whole time, and it’s already caught things about our own agent that we’d missed. If you’re the kind of team that’s been pasting trace JSON into an LLM by hand or running manual review sessions to find the same patterns to debug your own AI agents, this is built for you. We’re excited to get it into more people’s hands — and if it can help us find our own bugs, hopefully it’ll do the same for yours.
Try Debugging AI Agents with Opik Free
The new Diagnostics tool is built into the free cloud version of Opik, with a bank of free tokens for the Ollie agent pre-loaded, so you can try tracing and debugging your own production agent or LLM-powered application easily. Opik is designed to capture and organize all of the steps your agent takes when it runs, from user inputs to context retrieval, system prompts, tool calls, and more. From there, you have multiple tools available to test, evaluate, and monitor your agent’s behavior in both development and production, so you can surface silent errors, improve performance, and optimize cost. Try Opik free today.