Whether you’re tracing complex agent workflows, comparing prompt optimization runs, or building dashboards around the metrics that matter most, this month’s Opik updates give you clearer visibility into performance, cost, and quality across the AI development lifecycle. Highlights include the new Opik-OpenClaw plugin, new agent optimization features in the Optimization Studio, greater flexibility for creating custom dashboards, and expanded model and provider support. Read on for more details about each new release below.
OpenClaw x Opik
In case you missed it, opik_openclaw is now live, giving you native OpenClaw observability for your agents with Opik. OpenClaw agents can reason across tools, memory, and sub-agents. Still, without visibility into that workflow, you can often be left guessing why an agent failed, got confused, or became unexpectedly expensive to run. This plug-in provides insight into agent behavior in production by capturing LLM calls, tool execution, memory steps, and agent handoffs, while tracking token usage, costs, and output quality. It’s compatible with both Opik Cloud and self-hosted deployments and takes just minutes to set up.
Optimization Studio
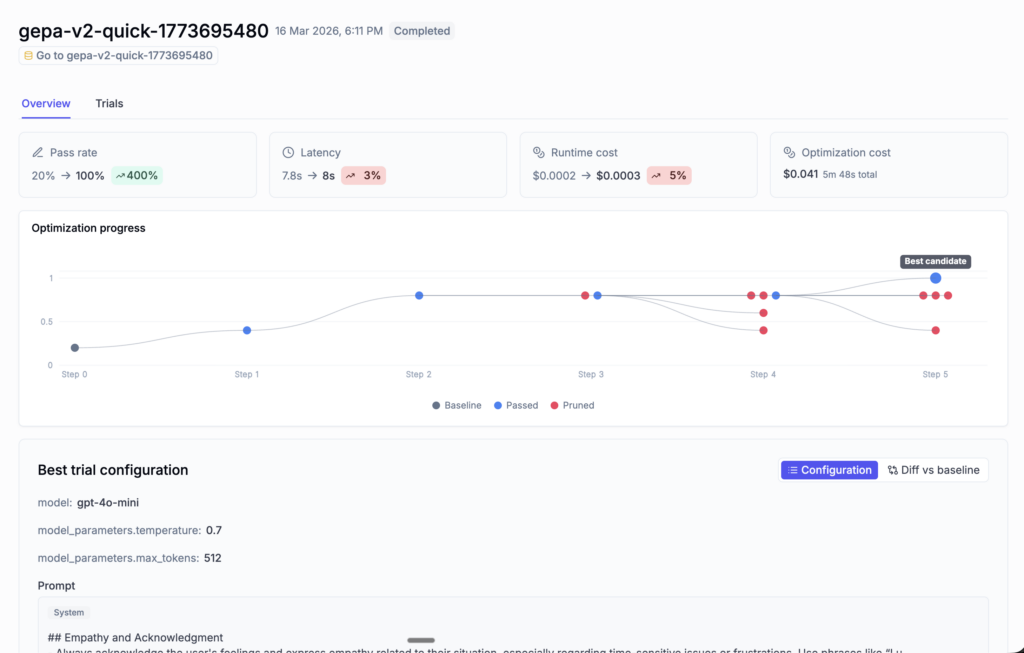
Opik’s Optimization Studio now gives you simpler ways to track, compare, and understand prompt optimization runs. The Optimization Studio can now help you quickly identify the strongest results using key metrics like accuracy, latency, and cost, and then let you dig into each run to see how the optimization progressed. At the trial level, detailed evaluation results and configuration diffs make it easier to understand what changed and why it improved performance, while maintaining a full audit trail from end to end.
Custom Dashboards
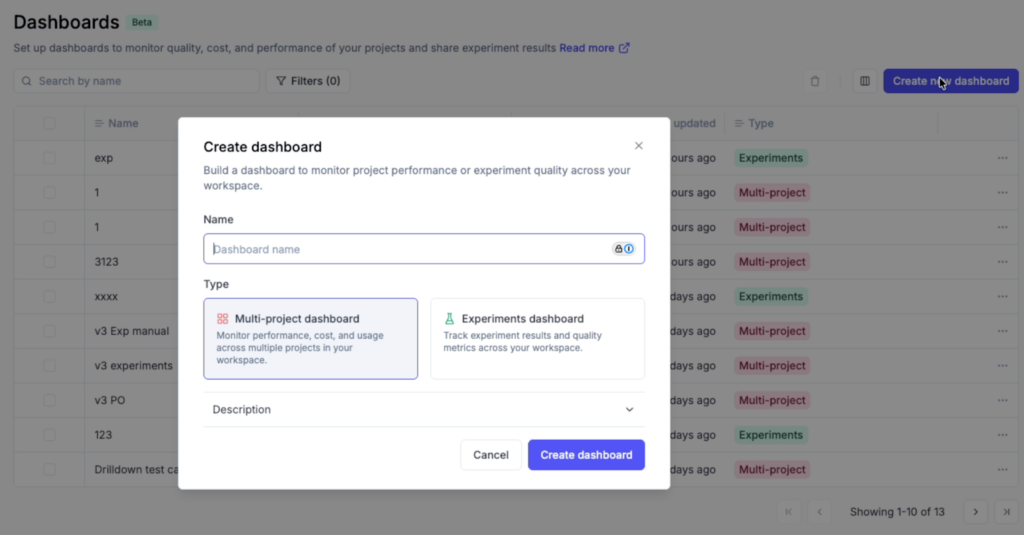
Opik’s custom dashboards allow you to turn project and experiment data into views that are actually useful for monitoring AI systems. Whether you need a production view for latency and cost or an experiment-specific view for comparing runs, you can now create multi-project and experiment-specific dashboards, choose a separate data source for each widget, and use built-in views like project overview and experiment comparison. Additionally, dashboards also now auto-save, so there’s no longer any need for a separate save/discard workflow.
Expanded Model & Provider Support
Several model and provider updates expand support across tracing, evaluation, and day-to-day development workflows.
- Gemini 3.1 support across the platform.
- Claude Sonnet 4.6 is now the default Anthropic model.
- OpenAI TTS tracing support.
- OpenAI-compatible providers for LLM-as-a-judge.
Additional Platform Feature Updates
Several usability improvements are now live across Opik:
- Dashboards now let you group failing traces by error type, making it easier to spot patterns and jump directly into the relevant traces.
- Full-text search is now available for traces, spans, and threads, so you can quickly find specific LLM interactions across projects.
- Cost tracking is now more accurate, with improved handling for trace metadata, model price lookups, and OpenTelemetry-based traces.
- URLs in datasets and experiments are now clickable directly from the table view.
Connect & Learn with Fellow AI Developers
Join us online and in person, connect with other AI builders, and grow your skills at our upcoming hackathons and community events.
- AI Engineer Europe – London, UK April 8-10
