Today, we’re excited to release version 2.0 of Kangas, our open-source platform for exploring, analyzing, and visualizing multi-media data. Whether your data lives in a .csv file or a pandas dataframe, with just a couple lines of code, you can quickly import your data into a Kangas DataGrid and start exploring.
To get started, you can install Kangas via pip.
pip install kangas
import kangas as kg

# Load an existing DataGrid

dg = kg.read_datagrid("https://github.com/caleb-kaiser/" +

                    "kangas_examples/raw/master/" +

                    "coco-500.datagrid.zip")

dg.show()
As part of our release of Kangas 2.0, we want to introduce some of the key features and design principles of Kangas.
1. Fast Rendering at Scale
Kangas is designed to generate robust, interactive visualizations over large multimedia datasets. The complexity of Kangas’ UI, and the need for it to run across environments, precluded us from building it on top of tools like Jupyter Widgets or Matplotlib.

Instead of building yet-another-Python-charting-library, we designed Kangas as a standalone web application, capable of processing and rendering thousands of cells of multimedia data quickly, interactively, and within many different environments.
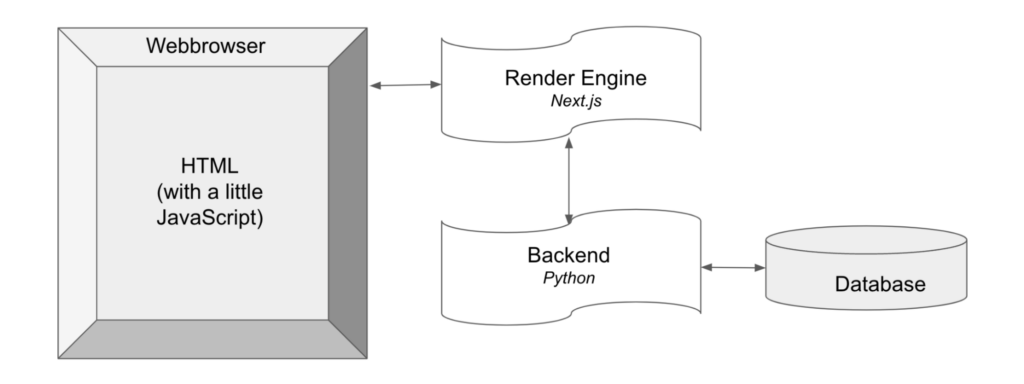
At a high level, Kangas has the following architecture. A Flask server stores DataGrids (which are SQLLite databases, under the hood) and serves queries. In front of this server sits a Node-based rendering engine, which generates the bulk of the frontend. Finally, a client-side React app syncs with the rendering engine, displaying the Kangas UI.

This architecture gives Kangas several critical benefits:
- A fully functional database and backend for querying data. No more in-memory limitations.
- A dedicated server for rendering the frontend. Data can be fetched in parallel, complex UI can be generated, and all of this can be done rapidly without straining the browser.
- The user’s environment–be it a notebook, dashboard, or a browser window–only has to display the rendering engine’s output. No more downloading huge application bundles.
Kangas’ design is made possible by a few new developments in web technology. Namely, Kangas is built on top of Next.js 13 using React Server Components, which has introduced a new paradigm for web applications, allowing us to move the most computationally expensive bits of rendering to the server and away from your browser.
2. A Interoperable Design for Model Debugging
One of our key design principles in Kangas is the belief that data scientists don’t need to learn yet another domain specific language. Every aspect of Kangas, including its UI, syntax, and integrations, have been designed to be as familiar as possible to an average data scientist.
For example, users can filter rows in a DataGrid using Pythonic syntax. On the backend, Kangas converts these Python commands to raw SQL. As an example, in the below animation you can see a Kangas filter being used on NLP data to find specific tokens of interest:

Here, we use a filter as well as the “Group By” button to figure out where our model is under-performing:

And of course, all of this can be done with Kangas running as a standalone application, or from within a Jupyter Notebook (here is a Colab notebook to demonstrate).

Finally, on the topic of interoperability, Kangas is designed to work with the platforms you already use for storing ML data. For example, Kangas can construct DataGrids from HuggingFace datasets, and can create HuggingFace datasets from DataGrids, using the kangas import and kangas export commands:
kangas import --huggingface detection-datasets/fashionpedia_4_categories \
    fashionpedia.datagrid --options split=val samples=10 \
    labels=objects:category bbox=objects:bbox:xyxy \
    ids=objects:bbox_id
Kangas also has a similar out-of-the-box integration with Comet. You can construct DataGrids directly from Comet Experiments like so:
kangas import --comet dsblank/coco-500 coco-500.datagrid

kangas server coco-500.datagrid
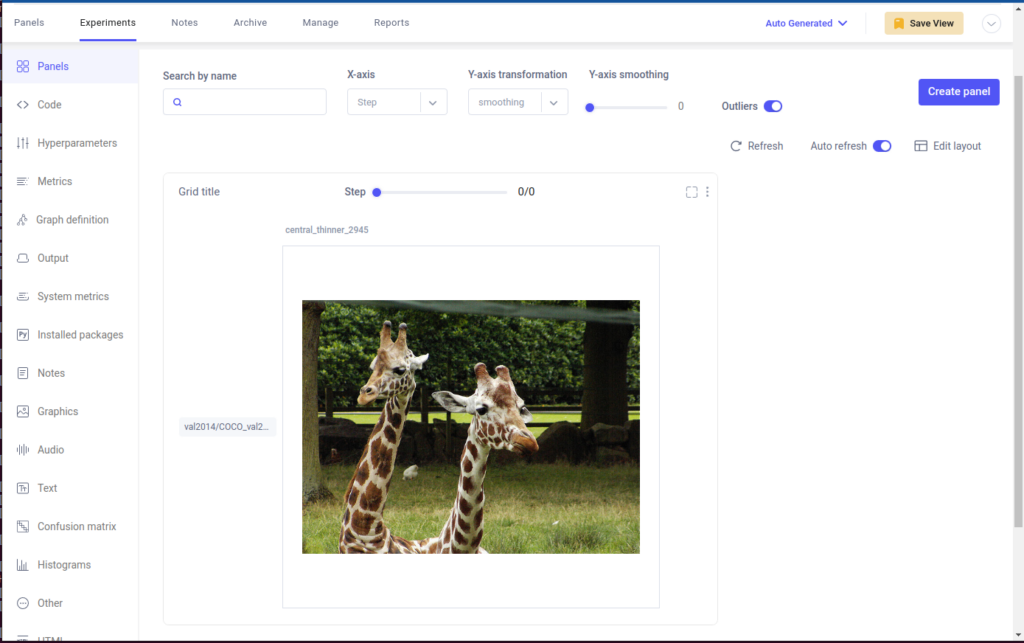
Which will take your Comet-logged assets:

And copy them into a DataGrid:

Whatever your current workflow or toolchain is, Kangas should be able to slot right in as a useful addition without any major refactoring.
3. A Robust, Customizable Interface
At every level, from the individual asset to the entire DataGrid, we want Kangas to be flexible enough to fit any data scientist’s needs. For example, Kangas supports a variety of methods for annotating images with bounding boxes, markers, lines, regions (areas defined by a set of points), and masks:
import kangas kg

image = kg.Image("photo.jpg")

image.add_bounding_box("cat", [x, y, w, h])
image.add_bounding_box("dog", [[x1, y1], [x2, y2]])
image.add_marker("this point", [x, y], shape="raindrop")
image.add_marker("see this", [x, y], shape="circle")
image.add_line("boundary", [[x1, y1], [x2, y2]])
image.add_region("person", [[x1, y1], [x2, y2], [x3, y3], ...])


image.add_mask({1: "dog", 2: "cat"}, mask)
image.add_mask_metric("attention", mask)
- image.add_bounding_box() – draws boxes, labels, and scores
- image.add_marker() – put a marker at a location
- image.add_line() – draws lines
- image.add_region() – draws polygon-based regions
- image.add_mask() – draws a mask where each identified pixel has a class name
- image.add_mask_metric() – draws a mask where each pixel has a value of a measurement (such as “attention”), and you can use matplotlib colormaps to create heatmap-style masks


We are also always adding more powerful built-in visualizations. For example, Kangas can automatically compute “Intersection Over Union” (IOU). In the following example, Kangas will examine the “Image” column, comparing all class identifications on layers “truth” and “prediction”, and create a column of visualization, and a value column containing the IOU value.
datagrid.append_iou_columns("Image", "truth", "prediction")
Here is a resulting IOU visualization showing what was predicted, the truth, and the intersection. The IOU value for this is 0.42145 and is saved in another column.

Zooming out to the broader DataGrid, the Kangas UI is also highly customizable. For example, you can resize the width of the columns of a DataGrid to your particular liking:

Or, you can use the Columns button to remove, rearrange, and re-add columns to your DataGrid.

In future releases, we’ll be adding even more customization options, including things like controlling the viewable rows per page (though, if you’re feeling sneaky, you can already customize this value by adding a “&rows=?” parameter to the url).
Want to try Kangas?
This post has just been a shallow overview, aimed at giving you a higher level introduction to Kangas. To dig deeper and experiment with Kangas, head over to our GitHub repository and get started with one of our Colab notebooks!
