Comet is an experimentation platform which permits you to track, monitor, and compare your Data Science experiments. So far, I have tested Comet using Python as a programming language. Recently, I have discovered that Comet also provides a plugin package for R and Java. This is very useful because you can continue to program using your preferred language and then track your experiments in Comet.
Comet provides an R package, named cometr, which permits you to create and manage an experiment object. You can install the package as follows:
install.packages("cometr")
For more details on the cometr package, you can refer to the Comet official documentation. To make your package work, you need to configure the KEY API, as described in the Comet official documentation.
In this article, I describe how to run your Comet experiments in R through a practical example. The article is organized as follows:
- Setup of the scenario
- Writing the experiments
- Comparing the experiments in Comet
Setup of the Scenario
As a use case, I will use the breast cancer dataset available on Kaggle under the CC0 public license. The idea is to build a classification task, which returns the diagnosis (benign/malignant), given some input features. We build two experiments and compare them in Comet. The first experiment uses a K-Nearest Neighbors classifier, the second one uses a decision tree classifier. I use the caret library to implement the two classifiers.
Firstly, I import all the required libraries:
library(cometr)
library(caret)
library(Metrics)
Then, I load the dataset:
df <- read.csv('../source/breast-cancer.csv')
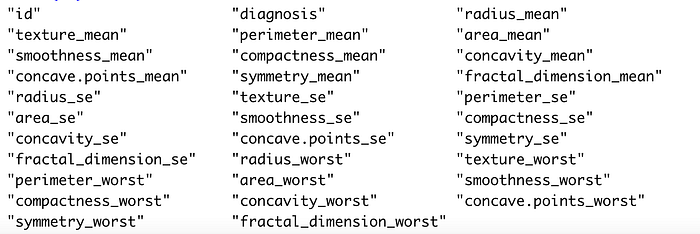
The dataset contains 569 rows and 32 columns. The target class is named diagnosis.
The following figure shows the list of columns available in the dataset:
Now, I encode the target class:
df$diagnosis <- as.factor(df$diagnosis)
I configure the seed, to make the experiment reproducible:
set.seed(30)
Most projects fail before they get to production. Check out our free ebook to learn how to implement an MLOps lifecycle to better monitor, train, and deploy your machine learning models to increase output and iteration.
Writing the Experiments
For each classifier, I create an experiment:
exp <- create_experiment()
I calculate an auxiliary variable, which stores the size of the dataset:
n <- dim(df)[1]
I train the classifier using different batch values, from 200 to the number of rows, and for each batch:
- I split the dataset into training and test (through the
createDataPartition()function). - I perform hyperparameter tuning by specifying the train control (through the
trainControl()function. - I train the model through the
train()function which receives as input the training set. - I test the model through the
predict()function which receives as input the test set. - I calculate the model accuracy.
- I track the accuracy in Comet through the
log_metric()method provided by the experiment class. - I add a tag that specifies the used classifier. I use the
add_tags()method provided by the experiment class.
The following code implements the previous steps:
for (i in seq(200, n+1, by=50)) {
    if(i > n)
      i = n
    dft <- df[c(1:i),]

    index <- createDataPartition(y = dft$diagnosis, times = 1, p = 0.8, list = FALSE)
    training_set <- dft[index,]
    test_set <- dft[-index,]
    trControl <- trainControl(method = "repeatedcv",number = 10,repeats = 10)
    model <- train(diagnosis ~ ., method=method, data = training_set, metric='Accuracy',
                   preProcess = c("center","scale"), trControl=trControl)

    test_set$pred <- predict(model, test_set)

    acc <- accuracy(test_set$diagnosis, test_set$pred)

    exp$log_metric("accuracy", acc, step=i)
    exp$add_tags(list(method))
I can wrap the previous code into a for loop to work with both the classifiers:
for (method in c('knn', 'rpart')){
  exp <- create_experiment()
  # previous for loop
  exp$stop()}
Note that to stop an experiment, I use the stop() method available for the experiment object.
Comparing the Experiments in Comet
I run the code in R and then I can check the results in Comet. The Comet dashboard looks like this:
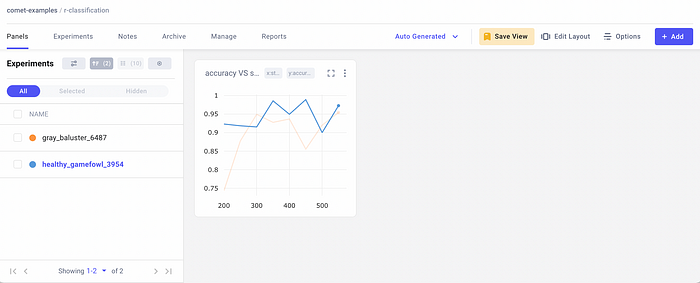
On the left, there are the two experiments, while on the right there is the chart showing the accuracy trend for the two experiments. To compare the two experiments, I select them on the left, and then I click the Diff button. I select the Metrics menu item on the left, as shown in the following figure:
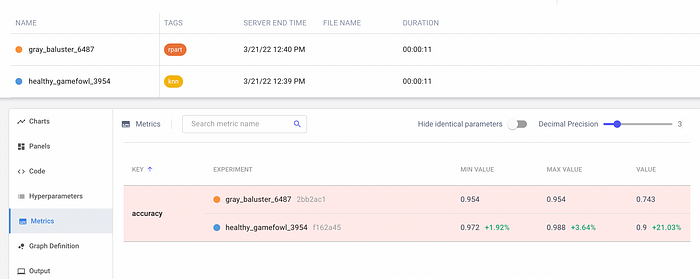
I note that KNN outperforms the Decision Tree algorithm.
Summary
Congratulations! You have just learned how to run your Comet experiments in R. The procedure is very simple: Firstly, you import the cometr package, then you create an experiment through the create_experiment() function. After, you log your metrics or objects, and, finally, you stop your experiment through the stop() method.
Once you run your experiment, you can check the results in Comet. This is very useful!
You can download the code of this article from my Github repository, and you can see the live experiment directly in Comet at this link.
Happy coding! Happy Comet!