For AI agents: a documentation index is available at the root level at /llms.txt and /llms-full.txt. Append /llms.txt to any URL for a page-level index, or .md for the markdown version of any page.
Copy to LLMGithubGo to App
DocumentationIntegrationsBuilding Self-Improving AgentsSelf-hosting OpikSDK & API reference
    • Overview
  • TypeScript
    • Opik TypeScript SDK
  • Python
    • Opik Python SDK
    • OpenTelemetry Python SDK
  • Java
    • Spring AI
    • Quarkus LangChain4j
  • .NET
  • Ruby
    • OpenTelemetry Ruby SDK
  • No-Code
    • Cursor
    • Dify
    • Flowise
    • Langflow
    • n8n
    • OpenClaw
    • OpenAI Codex
    • OpenWebUI
    • Prompt Flow
  • Multi-Language
    • OpenTelemetry
LogoLogo
Copy to LLMGithubGo to App
On this page
  • Setup Instructions
  • How to View Your Traces
No-Code

Observability for Dify with Opik

Was this page helpful?
Previous

Observability for Flowise with Opik

Next
Built with

Learn how to connect Opik with Dify to monitor your applications’ performance.
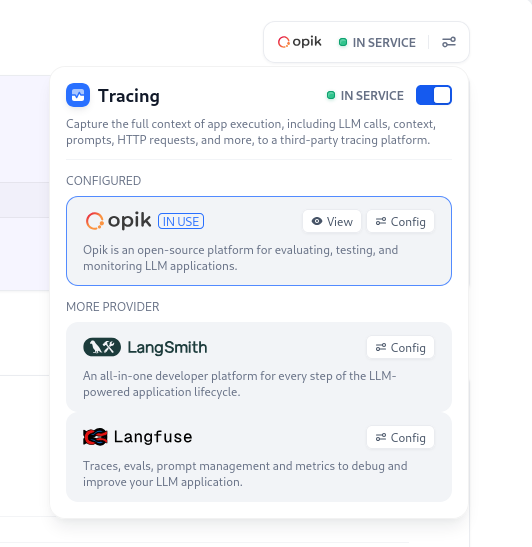
Setup Instructions

Follow these simple steps to connect Dify with Opik:

  1. Select the Dify app you want to monitor
  2. Select Monitoring from the side menu
  3. Click on Tracing app performance
  4. Click on Configure for Opik
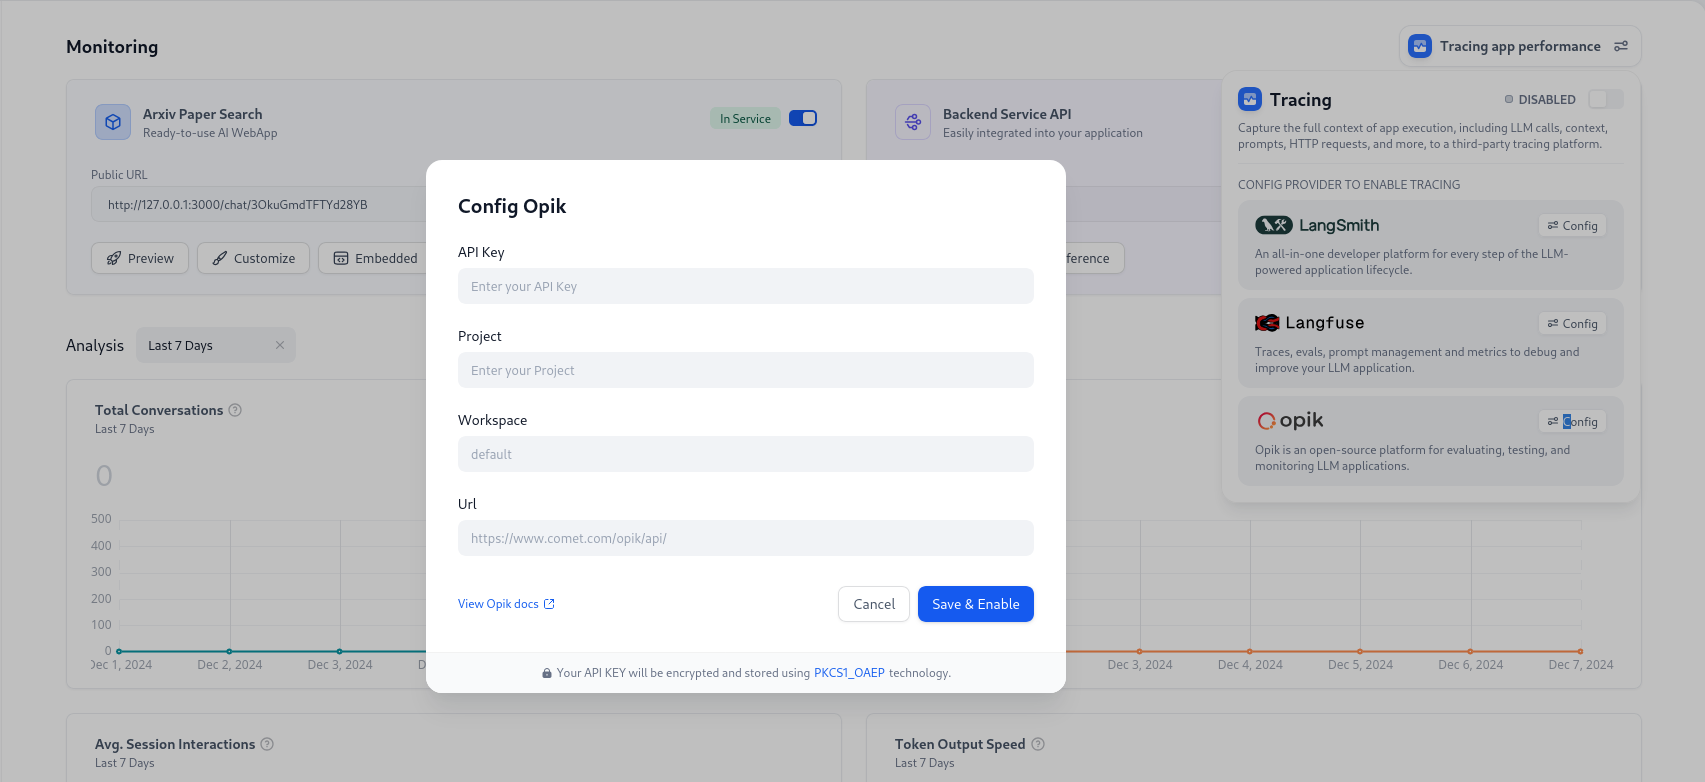
  5. Enter your connection details based on your Opik version:
Hosted Opik
Self-Hosted Opik

Fill in these fields:

  • API Key: Your Comet API Key
  • Project: Your preferred project name (if left empty, it will be created automatically)
  • Workspace: Your Comet Workspace name (must already exist)
  • URL: Your Opik installation URL (make sure it ends with /api/)

How to View Your Traces

After setup, you can view your application traces by:

  1. Opening the Monitoring section from the side menu
  2. Finding and clicking the OPIK button in the top-right corner
  3. Selecting View to open your Opik project dashboard