Multi-Metric Optimization
When optimizing AI agents, you often need to balance multiple quality dimensions simultaneously. Multi-metric optimization allows you to combine several evaluation metrics with customizable weights to create a composite objective function.
Why Use Multi-Metric Optimization?
While you can implement metric combinations within a custom metric function, using Opik Optimizer’s MultiMetricObjective API provides additional benefits:
- Automatic logging of all component metrics to the Opik platform
- Individual tracking of each sub-metric alongside the composite score
- Detailed visibility into how each metric contributes to optimization
- Trial-level insights for both aggregate and individual trace performance
This visibility helps you understand trade-offs between different quality dimensions during optimization.
Basic Setup
In this guide, we’ll use the HotPot QA dataset to demonstrate multi-metric optimization. The example optimizes a question-answering agent that uses Wikipedia search to balance both accuracy and relevance.
To use multi-metric optimization, you need to:
- Define multiple metric functions
- Create a
MultiMetricObjectiveclass instance using your functions and weights - Pass it to your optimizer as the metric to optimize for
Step 1: Define Your Metrics
Create individual metric functions that evaluate different aspects of your agent’s output:
Step 2: Create a Multi-Metric Objective
Combine your metrics with weights using MultiMetricObjective:
Understanding Weights:
The weights parameter controls the relative importance of each metric:
weights=[0.4, 0.6]→ First metric contributes 40%, second contributes 60%- Higher weights emphasize those metrics during optimization
- Weights don’t need to sum to 1—use any values that represent your priorities
Step 3: Use with Optimizer
Pass the multi-metric objective to your optimizer:
Complete Example
Here’s a full working example using multi-metric optimization for a question-answering task with tool usage:
Viewing Results
When you run multi-metric optimization, Opik tracks and displays both the composite metric and individual sub-metrics throughout the optimization process.
Progress Chart
The optimization progress chart shows how your composite metric and individual metrics evolve over trials:

What you’ll see:
- Composite metric (
my_composite_metric) — The weighted combination of all metrics - Individual metrics (
levenshtein_ratio,answer_relevance_score) — Each component tracked separately - Trial progression — Metric evolution over time
This lets you see not just overall optimization progress, but how each metric contributes to the final score.
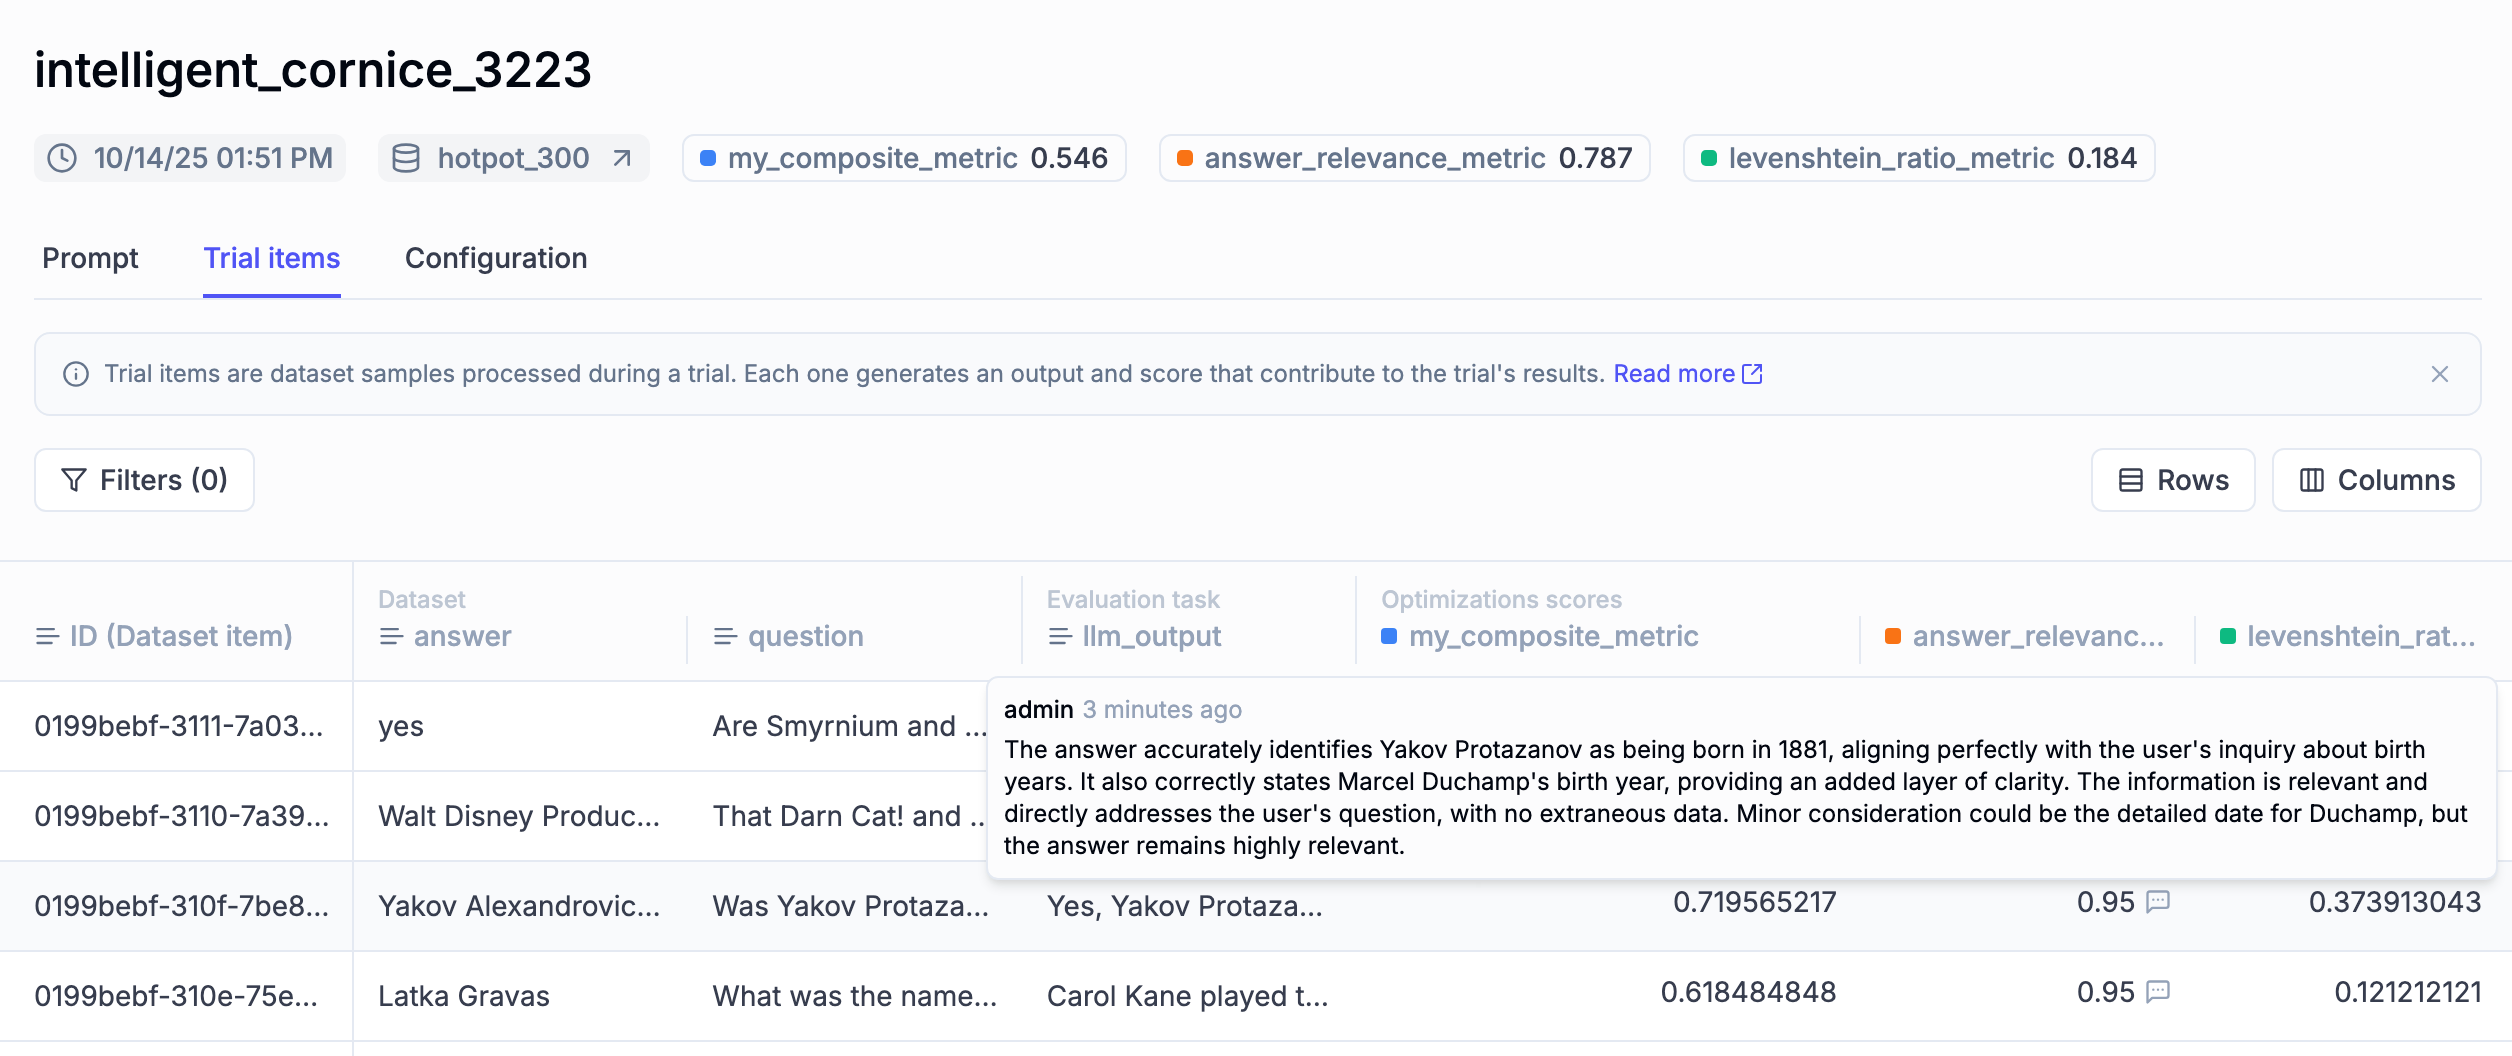
Trial Items View
View individual trial items with detailed metric breakdowns:

What you’ll see:
- Composite metric score for each trial
- Individual scores for each component metric
- Performance comparison across different prompts
Insights you’ll gain:
- Which metrics are improving or degrading
- Trade-offs between different quality dimensions
- Whether your weight balance is appropriate
Next Steps
- Explore available evaluation metrics
- Understand optimization strategies

