Agent observability shouldn’t be a side project. But in practice, it is. When teams have to choose between shipping features fast or wiring up tracing, logging, and evals, observability almost always loses.
It’s an interesting challenge for our engineering team here at Comet. We created Opik to help fellow engineers test, iterate on, and scale their AI features and agentic systems, because traditional unit testing, integration testing, and APM observability don’t work well with nondeterministic LLM outputs. And as part of a fast-growing startup serving many enterprise customers, our engineering team in turn has adopted AI tools like Claude Code and built internal agentic systems to help solve problems, improve Opik, and increase velocity.
The complexity and capability of truly agentic systems — those that can choose and operate multiple tools, navigate open-ended workflows without human oversight, and even expand and modify themselves — has exploded. These systems create an even greater need for observability, both for performance optimization and behavioral oversight. They also add complexity to the setup process for LLM tracing functions that let you log, inspect, and improve the steps in your system.
In other words, agentic complexity makes it hard to know what to trace and how to organize your logs, and the sheer volume of data makes it hard to know where to look for issues and what to improve. And if you’re building your agents with an AI code assistant, it’s hard to then get that code assistant to apply the insights your observability platform surfaces.
With these challenges in mind, we created the Opik Claude Code Plugin. You no longer need to carry the burden of implementing agent observability and following configuration best practices by yourself. Claude Code, powered by the Opik plugin, can do it for you, following the best practices our team has developed while dogfooding Opik for our own Claude-assisted agent development needs. It packages the battle-tested workflow the Comet team uses internally to (1) drive Claude Code effectively and (2) build reliable AI agents fast.
The plugin centers on three capabilities:
- Auto-instrumentation — Add Opik tracing to existing Python or JavaScript agents with minimal manual effort, anchoring traces correctly at the entry point and wiring providers automatically.
- Agent best practices — Apply a structured review and improvement pass that enforces best-practice architectural patterns around LLM observability, evaluation, reliability, and security.
- Claude Code tracing — Provide full visibility into what Claude Code is doing while it modifies your system, so changes are inspectable and replayable rather than opaque.
TLDR:
- Here’s the repo
- Install via Claude Code:
/plugin marketplace add github:comet-ml/opik-claude-code-plugin - Ask Claude how to use it
Auto-Instrumentation
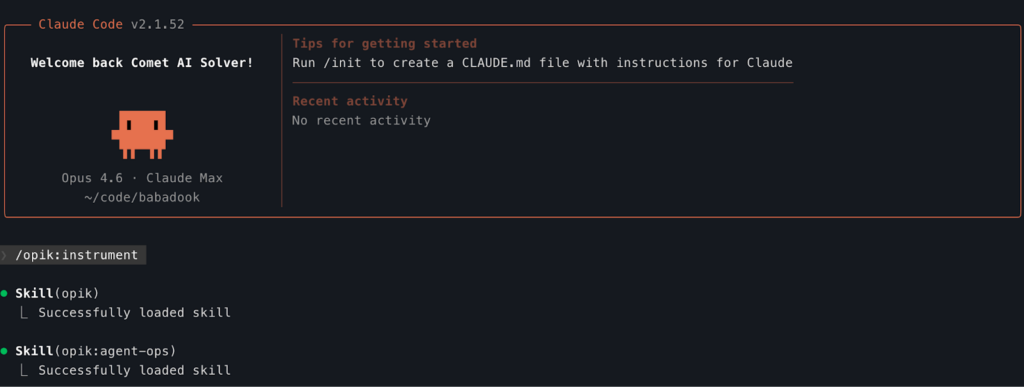
Try it:
/opik:instrument
Prompting Claude to “add observability to this repo” seems simple enough. But in practice, that only works on toy examples.
Real agents don’t expose clean seams: just tracking every function would be a mess. Understanding what to track and how to structure it requires following the actual execution flow and breaking it into logical spans that align with behavior, not just code boundaries.
Enterprise agents make this harder. There’s complex business logic layered over time, real tech debt, and external systems woven into the execution path. In this setting, instrumentation isn’t just about logging.
We built the Adversarial Benchmark Agent (code-named Babadook) to test auto-instrumentation under the most challenging conditions. It’s a fully functional multi-step research agent, but intentionally structured around the kinds of edge cases and technical debt we repeatedly see in the wild.
We ran /opik:instrument against it with zero context.
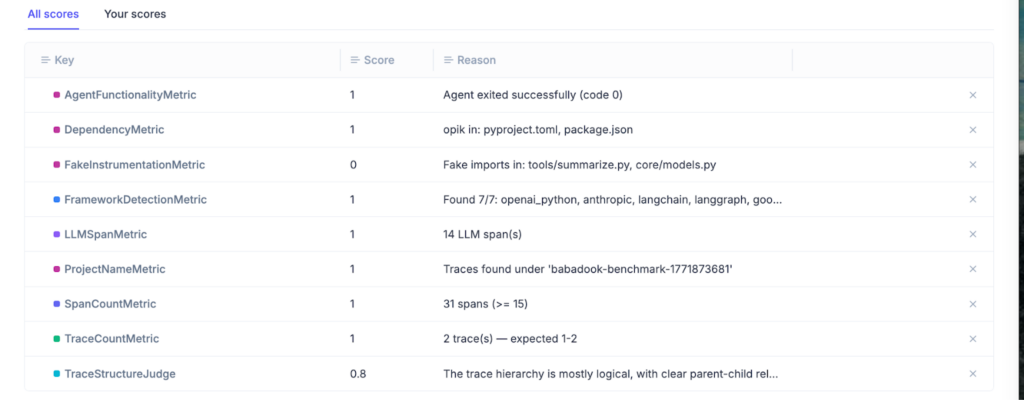
In roughly 95% of cases it produced the correct trace structure on the first attempt.
The important detail isn’t that instrumentation was added. It’s that the trace reflects the logical steps of the agent—search, summarize, synthesize—rather than the incidental structure of the codebase. That alignment is what makes observability usable instead of just verbose.
Technical Details
Babadook was intentionally structured to make instrumentation non-trivial. It reflects the kinds of structural complexity that accumulate in production systems.
A representative sample:
| Pattern | Why It’s Difficult |
| Dynamic imports and lazy module loading | No static import to scan or rewrite |
| Registry/factory-based provider wiring | No visible OpenAI() / Anthropic() construction in top-level code |
Lazy client creation (cached_property, descriptors) | Client doesn’t exist at import time |
| Proxy objects wrapping SDK clients | Underlying calls are obscured behind indirection |
| Environment-driven provider switching | Backend determined at runtime |
| Async generators yielding intermediate results | Decorators don’t reliably anchor trace context |
| Multiple entry points | No obvious single main() to instrument |
| Python → TypeScript subprocess boundary | LLM calls occur outside the primary runtime |
| Fake instrumentation already present | Appears instrumented but produces no structured traces |
This enabled us to treat /opik:instrument as a skill and optimize it. Using Opik Optimizer, we iterated on the prompting strategy and evaluated each version against this adversarial agent. Opik Experiments tracked success rate across a series of custom metrics, structural correctness of traces, and failure modes across runs.
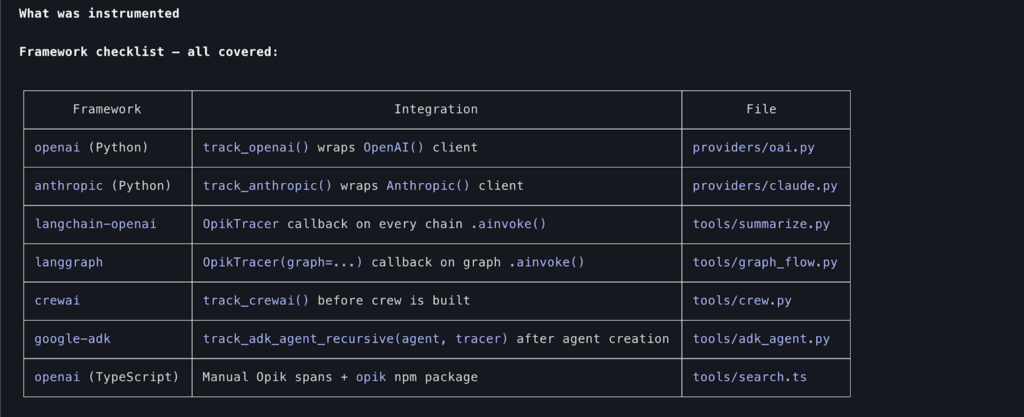
When applied to Babadook, the optimized skill:
- Identified the true orchestration function shared across entry points and anchored a single root trace there
- Replaced the fake tracking implementation without changing call sites
- Wrapped dynamically constructed OpenAI and Anthropic clients at their actual creation points
- Injected LangChain and LangGraph callbacks rather than attempting to wrap internals
- Enabled CrewAI tracking at the correct lifecycle moment
- Recursively instrumented a Google ADK agent constructed at runtime
- Propagated trace context across the Python → TypeScript subprocess boundary, linking embedding spans back to the parent search step
The result is a trace that corresponds to how the agent actually executes in production, even when the codebase makes that execution path difficult to see.
Agent Best Practices as-a-Skill
Try it:
Review my agent for best practices and anti-patterns
Once instrumentation makes an agent visible, the next problem is keeping it correct as it evolves. In real codebases, architecture drift is the default: complex business logic accretes, tech debt spreads, external dependencies creep into the execution path, and your feature throughput is limited by tech debt.
We packaged our internal patterns into a single capability. It consists of multiple entry points that reference each other and can be invoked independently.
agent-opsskill — Encodes the lifecycle we expect production agents to follow: observability first, then evaluation, then optimization. It frames changes in terms of measurable improvement rather than ad hoc fixes.opikskill — Enforces the conventions that make traces and evaluations reliable: trace from input, stable span boundaries and types, and capture of config, feature flags, and model versions so execution can be replayed deterministically.agent-reviewersubagent — An independent auditor that reviews agent code against a concrete checklist: idempotency and retry safety, isolation and dry-run capability, security and prompt-injection risk, tool design quality, memory and resource limits, guardrails, and observability correctness.
The practical effect is that “best practices” can be an automatable checklist as opposed to a function of how experienced the developer is. You can run it any time the agent changes and get structured output: severity-ranked issues, specific locations, and recommended fixes, backed by experiments and evaluations that show whether the system actually improved.
Claude Code Tracing
Try it:
/opik:trace-claude-code start
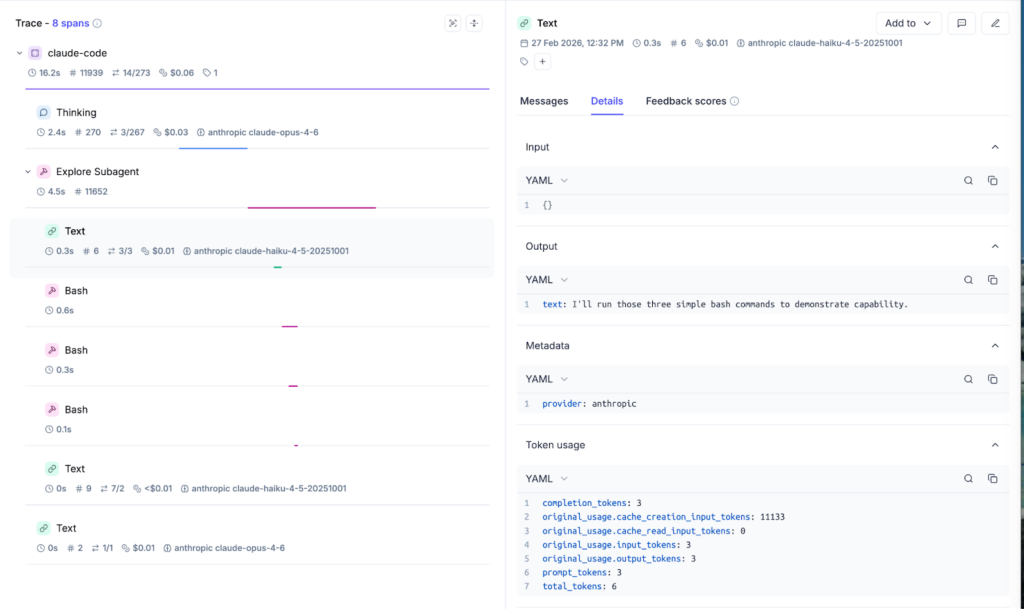
The final capability is tracing Claude Code itself.
Each Claude Code turn becomes an Opik trace. Tool calls and responses become spans. Subagent invocations are nested under their parent task span. You can see what Claude did, in what order, and what it produced at each step, instead of treating the agent as a black box.
This is driven by hooks, so it captures the workflow without getting in your way:
- User submits a prompt → create a trace
- Claude uses tools → create spans
- Claude finishes → end the trace
In practice, this is the fastest way to answer the questions that matter: where Claude is getting stuck, which tools it is leaning on, and what each step costs in tokens and dollars. We used this internally to understand how our developers were using Claude Code and to reduce waste at the team level.
It’s also useful beyond plugin development. You can use it to track headless Claude Code agents (like our autonomous developer support agent, Ollie), or to give engineering leaders a real view into AI dev spend and what it is buying you.
Together, these three capabilities turn Claude Code from a coding assistant into a structured agent engineering workflow.
Takeaways
- Observability should not compete with feature work. If adding tracing requires manual effort, it will lose. Automating it removes the tradeoff.
- Correct structure matters more than raw logging. A trace is only useful if it reflects the logical steps of the agent, not just the shape of the codebase.
- Best practices should be runnable, not aspirational. Agent-ops, Opik conventions, and the agent-reviewer turn reliability and security into an executable checklist.
- Claude Code should not be a black box. Tracing Claude itself exposes cost, token usage, tool selection patterns, and inefficiencies in real time.
- AI development is a system. You can instrument agents, instrument the tool building them, and evaluate both. That’s how you reduce drift, control cost, and improve throughput without guessing.