OpenClaw is all the rage, but users want telemetry, observability, and peace of mind to better understand the inner workings of their autonomous personal AI agents.
The Claw?
OpenClaw is the fastest-growing open-source project in history with over 250k GitHub stars, a passionate developer community, and people doing genuinely wild things with their personal AI agents. But talk to anyone running OpenClaw agents in any serious capacity, and you’ll hear the same thing: Where are my tokens going?
The OpenClaw Observability Gap Is Real
OpenClaw is incredibly powerful. It connects LLMs to your tools, files, messaging apps, and the broader internet that runs 24/7. It can run apps, browse the web, manage your calendar, and chain complex multi-step tasks all autonomously as a self-optimizing agent. The problem is that all of this happens inside a loop you can’t easily see into.
Every time your agent reasons about a task, it’s assembling a context window from system instructions, conversation history, tool schemas, skills, and memory. It’s making LLM calls. It’s executing tools. It’s delegating to sub-agents. And unless you have visibility into that pipeline, you’re left guessing why a task failed, why your API bill just doubled, or why the agent got confused halfway through a workflow. It works for a weekend project, but when you want the reliability of an enterprise solution, this is where a gap emerges.
Introducing opik-openclaw for Native OpenClaw Observability
Today, we’re releasing opik-openclaw, a native OpenClaw plugin that gives you full-stack observability for your agents, powered by Opik.
This isn’t another vibe-coded community script. Opik is an Apache 2.0 open-source platform trusted by thousands of developers, built by the team at Comet, and designed specifically for tracing, evaluating, and monitoring LLM applications in production. With opik-openclaw, that entire platform now plugs directly into OpenClaw’s plugin architecture with no hacks and no guesswork.
What You Get
- Full trace capture for every agent interaction.
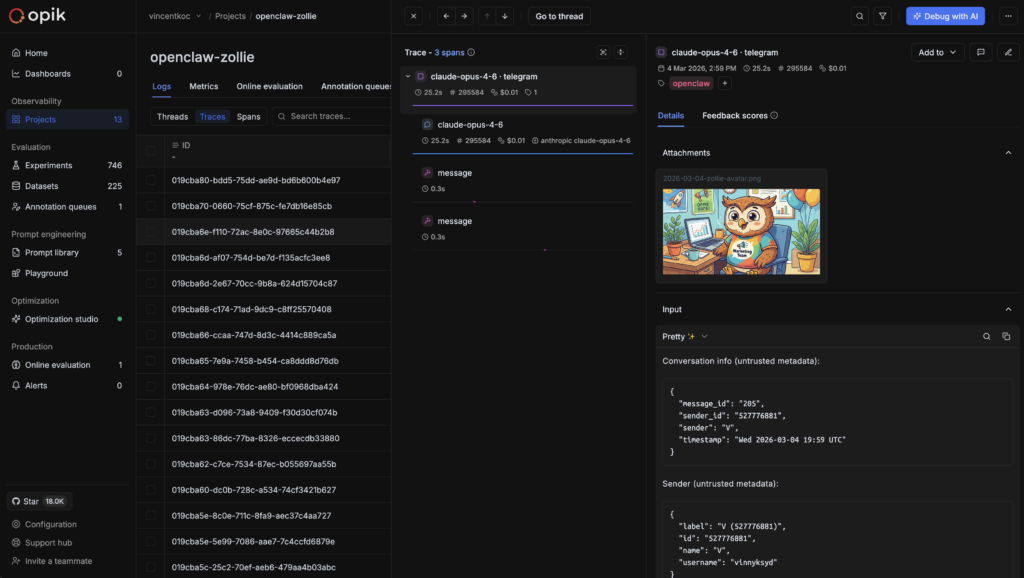
Every LLM call, tool execution, memory recall, context assembly, and agent delegation is logged with complete input/output pairs, token counts, latency, and cost. You don’t just see that a call happened; you see exactly what the model received, what it returned, and how long it took. - End-to-end conversation threading.
OpenClaw agents maintain state across sessions, channels, and heartbeat cycles. Opik captures the full conversation flow so you can trace a request from the initial message through multi-step reasoning, tool calls, and the final response, even when the agent chains across sub-agents or picks up work from a scheduled heartbeat. - Real cost visibility.
One of the most common pain points in the community is mystery token spend. OpenClaw assembles large prompts from system instructions, history, tool schemas, skills, and memory. That context load adds up fast, especially with frontier models. Opik gives you per-request, per-model cost breakdowns so you can see exactly where tokens are going and optimize accordingly. - Automated evaluation with LLM-as-a-judge.
This is where Opik goes beyond what any dashboard or logging tool can do. You can set up LLM-as-a-judge evaluation metrics such as hallucination detection, answer relevance, and context precision that run automatically on your traces. Opik scores new interactions against your criteria, catching quality issues without manual review.
Get Started in Two Minutes
openclaw plugins install @opik/opik-openclawRun the interactive setup to drop in your API key (or point to a self-hosted Opik instance):
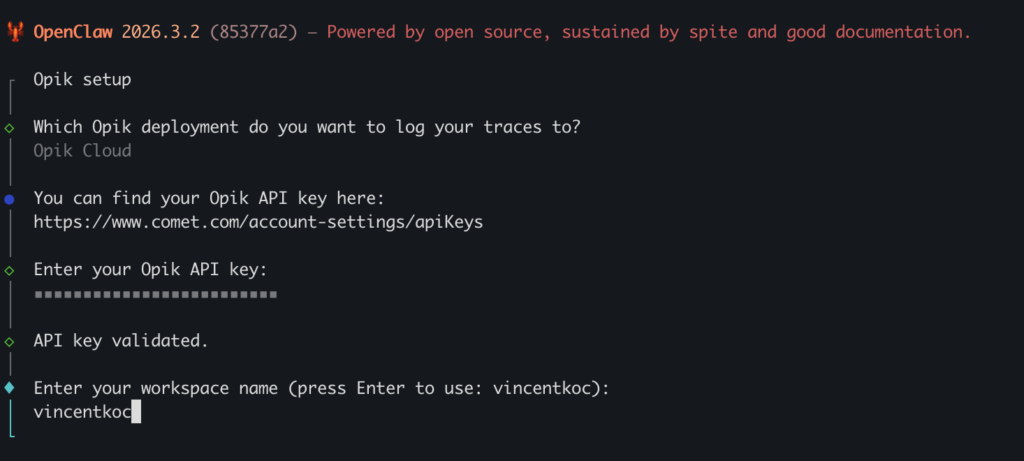
openclaw opik configureVerify everything is wired up:
openclaw opik statusThen restart your gateway to activate the plugin:
openclaw gateway restartThat’s it — no manual JSON editing required. Open your Opik dashboard and you’ll see traces flowing in from your next agent interaction.
For self-hosted Opik users, the setup is just as simple: point the plugin at your local instance and you’ll have full observability running entirely on your own infrastructure. No data leaves your machine.
Why Native OpenClaw Observability Beats Bolted-On
There’s a fundamental difference between a native integration built against OpenClaw’s plugin SDK and a proxy-based approach that intercepts traffic at the network layer. A native plugin hooks into the gateway’s lifecycle. It captures context that a network proxy never sees: which skill was loaded, what memory was recalled, how the agent routed between sub-agents, and what the heartbeat scheduler decided to act on. It traces the full depth of the agent’s reasoning, not just the API calls that happen to cross a network boundary.
And because opik-openclaw ships as a standard OpenClaw plugin, it follows all the conventions you’d expect: install via openclaw plugins install, configure in your openclaw.json, enable or disable without touching your agent’s code. No middleware. No sidecar processes. No fragile proxy chains.
What’s Next
The npm plugin is available today, and we will also adopt OpenTelemetry infrastructure as a standards-based path to the same observability as it is supported by OpenClaw. Stay tuned for our product updates and webinars for more info.
Get started:
- Install the plugin:
openclaw plugins install @opik/opik-openclaw - Opik GitHub repo
- Opik documentation
- OpenClaw plugin docs
Opik is open-source under the Apache 2.0 license. Self-host it, run it in the cloud, or try it free at comet.com.
