I’ve been spending time looking at how teams are actually using Claude Code, and one thing keeps coming up: most of the cost surprises aren’t coming from where people expect.
The instinct is to look at conversation history — keep prompts tight, avoid long threads, or explore smaller models. That’s not wrong, but it’s often not where most of the money is going. A lot of the overhead is loading before you type anything.
The Session Startup Problem
Claude Code and similar tools have gotten better at handling this with caps on individual MCP server and tool definition sizes mean the harness does a lot of the heavy lifting that used to fall entirely on the developer.
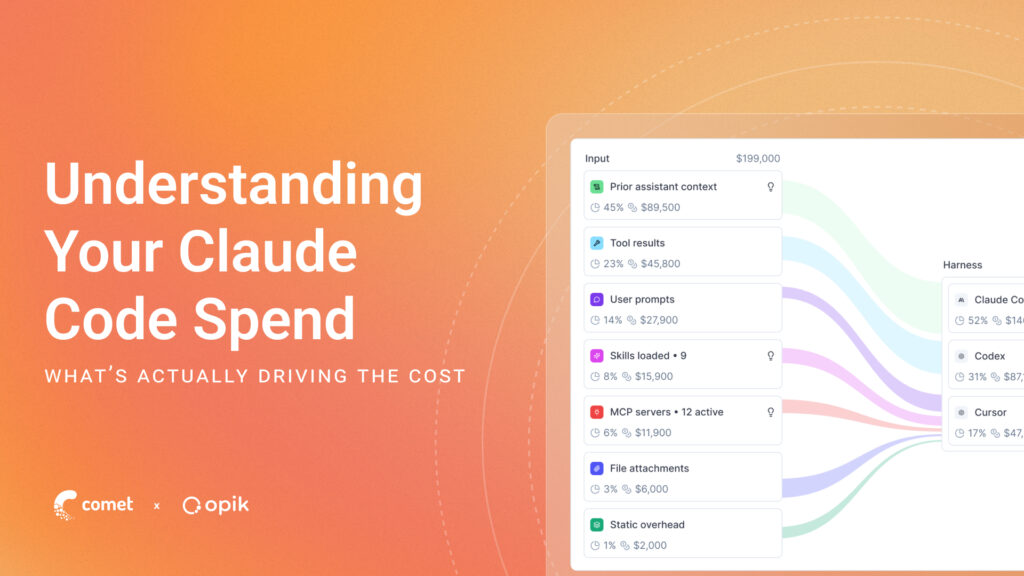
But the sheer volume of things being loaded is still the issue. MCP servers, memory files, skills, sub-agents, background context all adds up at session start, before any actual work begins. And for most teams, nobody has a clear picture of what’s being loaded across the org, which developers have the most accumulated overhead, or whether a lighter model might do the job just as well for a given task type.
That’s where the cost variance lives. Not in any single item, but in the accumulated weight of everything that’s been connected and never revisited, and the model defaults that nobody has questioned since the initial setup.
Context Accumulation
MCPs get added one at a time, usually for good reasons. A developer connects something for a project, the project wraps up, the connection stays. Someone else adds a few more. Nobody runs a cleanup. The context window gets heavier in ways that are invisible unless you’re specifically looking for it.
One developer who actually sat down and audited their setup found 46 disabled plugins still registered and contributing to session overhead. That’s an extreme case, but the direction is pretty common.
Model selection has a similar dynamic. Most teams run the same model across everything by default — quick formatting tasks and complex architecture decisions, same model. Opus is roughly 5x the cost of Sonnet per input token. For a lot of tasks, Sonnet does the work just as well. But if the default is Opus and nobody’s looked at it, that’s the bill you get.
What the Built-In Tools Don’t Show You
/context at the end of a session gives you the session total. The Anthropic console gives you aggregate spend. Neither breaks down which developer is spending what, which project is driving a spike, which specific MCP in which developer’s config is adding overhead, or whether the default model across your team is the right call for what your team actually does.
Worth noting: /context has some known calculation bugs. It doesn’t always return accurate token counts and misses tokens in certain cases, so even at the individual level the numbers aren’t always reliable.
That’s not a gap in Claude Code, it’s just not what those tools are designed for. They’re designed for individual developer visibility. The org-level picture is a different problem.
What We Built: Cost Intelligence
We’ve been working on this problem in Opik. The basic idea: give teams the same kind of breakdown at the org level that /context gives you at the session level.
Real-time spend per developer and per team, so you’re not waiting for month-end to know something is running hot. A detailed breakdown of where tokens are actually going — tool calls, MCPs, skills, model types — so you can see what’s driving the number rather than just what the number is. And org-wide configuration defaults, so teams can standardize things like model selection and MCP hygiene across all developers rather than leaving it as individual configuration.
The automatic optimization piece is the part I find most interesting: Opik looks at your actual usage patterns and suggests configuration changes. The teams using it are seeing 10–40% reduction in spend without changing how developers work. That range is wide because setups vary a lot — but the ones with the most accumulated MCP bloat tend to see the biggest impact, which makes sense.
One More Thing Worth Knowing
The MCP context bloat problem is getting better at the protocol level. Anthropic shipped lazy loading for tool schemas as an opt-in feature, and tool search at GA is already showing significant reductions for compatible clients. Those are real improvements and they help.
What they don’t solve is the organizational visibility problem — which developers have accumulated the most overhead, what the default model is across your team, which configurations are driving cost variance. That’s what we’ve been focused on.
If you haven’t looked at what’s actually loading into context by default across your team, it’s worth checking. The numbers are usually more interesting than people expect.