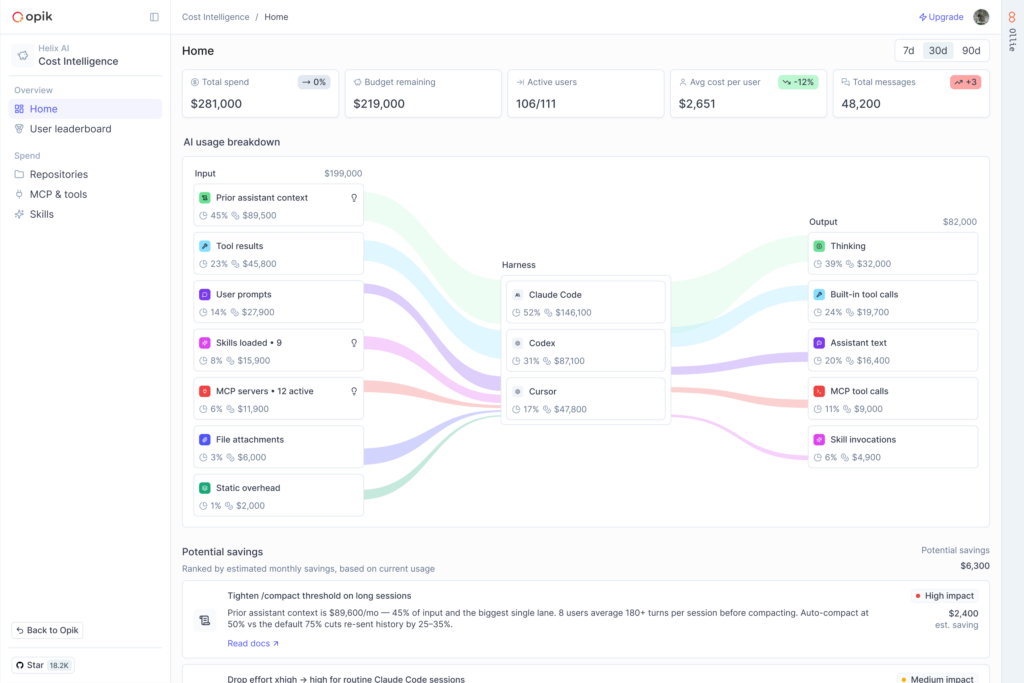
AI budgets are no longer growing unchecked. Across the industry, engineering teams are being asked to do more with less, forcing organizations to answer a difficult question: How do you reduce AI spend without slowing down your developers?
The obvious answer, limiting token usage, rarely works. Engineers still need the best models and enough context to build competitive AI products, and blunt limits often become a tax on productivity rather than a meaningful cost-saving measure. The result is that many companies are spending at “token-maxing” levels without a clear understanding of where those costs originate or which optimizations will actually move the needle.
Internal Optimizations, Reusable Best Practices
Earlier this year, our team at Comet navigated this challenge in two distinct but related ways. First, as we added layers of functionality to Opik — which our customers’ engineering teams use to log, debug, and optimize their own AI-powered products — we needed to make sure Opik itself wasn’t consuming unnecessary tokens. Second, we needed to optimize our own usage of Claude Code tokens for our internal engineering work.
These two initiatives in tandem led to the development of our latest product, Cost Intelligence. Cost Intelligence evolved from internal tool we built to understand our own AI spending into an enterprise platform that is already helping customers reduce AI costs by 10–40% without sacrificing performance.
More importantly, the visibility it provided fundamentally changed how we build AI systems ourselves, influencing everything from model selection to rebuilding our external MCP from the ground up. In this post, we’ll share the lessons we learned and how understanding AI costs can lead to better engineering decisions, not just lower bills.
The First Challenge: Rebuilding Opik’s MCP Server
We shipped our local MCP server within days of the MCP ecosystem taking off. We installed it ourselves, our customers installed it, and then for the most part we stopped thinking about it.
That changed when we started measuring cost.
Cost Intelligence gave us something we had never really looked at before: the relationship between what our MCP cost to operate and how people actually used it. The results were eye opening.
We were spending thousands of dollars a year serving our MCP while seeing only around a hundred tool calls per month. Even worse, many of the tools we faithfully shipped to every developer were never used at all. Every unused tool increased the prompt size for every LLM request, every day, without providing any value in return.
For example, the following tool schema wasn’t invoked a single time over the previous three months — even though it had been sent to language models millions of times.
{
  "name": "add-trace-feedback",
  "description": "Attach one or more feedback scores to a trace.",
  "inputSchema": {
    "type": "object",
    "properties": {
      "traceId": {
        "type": "string",
        "minLength": 1,
        "description": "Target trace ID."
      },
      "scores": {
        "type": "array",
        "minItems": 1,
        "description": "One or more feedback scores to attach to the trace.",
        "items": {
          "type": "object",
          "properties": {
            "name": {
              "type": "string",
              "minLength": 1,
              "description": "Feedback metric name, e.g. relevance, accuracy, helpfulness."
            },
            "value": {
              "type": "number",
              "description": "Numeric score value."
            },
            "reason": {
              "type": "string",
              "description": "Optional reason for this score."
            },
            "source": {
              "type": "string",
              "enum": ["ui", "sdk", "online_scoring"],
              "default": "sdk",
              "description": "Origin of the score."
            },
            "categoryName": {
              "type": "string",
              "description": "Optional category for grouped feedback dimensions."
            }
          },
          "required": ["name", "
          "additionalProperties": false
        }
      },
      "workspaceName": {
        "type": "string",
        "description": "Workspac
      }
    },
    "required": ["traceId", "scores", "workspaceName"],
    "additionalProperties": fals
  },
  "annotations": {
    "readOnlyHint": false,
    "destructiveHint": false,
    "idempotentHint": false,
    "openWorldHint": false
  }
}
Once we saw the data, the conclusion was obvious: there was no scenario where this represented a positive return on investment.
As heavy users of Opik ourselves, we also realized something important. We were likely our own best customer. If these tools weren’t useful to us, they probably weren’t useful to most of our users either.
Rather than trimming a few schemas, we rebuilt the MCP from scratch.
Instead of exposing dozens of narrowly scoped tools like create_trace, we designed a smaller set of composable CRUD-style operations backed by rich error messages and self-discovery tools that expose documentation only when the model actually needs it.
The goal wasn’t simply to reduce tokens — it was to reduce unnecessary context while making the interface easier for language models to reason about.
| Tool | Purpose |
|---|---|
read | Universal read by id / name / opik:// URI |
list | Universal list with optional name filter + pagination |
ask_ollie | Investigate / synthesize via the Opik in-product assistant |
write | Universal write — log traces/spans, score, comment, save prompts, manage test suites & experiments |
schema | Introspect write-operation schemas (used by the LLM to construct valid payloads) |
run_experiment | Run an evaluation experiment end-to-end via Ollie |
The results exceeded our expectations. Prompt overhead dropped by roughly 100×, while the MCP became significantly more capable in practice. Ironically, removing complexity made it easier for models to accomplish more.
As MCP becomes the standard interface for AI applications, we think this is a pattern worth adopting. Don’t assume every tool you expose deserves to live in the prompt forever. Measure how your MCP is actually used. You may find, as we did, that the fastest way to improve both cost and usability is to remove most of what you originally built.
The Second Challenge: Optimizing Our Skill Library
About six months ago, we wrote about our migration to skills. Like many organizations, we quickly saw widespread adoption across teams. But, like any form of documentation, skill libraries don’t stay healthy on their own.
The first issue Cost Intelligence uncovered was discoverability.
We found that many skills weren’t ineffective—they simply weren’t discoverable. By updating the trigger conditions and descriptions in their front matter to better reflect real-world usage, we increased skill selection rates from 2% to 35% without changing the underlying content. The knowledge was already there; the model just wasn’t finding it.
The second issue was duplication. Once we had visibility into which skills were loaded together, we noticed that certain pairs consistently co-occurred. For example, python-best-practices and python-tracing shared roughly 60% of their content despite being maintained independently. Every time both skills were loaded, we paid to send the same guidance twice. Worse, because they evolved separately, they occasionally contradicted one another as one skill became more up to date than the other.
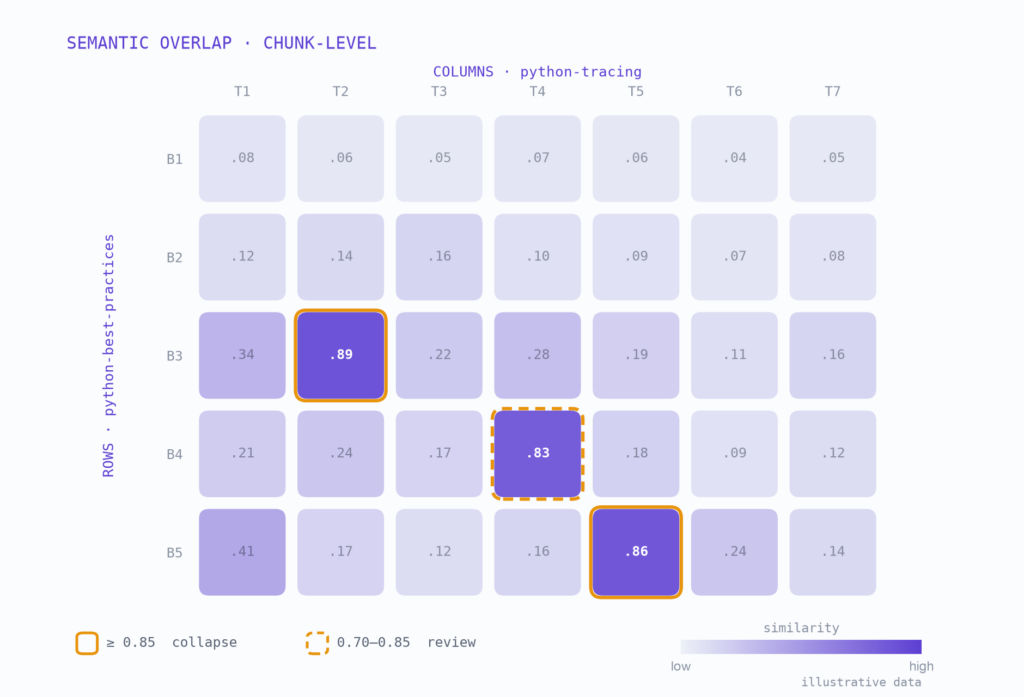
Rather than treating skills as static documentation, we began treating them like production code. We analyzed which skills frequently co-occurred, measured their semantic overlap, and merged or eliminated those that were redundant. That effort alone reduced our monthly AI spend by roughly 5%, while also making the guidance presented to models more consistent.
If your organization has embraced skills, this kind of entropy is almost inevitable. Libraries grow, teams duplicate work, documentation drifts, and context silently expands. The good news is that these problems are measurable. By instrumenting how skills are discovered and used—not just whether they exist—you can improve both model performance and cost without sacrificing capability.
Second-Level Insights
The optimizations above came from looking for wasted tokens. Once we had the data, we found ourselves asking much more interesting questions.
Because every request is tied back to a repository, we can understand how much each engineering project actually costs. That makes it possible to compare AI spend across teams, identify projects with poor ROI, and make targeted decisions such as restricting a repository to lower-cost models when the additional capability isn’t justified.
Since Cost Intelligence is built on top of Opik, we were also able to enrich that data using the rest of the platform. For example, we used LLM-as-a-Judge to classify traces as bug fixes or new feature development, allowing us to break AI spend into maintenance versus product investment. Once costs become observable, they become another engineering signal that can be analyzed, segmented, and optimized like any other piece of telemetry.
This Is Not a One-Time Analysis
Claude Code, Codex, and other coding harnesses are constantly changing. New releases regularly change how context is constructed, how tools are selected, and how requests are executed. Small implementation changes can have surprisingly large effects on token usage and cost.
A new release might change how MCPs are loaded into context, introduce a new default setting, or modify agent behavior in a way that increases your bill overnight. Without observability, those changes often go unnoticed until someone looks at the invoice.
The optimizations in this post came from measuring real usage over time, not from a single audit. As the ecosystem continues to evolve, new inefficiencies will appear alongside new opportunities to reduce cost and improve performance.
See Which Cost Optimizations Could Benefit Your Team
If your engineering team is facing similar challenges in terms of how to monitor, optimize, and attribute AI token spend without sacrificing velocity, we’d love to set up a demo of Cost Intelligence for your environment and show you how much you could save. Contact us to learn more.