Asset Types
When you log certain asset types using comet_ml, you automatically
associate them with Tabs, Pages, and Panels designed to use them. This
page documents those assets, how to log them, and the Tabs, Pages, and
Panels that have been associated with them.
If you log these asset types, and there is at least one known Panel associated with them, it will be suggested as a Panel on a new Experiment Panel view, or on a new Project view. Some assets also appear on their own Tab (such as Histograms, Audio, and Images) or their own Page (such as Embeddings) within Comet.ML.
Note that you can always find the asset itself on the Assets Tab.
3D Points
Log 3D points and boxes and visualize with Panels.
Logged with:
View with:
Live Example Panel:
Audio
Logged with:
View with:
Confusion Matrix
Logged with:
View with:
Live Example Panel:
Curve
Logged with:
View with:
Live Example Panel:
Dataframe
A Pandas dataframe is logged directly with Experiment.log_table() and also indirectly with Experiment.log_dataframe_profile().
For this example, we will leave off the headers and arrange the
orientation by records when we log the dataframe (df) as a table:
python
experiment.log_table("wine.json", df, headers=False, **{"orient": "records"})
In the Panel code on the JavaScript side, you can select all assets
with a type "dataframe" by providing a second parameter to
this.api.experimentAssets(experimentKey, "dataframe"). In this example,
we select and retrieve all dataframes. Because Pandas dataframes are logged as JSON, we
merely need to be able to decode it by passing a third parameter to
this.api.experimentAsset(experimentKey, selected.assetId, "json").
javascript
fetchTableData(experimentKey) {
     return this.api.experimentAssets(experimentKey, "dataframe").then(
       assetList => {
         let selectedAsset = assetList.filter(
             asset => asset.fileName === this.options.tableFileName);
         return Promise.all(
           selectedAsset.map(selected => {
             return this.api.experimentAsset(
                 experimentKey, selected.assetId, "json");
           })
         );
    });
  }
That will give us back the data in the following format:
json
[
 {"field_A": value, "field_B": value},
 {"field_A": value, "field_B": value},
 ...
]
For more information see:
- Experiment.log_table()
- Experiment.log_dataframe_profile() - by default, will also log the dataframe
- Report Library
Dataframe Profile
Logged with:
- Experiment.log_dataframe_profile() - by default, will also log the dataframe
View with:
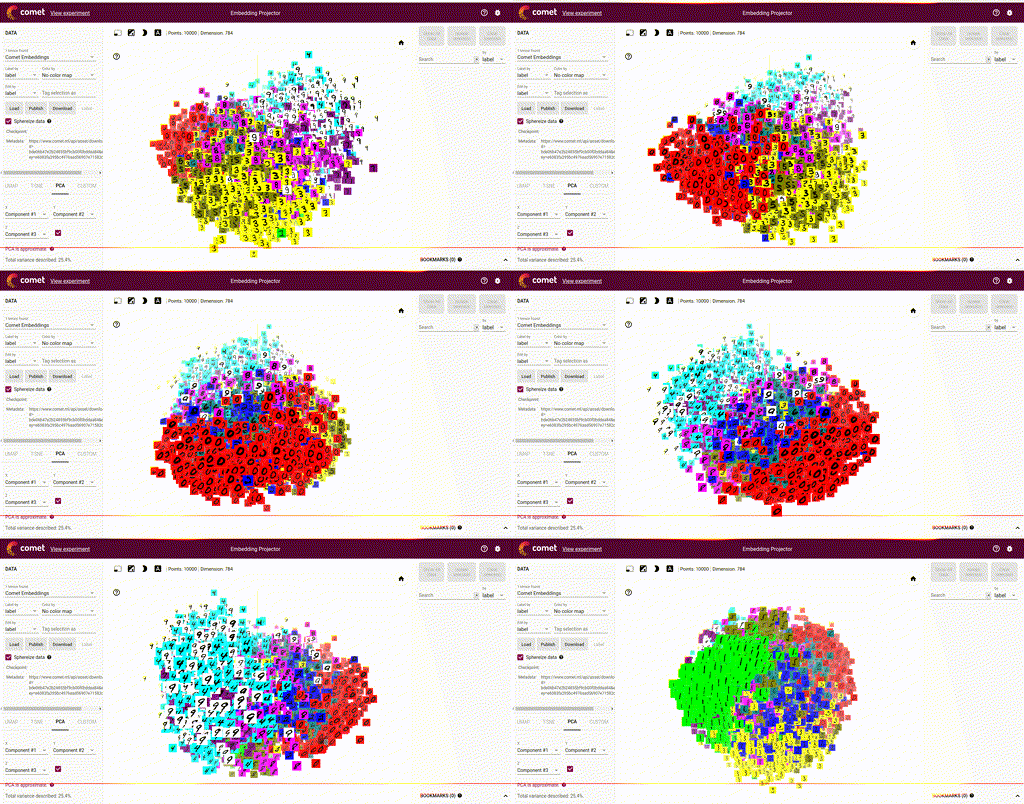
Embeddings
Logged with:
View with:

Histograms
Logged with:
View with:
Live Example Panel:
Images
Logged with:
View with:
Models
Logged with:
View with:
Notebooks
When in an IPython console, or a Jupyter notebook, logged with:
- Experiment(log_code=True) - the default
View with:
Live Example Panel:
Source Code
Logged with:
- Experiment(log_code=True) - the default
- Experiment.log_code() - log additional source code
View with:
Live Example Panel:
Text
Logged with:
View with:
Video
Logged with:
- Experiment.log_asset("filename.mp4") (logs as video based on filename extension)
- APIExperiment.log_asset(..., ftype="video") - note that this is the
APIExperiment
View with:
Additional resources: