New Relic Partnership
New Relic is a full stack monitoring platform that allows you to visualize, analyze and optimize your entire software stack from one place. With over 300 agents and integrations you can ingest and store all your operational data, including logs, in one place.
The integration between New Relic and Comet extends full stack observability to include your machine learning models in production and their performance baselines established in training, so you can build better models faster.
The New Relic integration
You can now monitor your infrastructure and machine learning data in production, allowing you to correlate ML production issues with the rest of the tech-stack for faster troubleshooting, debugging, and resolution.
Data available in New Relic
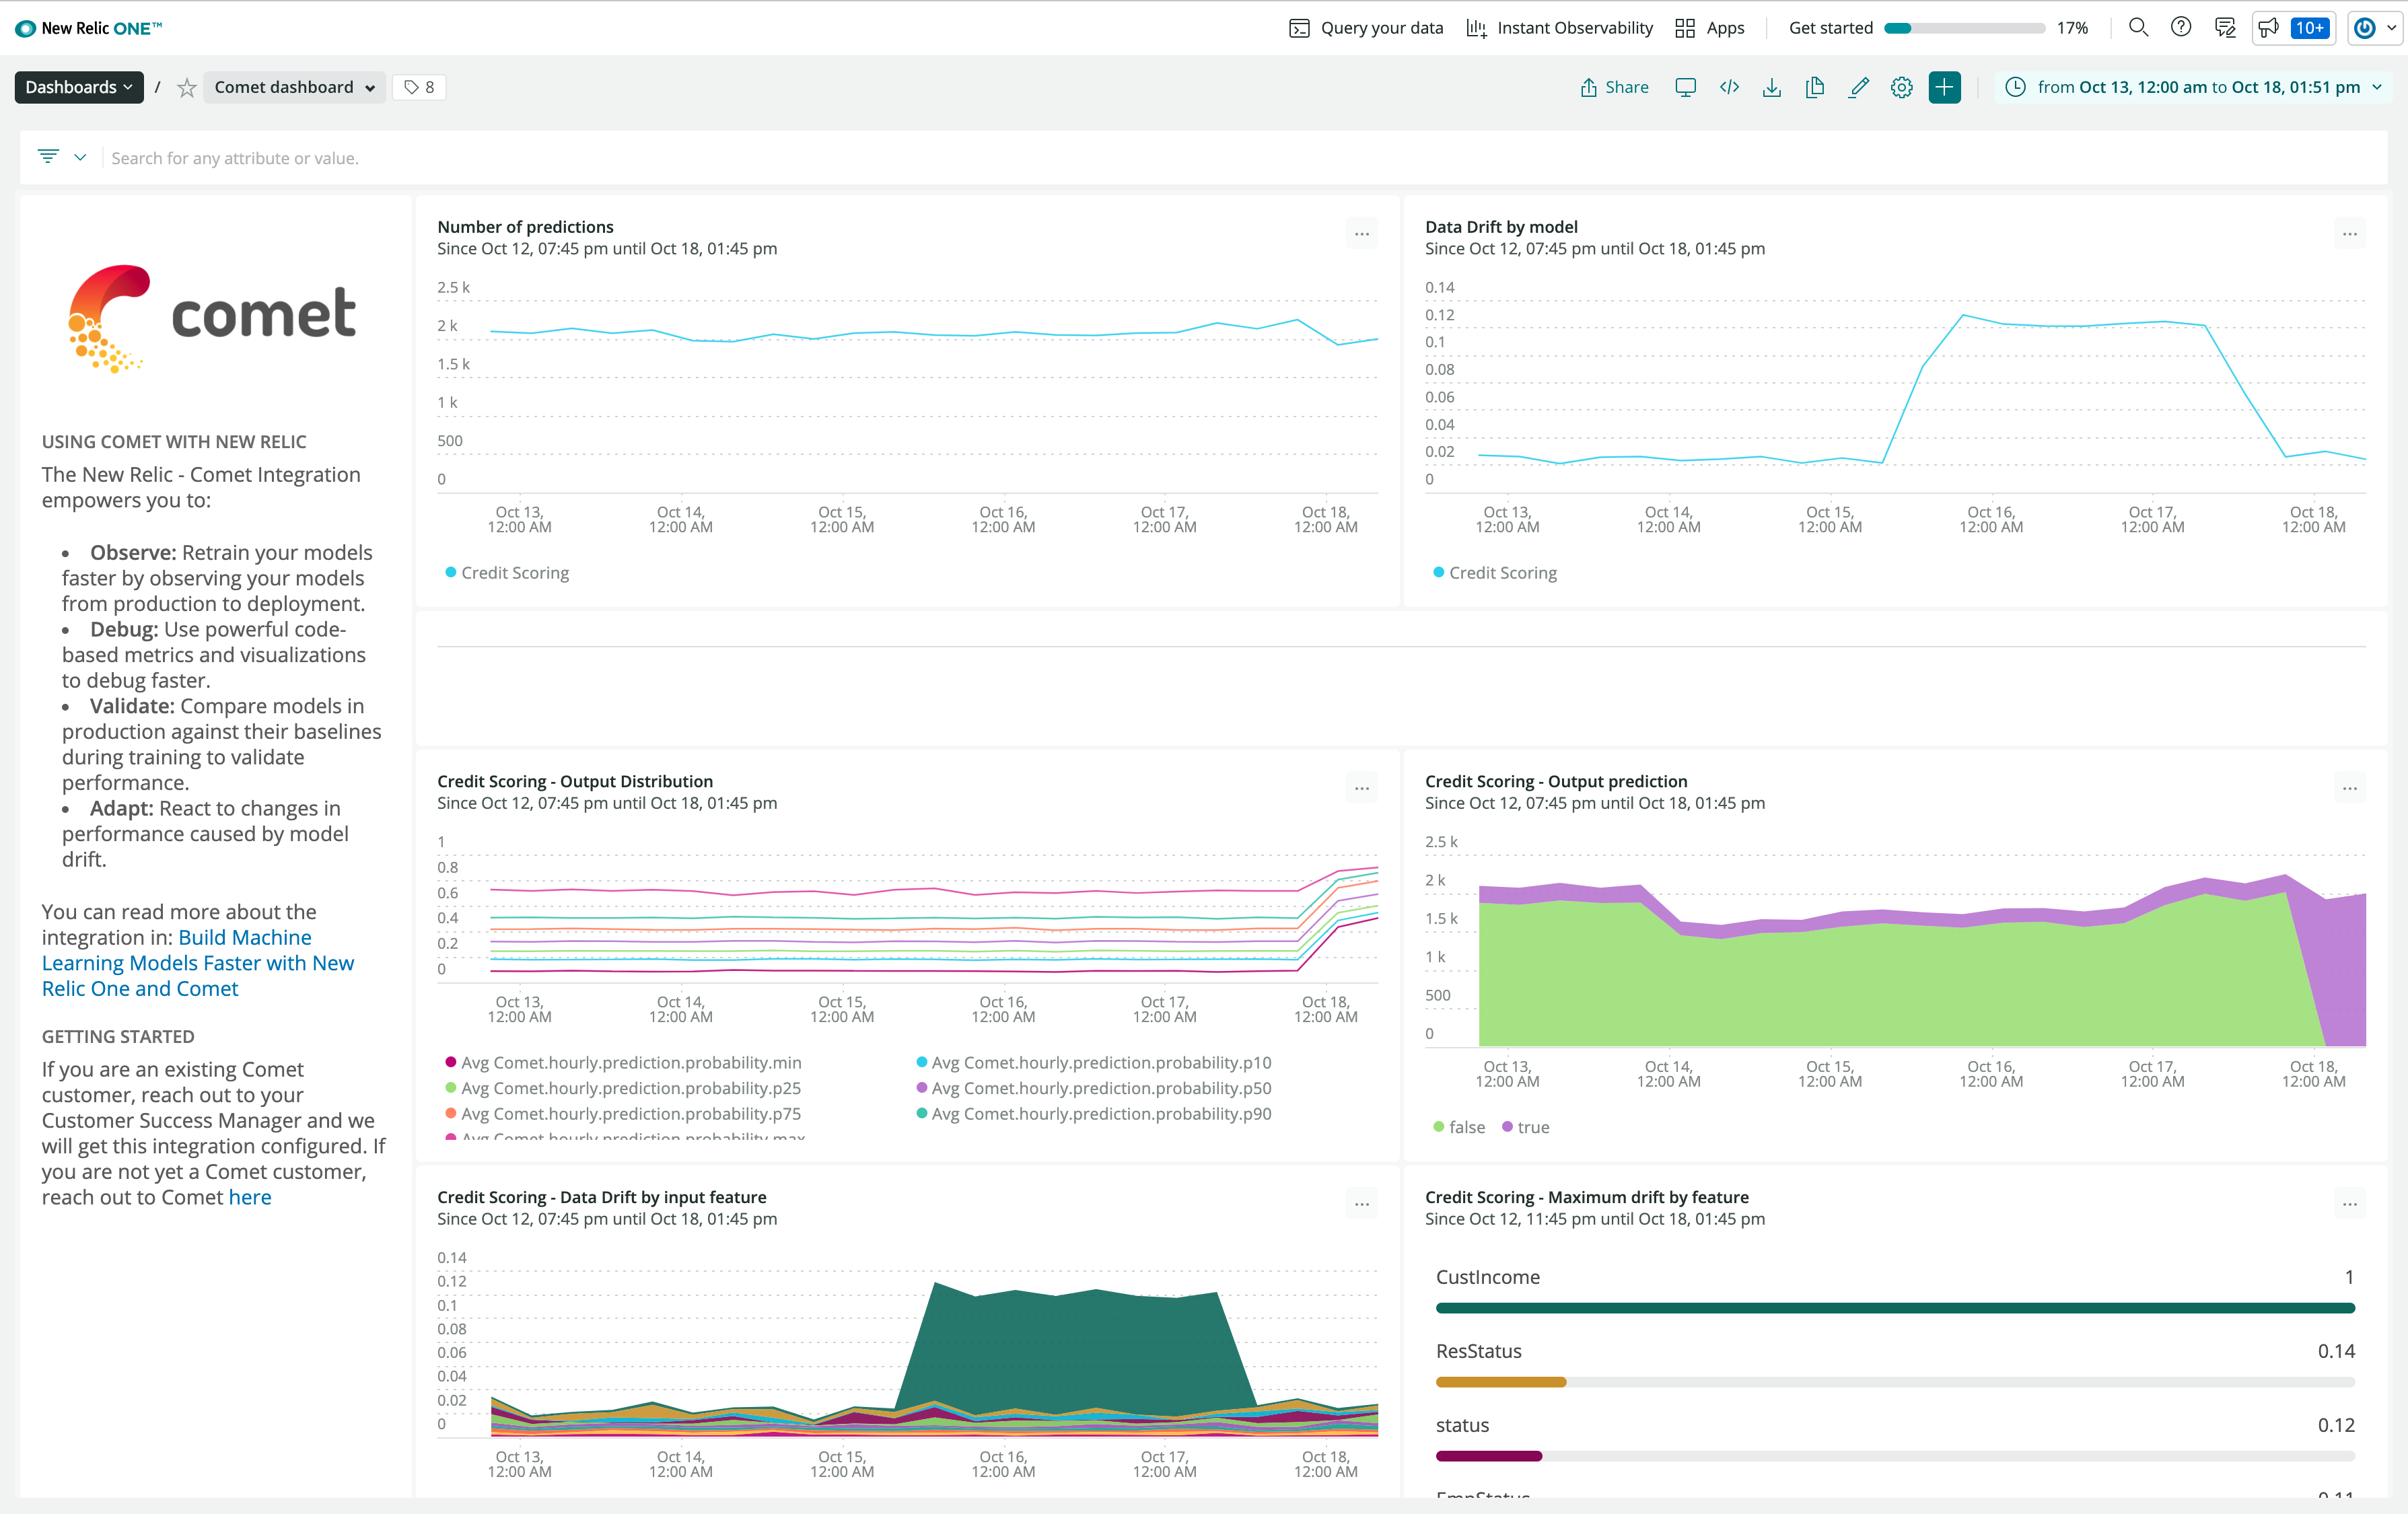
Once the integration has been configured your Comet customer success manager (CSM), you will get access in New Relic to the following metrics for each model:
comet.hourly.nb_predictions: Number of predictions made by the modelcomet.hourly.input.data_drift: Data drift broken down by input featurecomet.hourly.prediction.value: Distribution of the model’s predictioncomet.hourly.prediction.probability: Distribution of the model’s prediction probability, the following percentiles will be available:comet.hourly.prediction.probability.min: Minimumcomet.hourly.prediction.probability.p10: 10th percentilecomet.hourly.prediction.probability.p25: 25th percentilecomet.hourly.prediction.probability.p50: 50th percentile or mediancomet.hourly.prediction.probability.p75: 75th percentilecomet.hourly.prediction.probability.p90: 90th percentilecomet.hourly.prediction.probability.max: Maximum
Using Comet metrics in New Relic
Comet metrics can be used to create new dashboards or augment existing ones. To get started you can use the default Comet dashboard to start tracking the performance of your machine learning models in New Relic.
In addition, you can use Comet metrics with New Relic infrastructure metrics to correlate the performance of your machine learning models with the performance of their underlying infrastructure.
Debugging Machine Learning models with New Relic and Comet
Comet metrics can be used as part of New Relic Applied Intelligence to find, troubleshoot and resolve infrastructure issues that could be impacting the performance of your machine learning models.
If the issue with the performance of your model is not related to underlying infrastructure, you can use the Comet MPM dashboard to identify performance issues on subsets of your data using MPM Segments. You can also use MPM Log Search to query individual predictions and identify outliers.
Get started today
Already a Comet customer monitoring models in production? Setting up the integration with New Relic One can be completed quickly. Simply reach out to your Comet customer success manager (CSM) to complete the onboarding.
Not a Comet customer yet? Contact Comet today to set up an account and get started.