Platform Architecture
High-level overview on Opik’s Platform Architecture
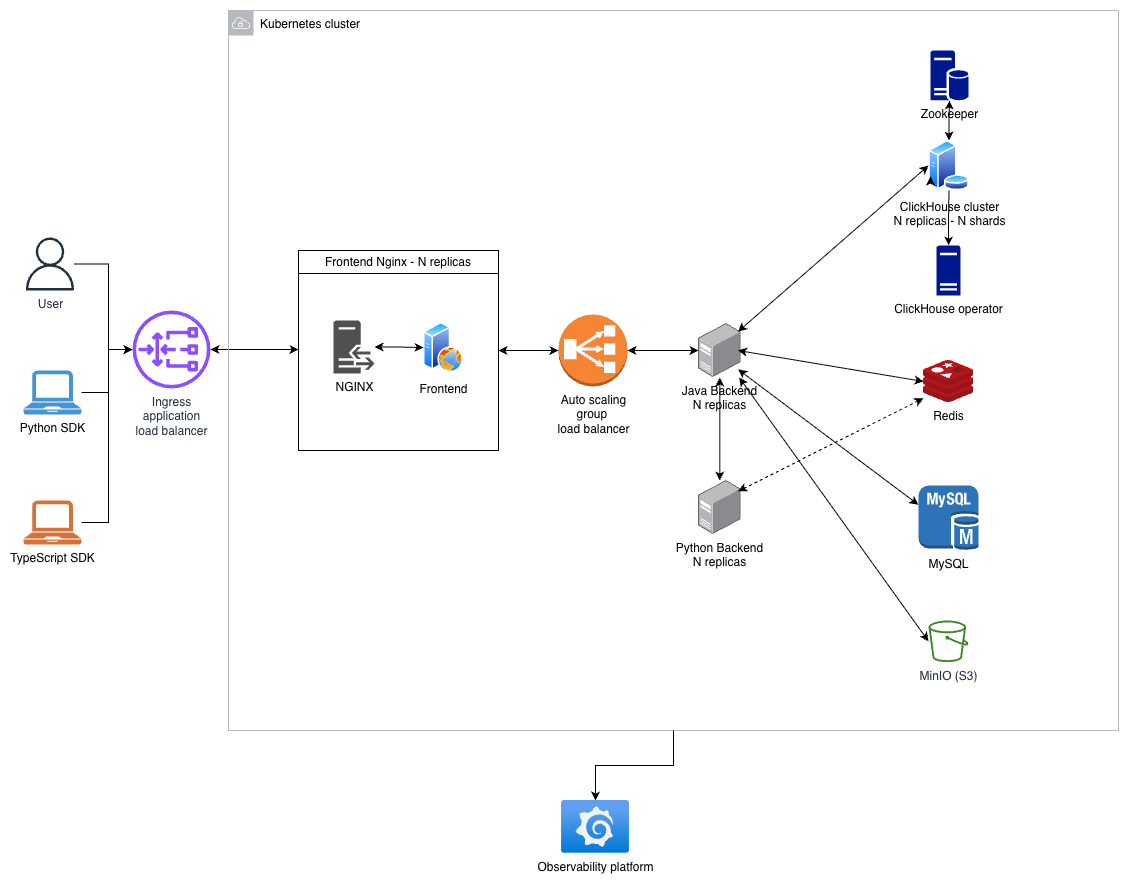
Opik’s architecture consists of multiple services that each handle a specific role, including:
- A Java backend service: Java 25 + Dropwizard — REST API, authentication, business logic, and database migrations.
- A Python backend service: Flask + Gunicorn — evaluator execution, sandboxed code execution, and optimization workflows.
- A frontend application: TypeScript + React SPA, served by Nginx which also reverse-proxies API requests to the backend.
- SDKs: Python and TypeScript clients that batch telemetry data and send it to the backend via REST/HTTP.
- Data stores:
- ClickHouse for large-scale analytical data (traces, spans, experiments, feedback scores).
- With Zookeeper for cluster coordination.
- Managed by the Altinity ClickHouse Operator in Kubernetes.
- MySQL for transactional data (projects, datasets, prompts, workspaces).
- Redis for caching, rate limiting, distributed locks, and streams (online evaluation, experiment aggregation, job queues).
- MinIO (S3-compatible) for object storage (attachments, artifacts, file uploads).
- ClickHouse for large-scale analytical data (traces, spans, experiments, feedback scores).
Java Backend Service
Opik’s main backend uses Java 25 LTS and Dropwizard, structured as a RESTful web service offering public API endpoints for core functionality. Full API documentation is available here.
Key responsibilities:
- REST API: Exposes endpoints for traces, spans, experiments, datasets, prompts, feedback scores, and more.
- Authentication and authorization: Workspace-scoped permissions with API key and session-based authentication.
- Database management: Connects to ClickHouse (via R2DBC reactive driver) for analytics, MySQL (via JDBI) for transactional state, Redis (via Redisson) for caching and streams, and MinIO for file storage.
- Event processing: In-memory event bus (Guava AsyncEventBus) with virtual threads, plus Redis Streams for distributed async workflows like online scoring and experiment aggregation.
- Schema migrations: Liquibase-based migrations for both MySQL and ClickHouse, run automatically on startup.
- LLM proxy: Integrates with multiple LLM providers (OpenAI, Anthropic, Google Gemini, and others) for the playground and LLM-as-judge evaluators.
For observability, Opik uses OpenTelemetry due to its vendor-neutral approach and wide support across languages and frameworks. It provides a single, consistent way to collect telemetry data from all services and applications.
You can find the full backend codebase in GitHub under the apps/opik-backend folder.
Python Backend Service
Opik includes a Python backend service (Flask + Gunicorn) that handles workloads requiring Python execution:
- Evaluators: Executes custom Python evaluation code in sandboxed subprocesses with configurable timeouts, memory limits, and network isolation.
- Optimization Studio: Runs LLM-based optimization and prompt engineering workflows with concurrent job management.
- Background jobs: Uses Redis Queue (RQ) for asynchronous job processing, including evaluation runs and optimization tasks.
The Java backend calls the Python backend for evaluator execution, and both services share Redis for job coordination.
You can find the full Python backend codebase in GitHub under the apps/opik-python-backend folder.
Frontend Application
Opik’s frontend is a TypeScript + React single-page application built with Vite and served by Nginx. The Nginx server handles two roles:
- Static file serving: Serves the built React SPA with SPA-style routing (fallback to
index.html). - API reverse proxy: Routes
/api/*requests to the Java backend by stripping the/apiprefix and proxying to port 8080. This includes WebSocket upgrade support for streaming endpoints.
The frontend uses TanStack Router for file-based routing, TanStack React Query for server state management, and Zustand for client-side state.
You can find the full frontend codebase in GitHub under the apps/opik-frontend folder.
SDKs
Opik provides SDKs for Python and TypeScript. Both SDKs implement asynchronous batching to optimize network
efficiency — they accumulate individual trace and span operations and send them as bulk requests to the backend’s
batch endpoints (POST /v1/private/traces/batch, POST /v1/private/spans/batch, etc.).
You can find the SDK codebases in GitHub under sdks/python for the Python SDK
and sdks/typescript for the TypeScript SDK.
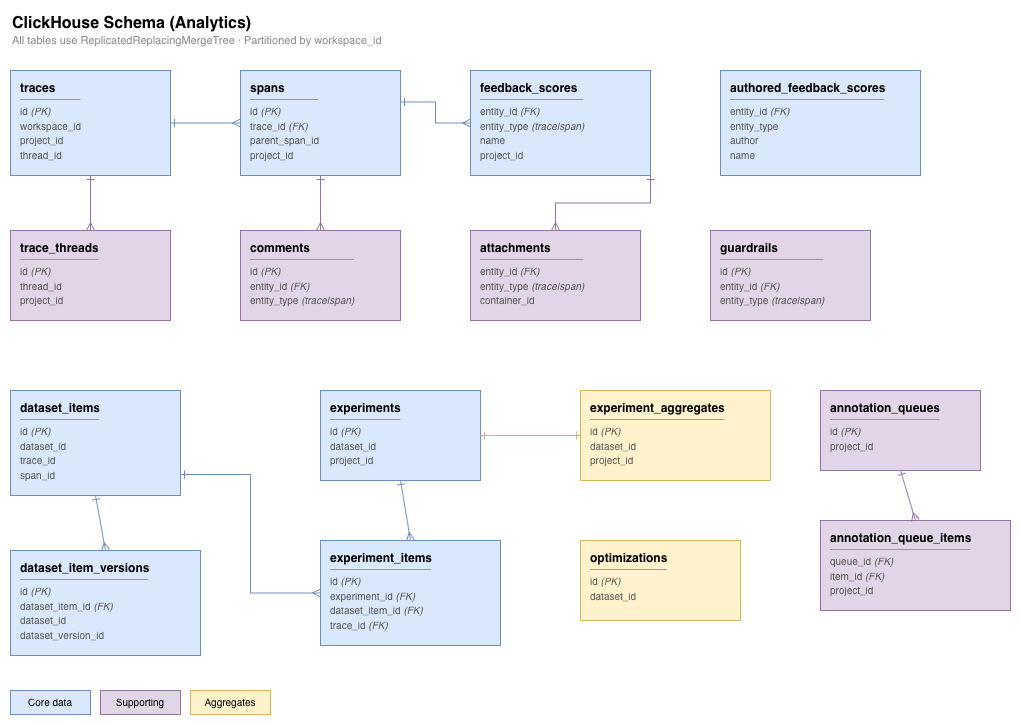
ClickHouse
ClickHouse is a column-oriented OLAP database optimized for fast analytics on large datasets. Opik uses ClickHouse for data that requires near real-time ingestion and analytical queries:
- Traces and spans (LLM call records)
- Feedback scores and evaluations
- Experiment items and results
- Dataset items
The backend connects to ClickHouse via HTTP (port 8123) using a reactive R2DBC driver for non-blocking queries. Async inserts are enabled for high-throughput ingestion with configurable batching and deduplication.
In Kubernetes deployments, ClickHouse is managed by the Altinity ClickHouse Operator, which handles cluster provisioning, scaling, and monitoring. Zookeeper provides distributed coordination for replica synchronization.
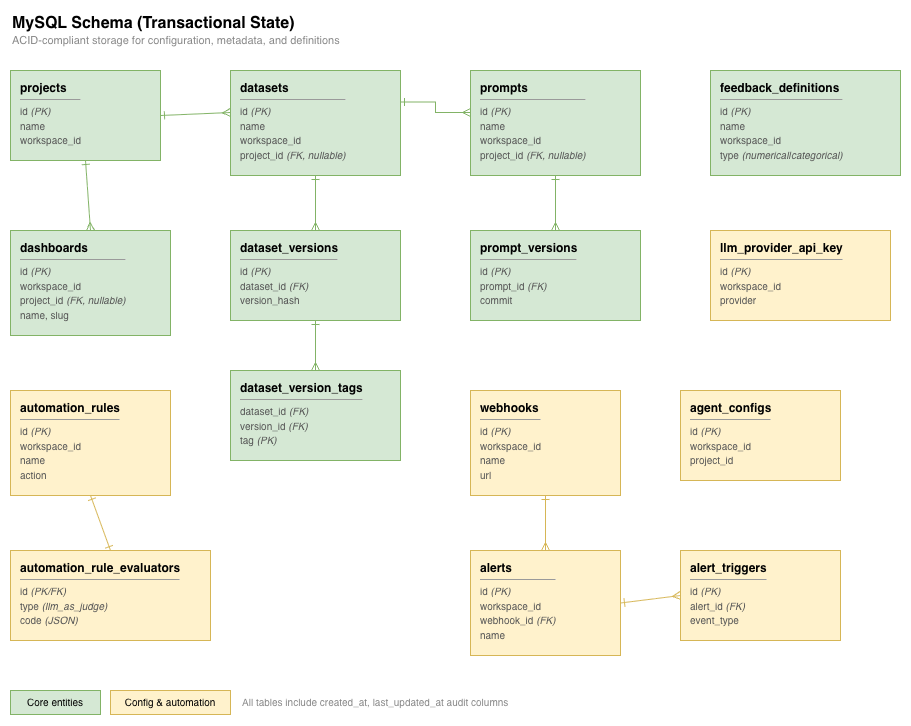
MySQL
Opik uses MySQL for ACID-compliant transactional storage of lower-volume but critical data:
- Workspace and user management
- Project metadata
- Dataset and prompt definitions (with versioning)
- Feedback definitions
- Automation rules and alert configurations
The backend connects via JDBC with connection pooling and supports AWS RDS with IAM authentication for cloud deployments.
Redis
Redis serves multiple roles in Opik’s architecture:
- Distributed cache: High-speed lookups for sessions, API key resolution, and frequently accessed data.
- Distributed locks: Coordinating safe access to shared resources across backend replicas (configurable TTL).
- Rate limiting: Token-bucket rate limiting to enforce throughput limits per user and workspace.
- Streams: Redis Streams power asynchronous workflows:
- Online evaluation: Consumer groups process LLM-as-judge scoring and Python evaluator results with automatic message claiming for fault tolerance.
- Experiment aggregation: Debounced recomputation of experiment metrics across distributed backend instances.
- Job queue: Redis Queue (RQ) coordinates background jobs between the Java backend and the Python backend for evaluator execution and optimization tasks.
MinIO (S3-Compatible Storage)
Opik uses MinIO as an S3-compatible object store for binary data that doesn’t belong in the relational or analytical databases:
- Trace attachments (logs, screenshots, etc.)
- Dataset file uploads (CSV imports)
- Experiment artifacts
- Custom evaluation code
In production deployments, MinIO can be replaced with any S3-compatible storage service (e.g., AWS S3, Google Cloud Storage).
Observability
Opik is built on top of open-source infrastructure (MySQL, Redis, ClickHouse, Kubernetes), making it straightforward to integrate with popular observability stacks such as Grafana and Prometheus:
- OpenTelemetry: All three application services (Java backend, Python backend, and frontend Nginx) support OpenTelemetry instrumentation. An optional OpenTelemetry Collector can be deployed to aggregate traces and metrics, forwarding them to Jaeger, Grafana, or any OTLP-compatible backend.
- ClickHouse Operator: Provides real-time performance monitoring and metric exports to Grafana/Prometheus.
- Standard monitoring: MySQL, Redis, and Kubernetes all have well-documented strategies for monitoring with Prometheus exporters and Grafana dashboards.