How to Build a Customized Panel in Comet
Recently I have discovered a very interesting feature provided by Comet: customized Panels. A Panel is a visual display that shows some results as tables or graphs. Results may include performance metrics, dataset statistics, or simply generic data.
Comet provides a dashboard to build generic Panels. In addition, it provides an SDK that permits the creation of custom Panels either in Python or Javascript. In this article, I describe how to build a custom Panel in Comet.
The Concept of Panels in Comet
Comet is an experimentation platform that provides users with tools and features to track and monitor machine learning experiments. To summarize the results of the experiments, Comet provides a feature called Panels. You can build as many Panels as you want.
A Panel is not necessarily linked to a specific experiment; rather, it can show results across the different experiments.
To create a new Panel, after one or more experiments run, you can simply click on the ‘Add’ button at the top right corner of your dashboard and click ‘New Panel.’ Then you can choose one of the built-in or featured Panels, as shown in the following figure:

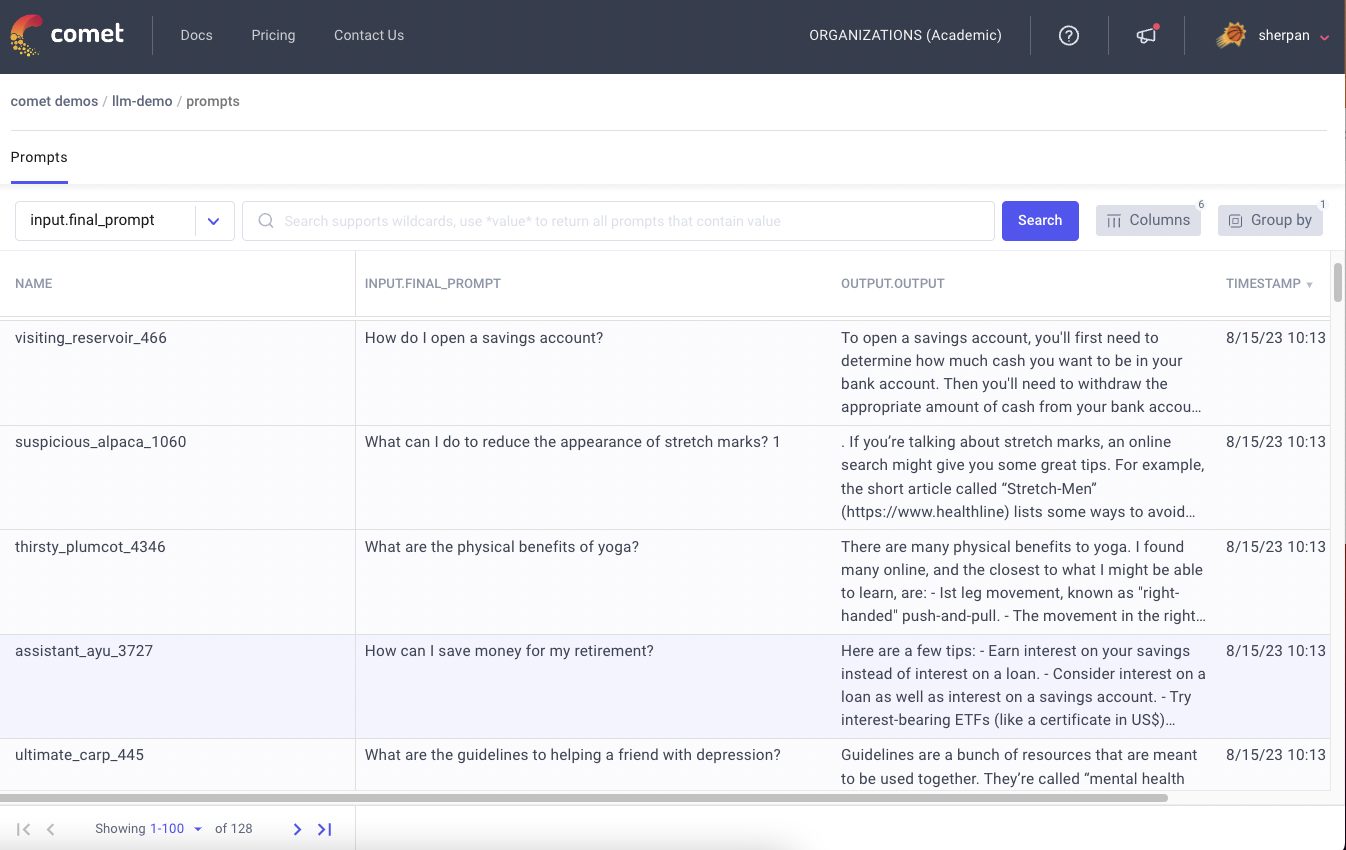
The following figure shows an example of a Panel in Comet:

Custom Panels
Comet provides a Python/Javascript SDK that permits the creation of custom Panels. At the moment, you can create custom Panels only from the online GUI. To access the GUI, you can click ‘Add →New Panel’ from the dashboard, and then click on ‘Create New.’ A new window opens, with an online SDK, as shown in the following figure:

The SDK presents an editor on the left where you can write your code and a preview of the result on the right. To see the preview, you should click the run button. In the top part of the SDK, you can select your preferred language (Python or Javascript).
A Comet Panel can receive many options as input. You can specify them in the Options tab of the SDK. You can define options as key-value pairs, as follows:
{
 "key1" : "value1",
 "key2" : "value2",
 ...
 "keyN" : "valueN"
}
Custom Panels in Python
Comet defines the ui subpackage to customize your Panel. Before using it, you must import it as follows:
from comet_ml import ui
The ui subpackage defines the following methods:
ui.display()ui.display_figure()ui.display_image()ui.display_text()ui.display_markdown()
The function names are self-explanatory. However, for more information, you can refer to the Comet official documentation.
Comet panels are integrated with Matplotlib and Plotly graphs, as well as with the PIL Image Library.
To retrieve input options, you can use the get_panel_options() function provided by the API() class:
from comet_ml import API

api = API()
options = api.get_panel_options()
Custom Panels in Javascript
A Javascript Panel should extend the Panel class as follows:
class MyPanel extends Comet.Panel {
  ...
}
The Comet.Panel class defines different methods, as explained in the Comet official documentation. To draw something in your Panel, you can use the draw() method. You can access the input options through the this.optionsvariable.
Javascript panels are compatible with the Javascript Plotly library.
Want to see more of Comet in action? Check out our Hacker News project on YouTube!
A Practical Example
Let us suppose that you have built your own machine learning model and you have calculated precision, recall, and f1-score. Let us further suppose that you have tracked your metrics in Comet through the log_metric() method of the Experiment class. Finally, you have run different experiments. Now you want to build a custom Panel in Python that shows the values of a given metric across all the experiments.
You open the Python SDK in Comet and begin to write your code. Firstly, you import the needed libraries:
from comet_ml import API, ui
import matplotlib.pyplot as plt
Then, you get all the available metrics through the get_panel_metrics_names()provided by the Comet API:
api = API()
metrics = api.get_panel_metrics_names()
Now, you add a dropdown menu that permits the user to select a metric. You use the dropdown() function provided by the Comet UI:
selected_metric = ui.dropdown('Select a metric:', metrics)
Then, you retrieve all the experiment’s keys and the associated information for the selected metric:
experiment_keys = api.get_panel_experiment_keys()
metrics = api.get_metrics_for_chart(experiment_keys, [selected_metric])
The metrics variable looks like this:
{'YOUR EXPERIMENT KEY': {
   'experimentKey': 'YOUR EXPERIMENT KEY',
   'steps': None,
   'epochs': None,
   'metrics': [{
      'metricName': 'f1',
      'values': [0.9444444444444444],
      'steps': [None],
      'epochs': [None],
      'timestamps': [1642501827141],
      'durations': [0]
    }],
    'params': None,
    'empty': False
},
 'ANOTHER EXPERIMENT KEY': {...},
...
}
Your objective is to extract the values for the selected metric across all the experiments. Thus, you loop across the metrics variable and then you extract the values. You plot all the metric values as a gray bar, save for a specific experiment where you plot the bar in red:
fig, ax = plt.subplots()
for experiment_key in metrics:
    for metric in metrics[experiment_key]["metrics"]:
        if experiment_key == 'YOUR SPECIFIC EXPERIMENT':
            plt.bar(experiment_key, metric['values'], color='red')
        else:
            plt.bar(experiment_key, metric['values'], color='gray')plt.xticks(rotation=90)
ax.spines["right"].set_visible(False)
ax.spines["top"].set_visible(False)
Now, you call the display() function of the Comet ui to draw the graph:
ui.display(plt)
The following figure shows the final output:

Summary
Congratulations! You have just built your first custom Panel in Comet! Custom Panels can be personalized as you want, thus you can build incredible visualizations in Comet either in Python or Javascript. You can read more on Comet Panels in the Comet official documentation available at this link.
Comet also can be used for other purposes, including hyperparameter tuning, Natural Language Processing, and much more.
And now you just have to try Comet!
Happy coding, happy Comet!
Related Articles