Skip to content

Log images

Comet images offer you the flexibility to log and visualize images from a variety of formats, including PIL, numpy, list, Pytorch tensor, Tensorflow tensor, local filepaths, and file-like objects.

Example images in Graphics tab
View logged images in the Comet UI for Comet Tutorial 2

Comet allows you to visualize images as logged assets, rendered graphics, or in custom panels—in an experiment and across experiments. Additionally, you can specify annotations including bounding boxes and/or masks when logging the image to support your specialized Computer Vision use case. Finally, consider logging additional metadata with each image to unlock the ability to group images by tag in the Comet UI.

The following method can be used to log images:

The following panel can be used to visualize images:

In addition all the images logged to an Experiment can be view in the Single Experiment page tabs:

For example, you could...

Compare the effectiveness of various data augmentation techniques across experiments by examining logged images, especially for very confident correct and incorrect model predictions.

Log image

The examples below showcases how to log an example image of a bunny and loaded with PIL, as an array, or from filepath.

 1
 2
 3
 4
 5
 6
 7
 8
 9
10
11
12
13
14
15
16
import io
import comet_ml
from PIL import Image
import requests

# Initialize the Comet Experiment
comet_ml.init()
exp = comet_ml.Experiment()

# Define an example image
image_url = "https://cdn.pixabay.com/photo/2016/12/04/21/58/rabbit-1882699_1280.jpg"
response = requests.get(image_url)
pil_image = Image.open(io.BytesIO(response.content))

# Log image to Comet
exp.log_image(image_data=pil_image, name="example_pil")
 1
 2
 3
 4
 5
 6
 7
 8
 9
10
11
12
13
14
15
16
import io
import comet_ml
import requests
from skimage import io as sk_io

# Initialize the Comet Experiment
comet_ml.init()
exp = comet_ml.Experiment()

# Define an example image
image_url = "https://cdn.pixabay.com/photo/2016/12/04/21/58/rabbit-1882699_1280.jpg"
response = requests.get(image_url)
image_array = sk_io.imread(io.BytesIO(response.content))

# Log image to Comet
exp.log_image(image_data=image_array, name="example_array")
 1
 2
 3
 4
 5
 6
 7
 8
 9
10
11
12
13
14
15
16
17
import io
import comet_ml
import requests

# Initialize the Comet Experiment
comet_ml.init()
exp = comet_ml.Experiment()

# Define an example image
image_url = "https://cdn.pixabay.com/photo/2016/12/04/21/58/rabbit-1882699_1280.jpg"
response = requests.get(image_url)
filepath = "/tmp/example_filepath.jpg"
with open(filepath, 'wb+') as f:
    f.write(response.content)

# Log image to Comet
exp.log_image(image_data=filepath)

When logging the image from array or file-like object, make sure that the image_channels argument correctly specify where the color channels is between first or last (default is last).

Additionally, the log_image() method allows you to specify other image options; for example, you could use the image_scale argument to rescale your image (default is 1.0) or the image_colormap argument to colorize the image data (default is None). Please refer to the method definition for a full list of arguments.

Log image with bounding boxes

The example below showcases how to log images with bounding boxes which are used in Object Detection tasks.

The boxes, labels, and scores are created by running inference on the provided image with fasterrcnn_resnet50_fpn and taking the most confident prediction for each cat and dog in the image.

 1
 2
 3
 4
 5
 6
 7
 8
 9
10
11
12
13
14
15
16
17
18
19
20
21
22
23
24
25
26
27
28
29
30
31
32
33
34
import io
import comet_ml
from PIL import Image, ImageDraw
import requests

# Initialize the Comet Experiment
comet_ml.init()
exp = comet_ml.Experiment()

# Define an example image with bounding boxes
image_url = "https://cdn.pixabay.com/photo/2018/10/01/09/21/pets-3715733_960_720.jpg"
response = requests.get(image_url)
image = Image.open(io.BytesIO(response.content))

boxes = [
    [626.9825439453125, 414.496826171875, 863.0851440429688, 599.9555053710938],
    [123.45330047607422, 307.92236328125, 286.8298034667969, 599.8884887695312],
    [428.3597717285156, 177.7510986328125, 647.4353637695312, 599.8512573242188],
    [224.74839782714844, 246.34512329101562, 431.33306884765625, 609.96240234375],
]
labels = ['cat', 'dog', 'dog', 'cat']
scores = [0.9971518516540527, 0.9916735291481018, 0.9886680245399475, 0.9515751600265503]

annotations_data = [
    {"boxes": [b], "label": l, "score": s} for b, l, s in zip(boxes, labels, scores)
]
annotations = [{"name": "Predictions", "data": annotations_data}]

# Log the image with bounding boxes to Comet
exp.log_image(
    image_data=image,
    name="example-image-with-bounding-boxes.png",
    annotations=annotations,
)

Bounding boxes should follow the format [x, y, w, h], where [x, y] represent the coordinates of the top left corner and [w, h] represent the width and height of the bounding box.

The screenshot below showcases how the image created with this code snippet is displayed in the Comet UI.

Example Image Panel with boxes
The example image with bounding boxes accessed from the Graphics tab

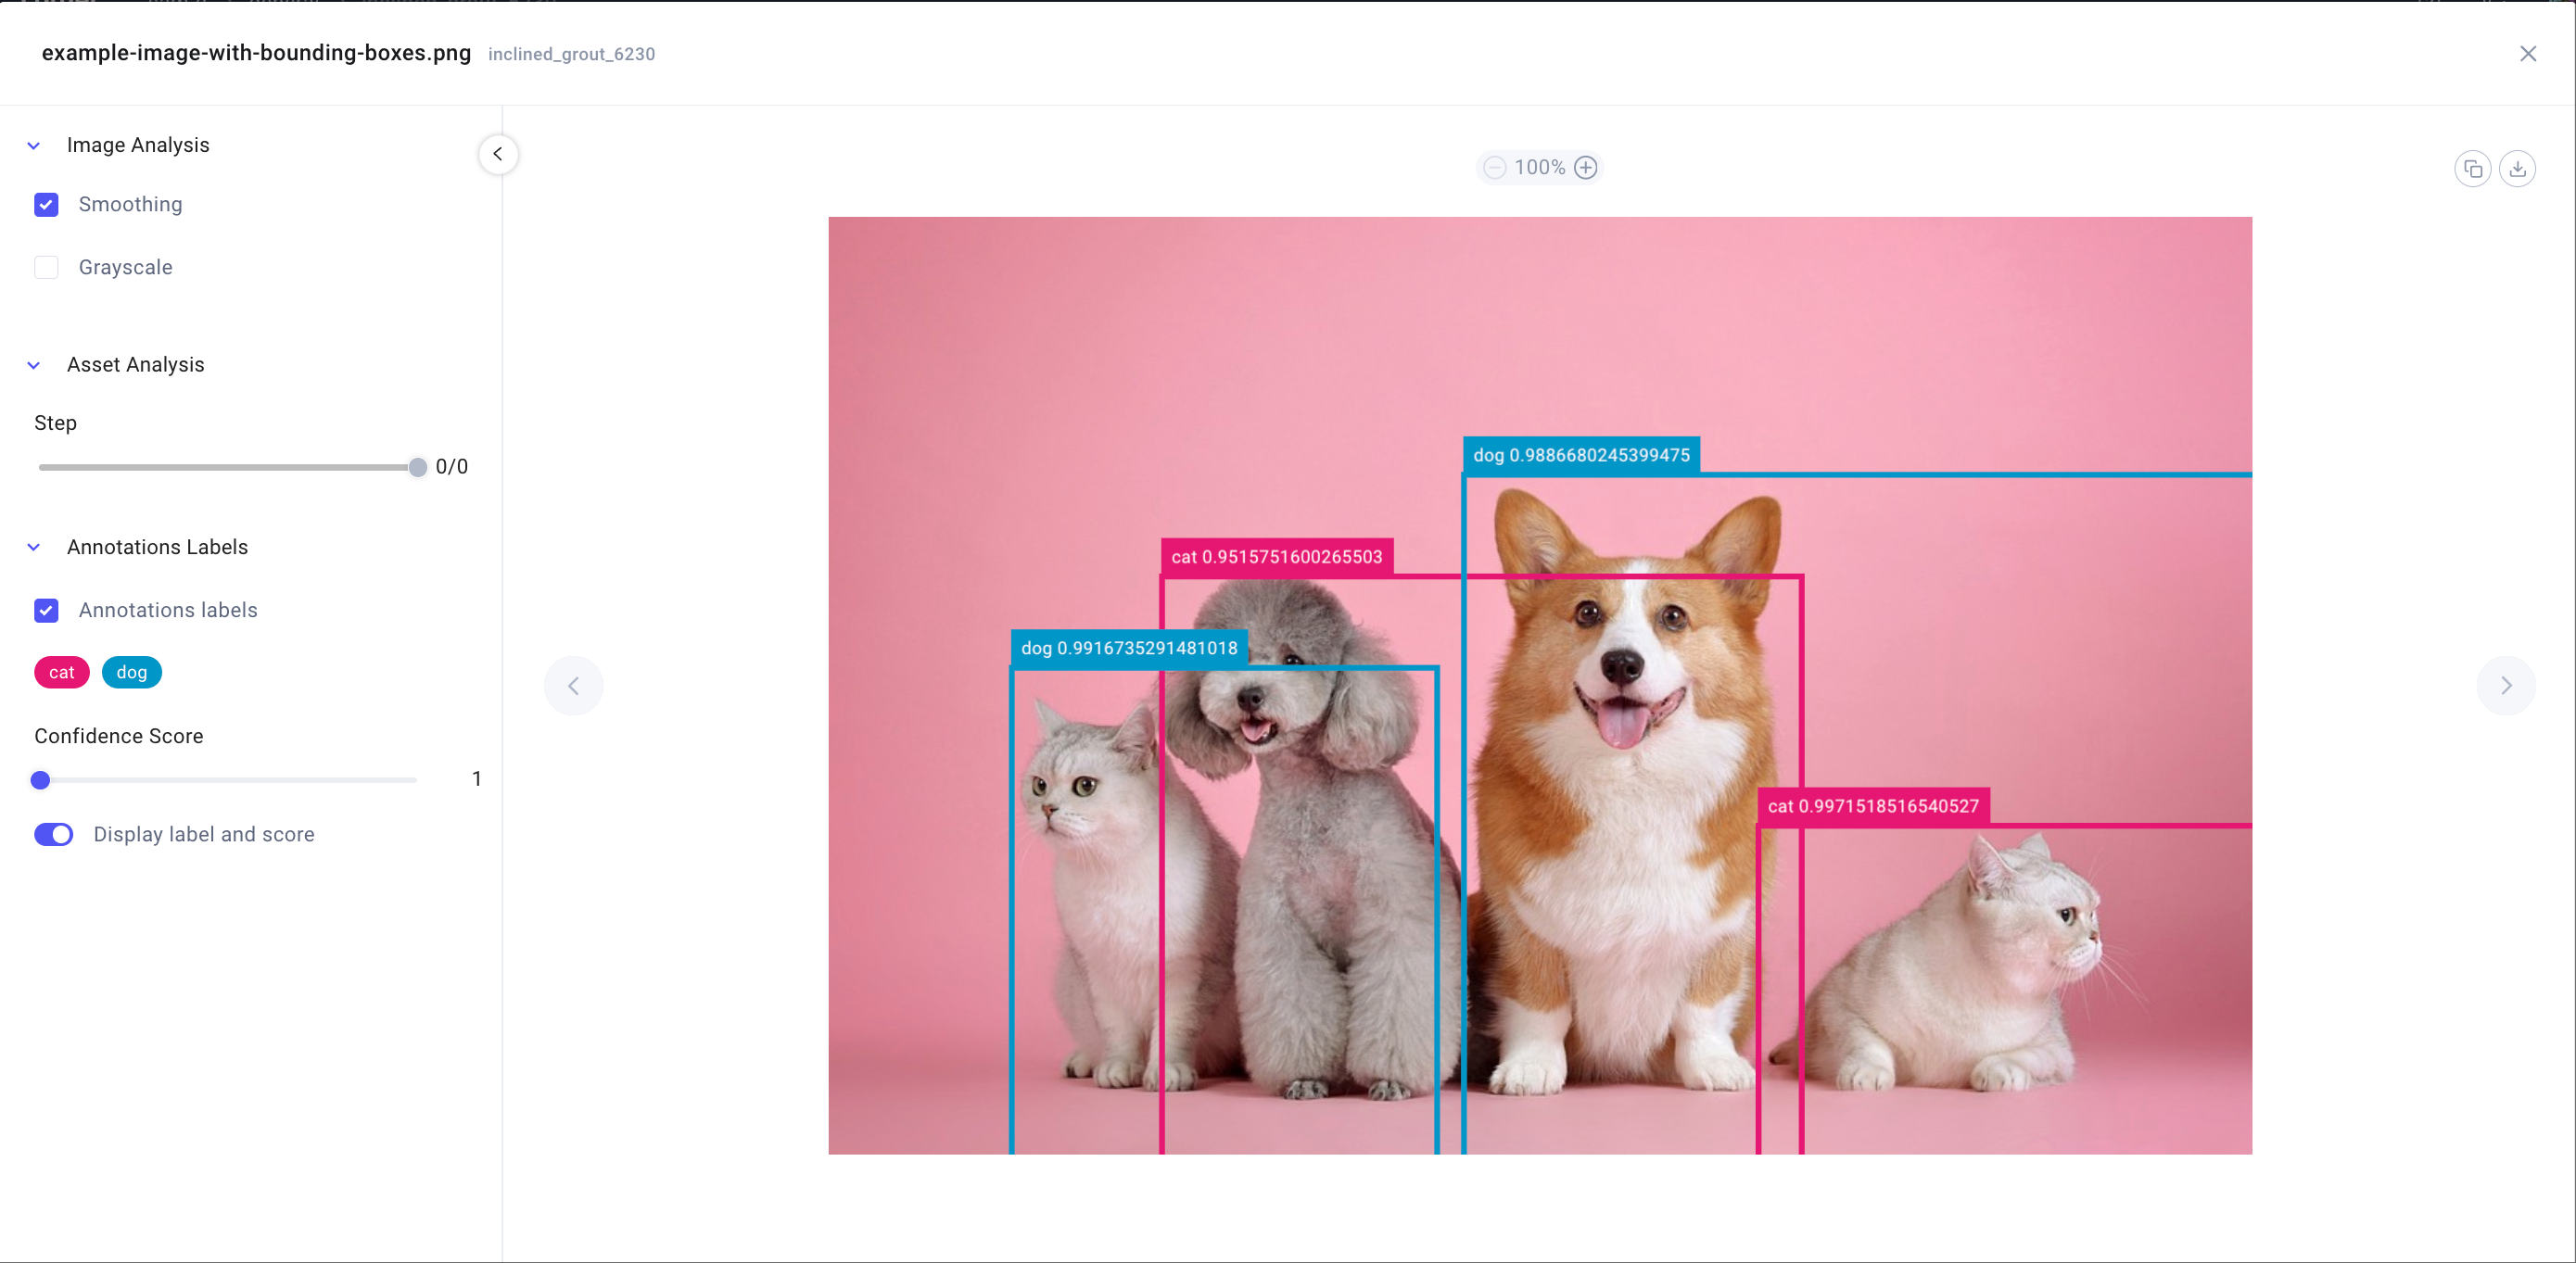
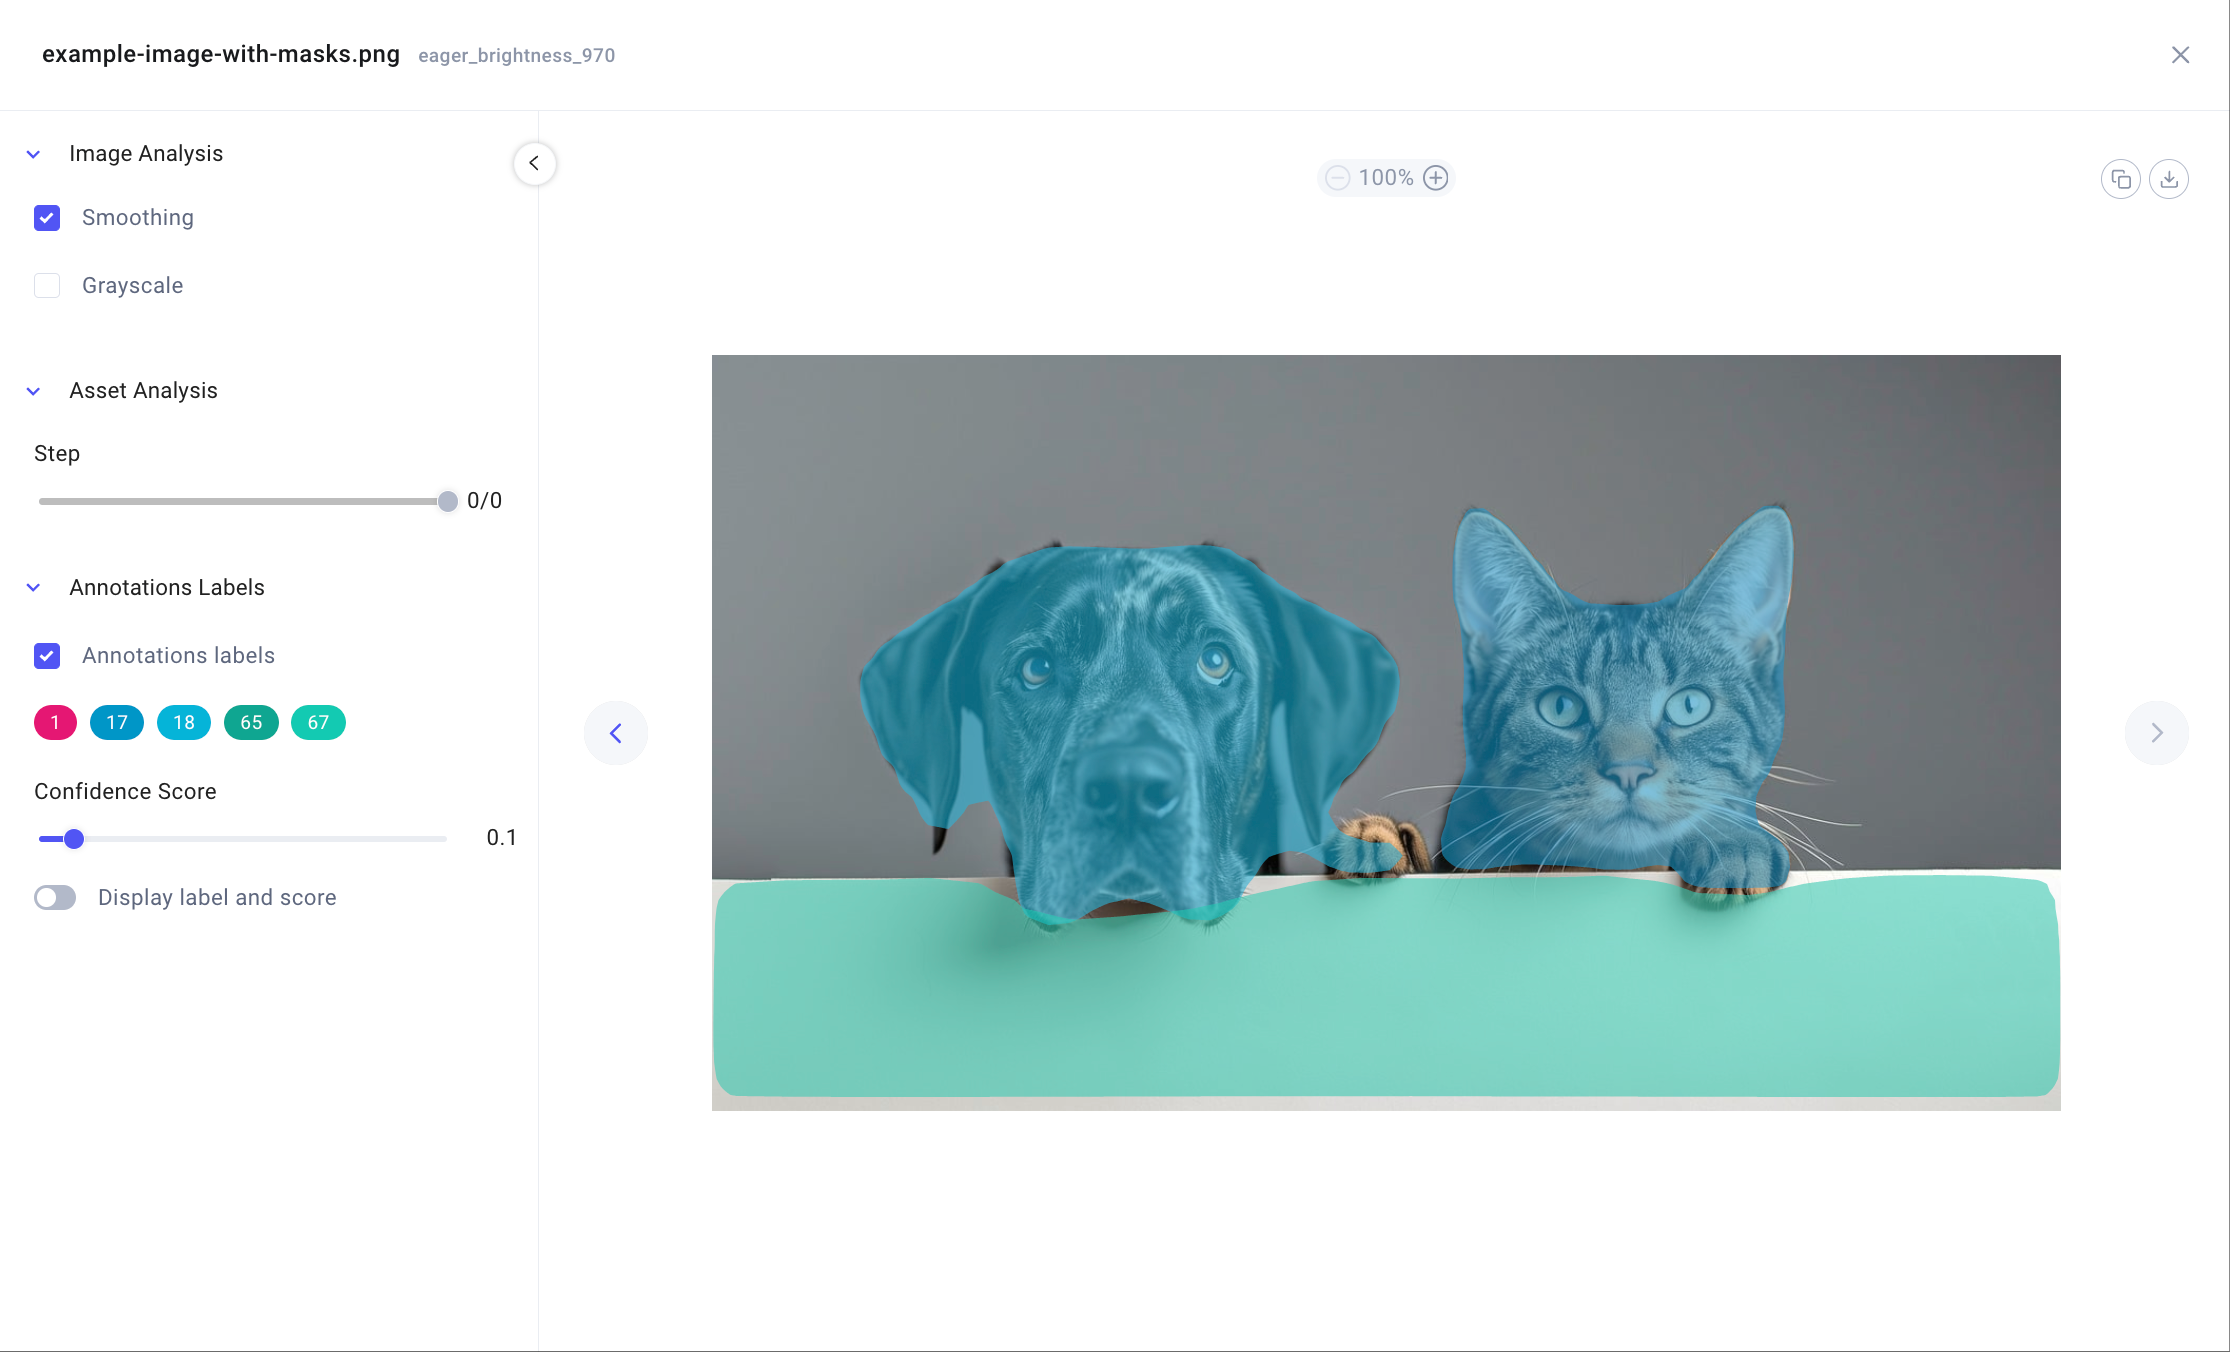
Log image with regions

The example below showcases how to log images with regions, also referred to as regions, which are used in Image Segmentation tasks.

The boxes, labels, and scores are created by running inference on the provided image with maskrcnn_resnet50_fpn and taking the most confident prediction for each cat and dog in the image.

 1
 2
 3
 4
 5
 6
 7
 8
 9
10
11
12
13
14
15
16
17
18
19
20
21
22
23
24
25
26
27
28
29
30
31
32
33
34
35
36
37
38
39
40
41
42
43
44
45
46
47
48
49
50
51
52
53
54
55
56
57
58
59
60
61
62
63
64
65
66
67
68
69
70
71
72
73
import comet_ml
import io
import numpy as np
from PIL import Image
import requests
from skimage import measure
import torch
import torchvision
from torchvision import transforms

# Initialize the Comet Experiment
comet_ml.init()
exp = comet_ml.Experiment()

# Create example image with regions
image_url = "https://cdn.pixabay.com/photo/2017/03/31/15/41/giraffe-2191662_960_720.jpg"
response = requests.get(image_url)
image = Image.open(io.BytesIO(response.content))

def get_regions(image):
    """Returns points, scores, and labels for Comet image logging"""

    def _make_ped_points(binary_mask):
        """Converts binary mask labels to polygon point list"""

        contours = measure.find_contours(binary_mask, 0.5)
        ped_points = []

        for contour in contours:
            contour = np.flip(contour, axis=1)
            segmentation = contour.ravel().tolist()
            ped_points.append(segmentation)

        return ped_points

    model = torchvision.models.detection.maskrcnn_resnet50_fpn(pretrained=True)
    model.eval()

    # Define image transformations
    transform = transforms.Compose([
        transforms.ToTensor(),
    ])
    image_tensor = transform(image).unsqueeze(0)  # Add batch dimension

    # Perform object detection
    with torch.no_grad():
        predictions = model(image_tensor)

    # Process predictions to extract labels, scores, and regions
    labels = predictions[0]['labels'].tolist()
    scores = predictions[0]['scores'].tolist()
    regions = predictions[0]['regions']

    # Convert the regions to a polygon point list
    points = []
    for mask in predictions[0]['regions']:
        points.append(_make_ped_points(mask.numpy().squeeze())[0])

    return points, labels, scores

points, labels, scores = get_regions(image)

annotations_data = [
    {"points": [p], "label": l, "score": s} for p, l, s in zip(points, labels, scores)
]
annotations = [{"name": "Predictions", "data": annotations_data}]

# Log the image with regions to Comet
exp.log_image(
    image_data=image,
    name="example-image-with-regions.png",
    annotations=annotations,
)

Bounding boxes should follow the format [x1, y1, x2, y2, x3, y3, .., x_n, y_n] given n total polygon points that define the mask.

The screenshot below showcases how the image created with this code snippet is displayed in the Comet UI.

Example Image Panel with regions
The example image with regions accessed from the Graphics tab
Apr. 29, 2024