Analyze your Experiments
Comet makes it easy for you to track your training runs by both automating as much of the logging of metrics as possible thanks to our integrations and by making it easy to both deep-dive into a specific training run but also by making it easy to compare experiments.
In this documentation we will cover the following functionality:
- The Single Experiment Page: This page is used to view Experiment results in detail.
- The Project Panels Page: This page is used to compare many training runs to one another.
- Experiment diffing: This functionality allows to diff up to 4 experiments to better understand what exactly has changed.
Single Experiment Page
The Single Experiment Page allows you to view all the data that has been logged for a training run which includes metrics, parameters but also images or weight embeddings for example. If you want to learn more about this page, you can find the full reference documentation for this page here.
To navigate to the Single Experiment Page you can either:
- Use the link provided by the Python SDK at both the beginning and end of an Experiment.
- Go to www.comet.com, navigate to the project that contains your Experiment, navigate to the
Experimentstab to view all the Experiments logged to this project. You can now click on the Experiment name to go to the Single Experiment page.
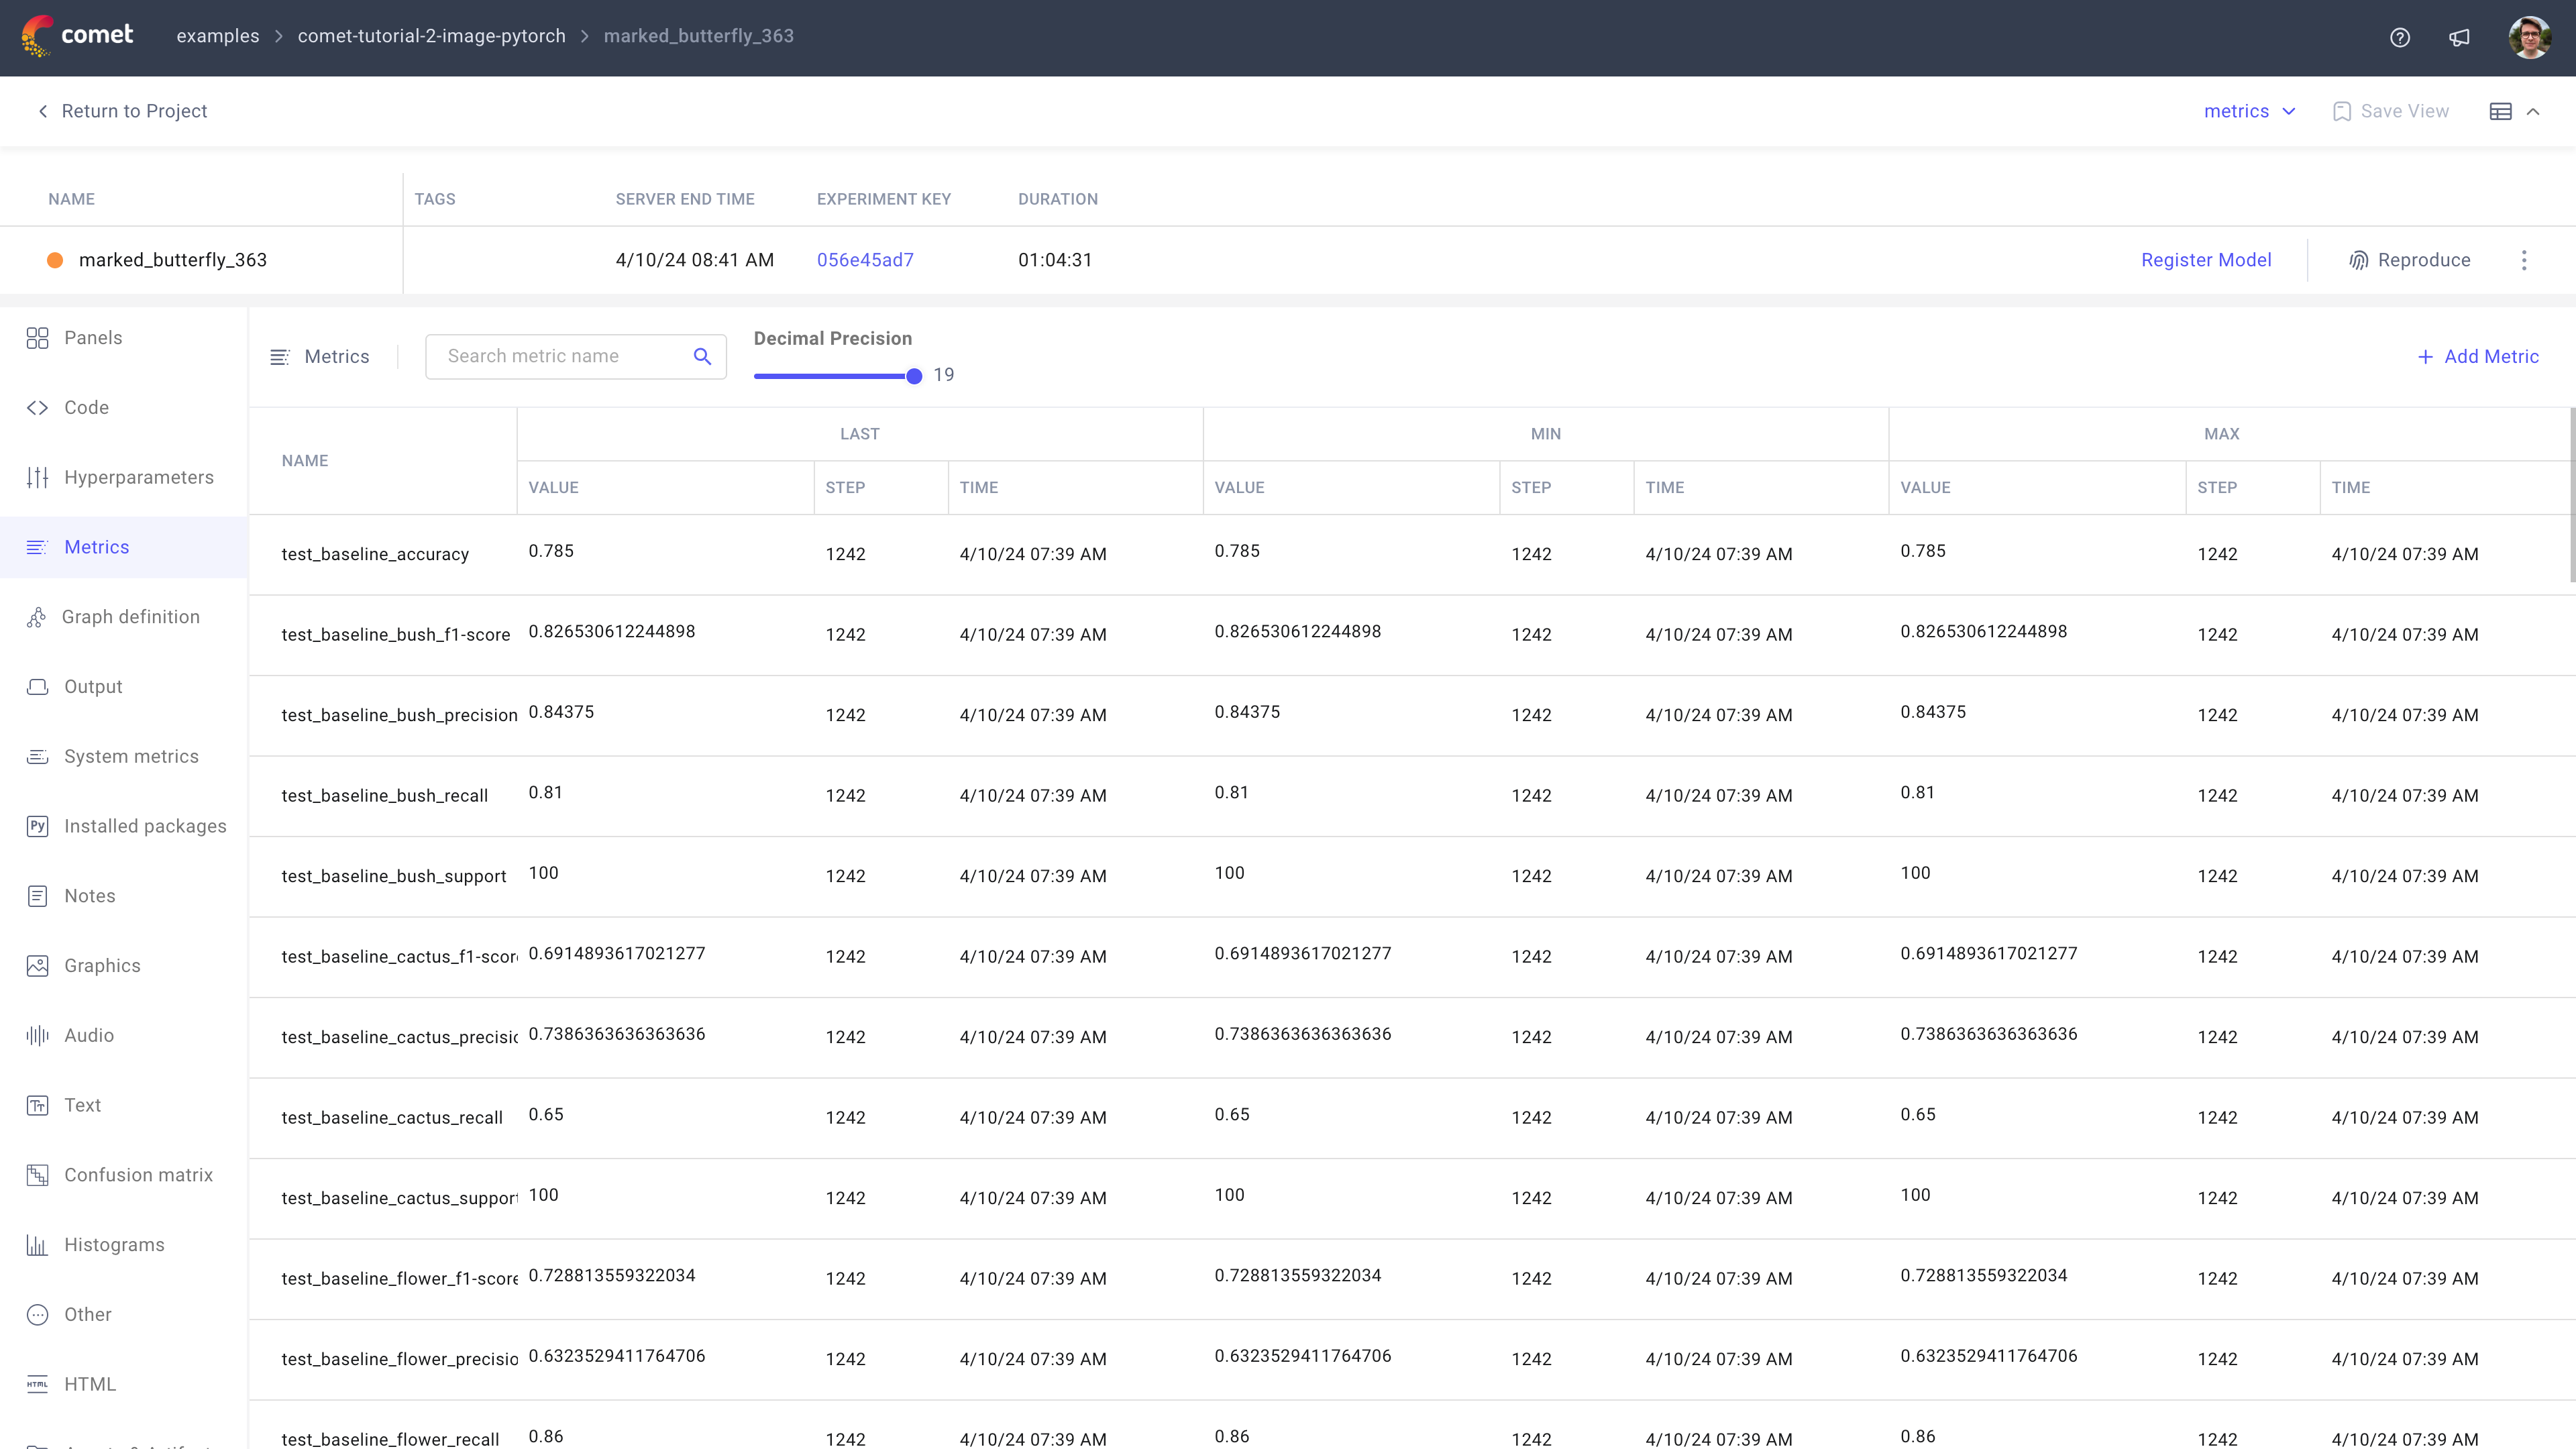
In order to make it easier for you to both view and analyze the data logged for each Experiment, we have created a tab for each of the data types that have been logged. The most commonly used tabs include:
- Panels tab: Used to visualize logged curves and metrics by step, epoch or time elapsed.
- Metrics tab: Used to view a summary of all the metrics logged.
- Hyperparameters tab: Used to view a summary of all the parameters logged.
- Output tab: Used to view the console logs for the training run
- Graphics tab: Used to view the images or videos logged.
- Confusion Matrix tab: Used to view the confusion matrix logged.
Project Panels Page
The Project Panels Page can be used to compare up to 100 training runs to one another using either one of our built-in visualizations (line charts, bar charts, parallel coordinates chart, etc) or your own visualization written in Python using a Python Panel.
To navigate to the Project Panels Page, you can either:
- Use the
Back to Projectbutton in the Single Experiment Page. - Go to www.comet.com, navigate to the project that you wish to view.
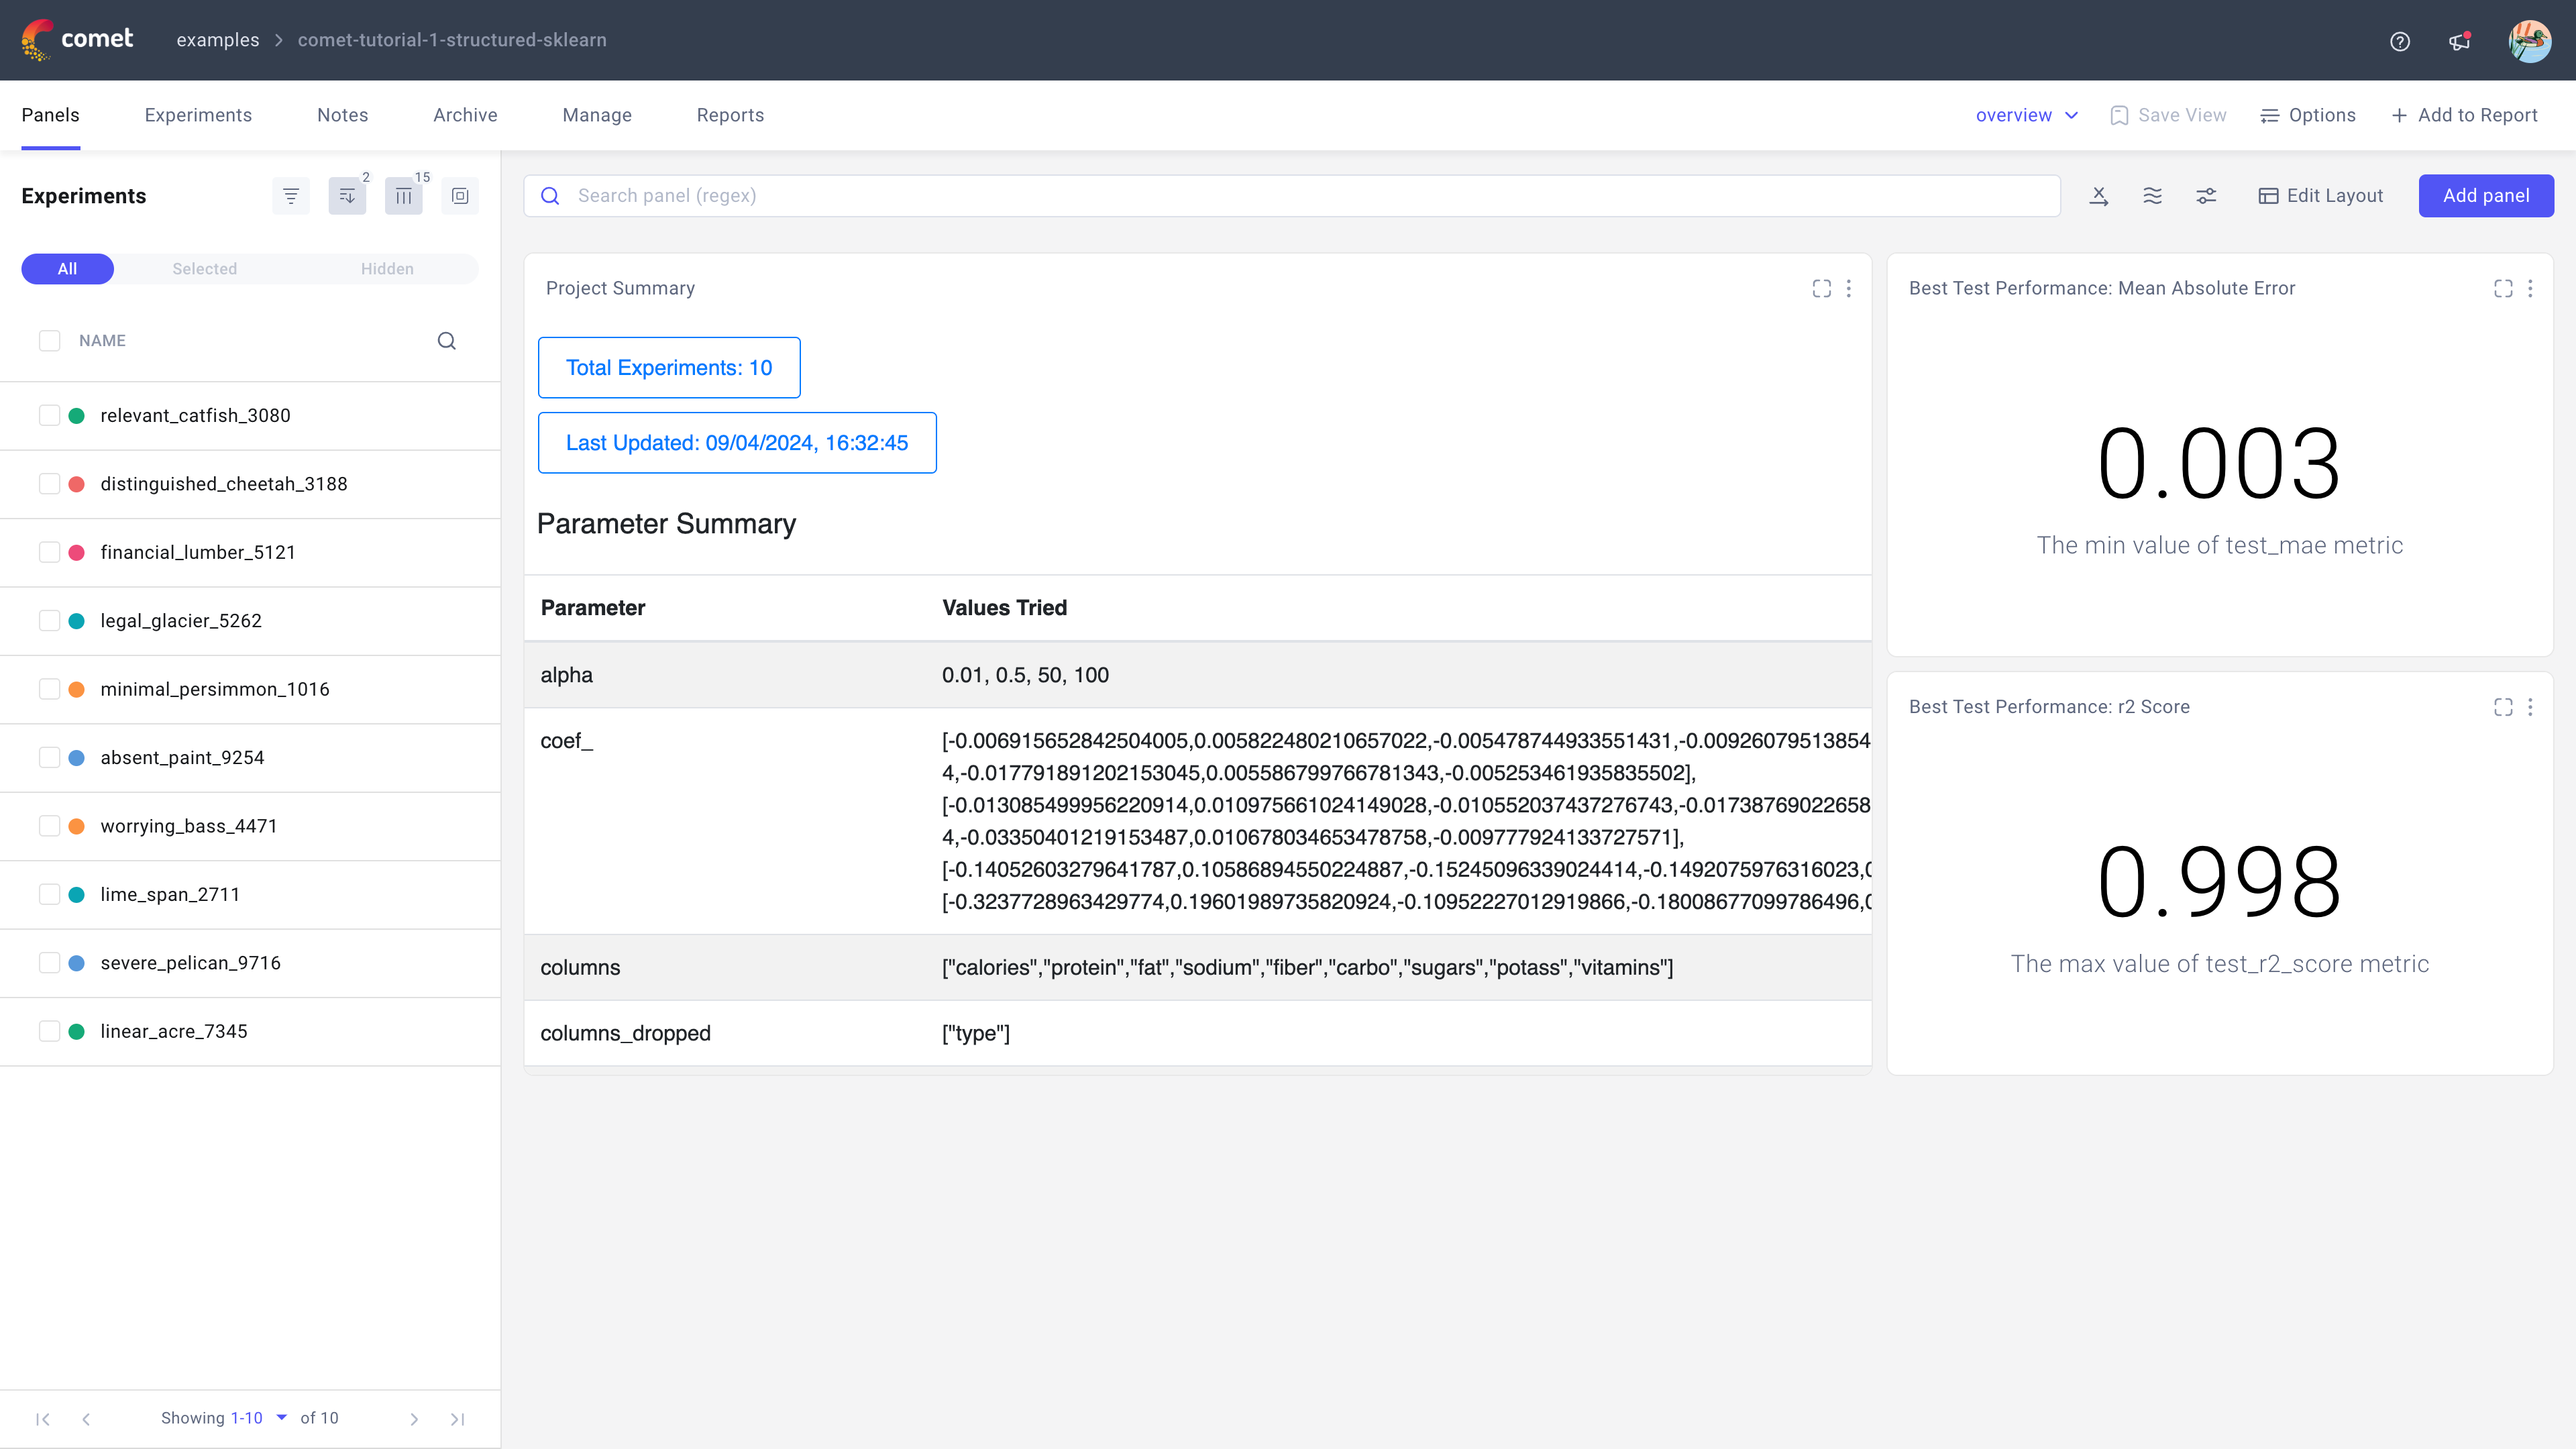
By default Comet will show a panel for each of the most common metrics in the project allowing you to compare the performance of many Experiments to one another. To view more metrics or to add your own visualizations, you can use the Add panel button.
You can also filter, sort and group your Experiments for the Project Panels Page allowing for a more thorough analysis.
Diffing Experiments
The Project Panels Page is useful when you want to compare metrics from multiple training runs. However it can make it hard to understand the differences between two different or more training runs. For this you can use Comet's diffing functionality.
To diff up to 4 Experiments, first select the Experiments you would like to compare from the Project Panels Page or the Project Experiments Page. You can then use the Diff option in the blue action bar that appears at the bottom of the page.
Once you enter the diff mode, you will see a similar page to the Single Experiment Page except this time, each tab will allow you to compare your Experiments side by side.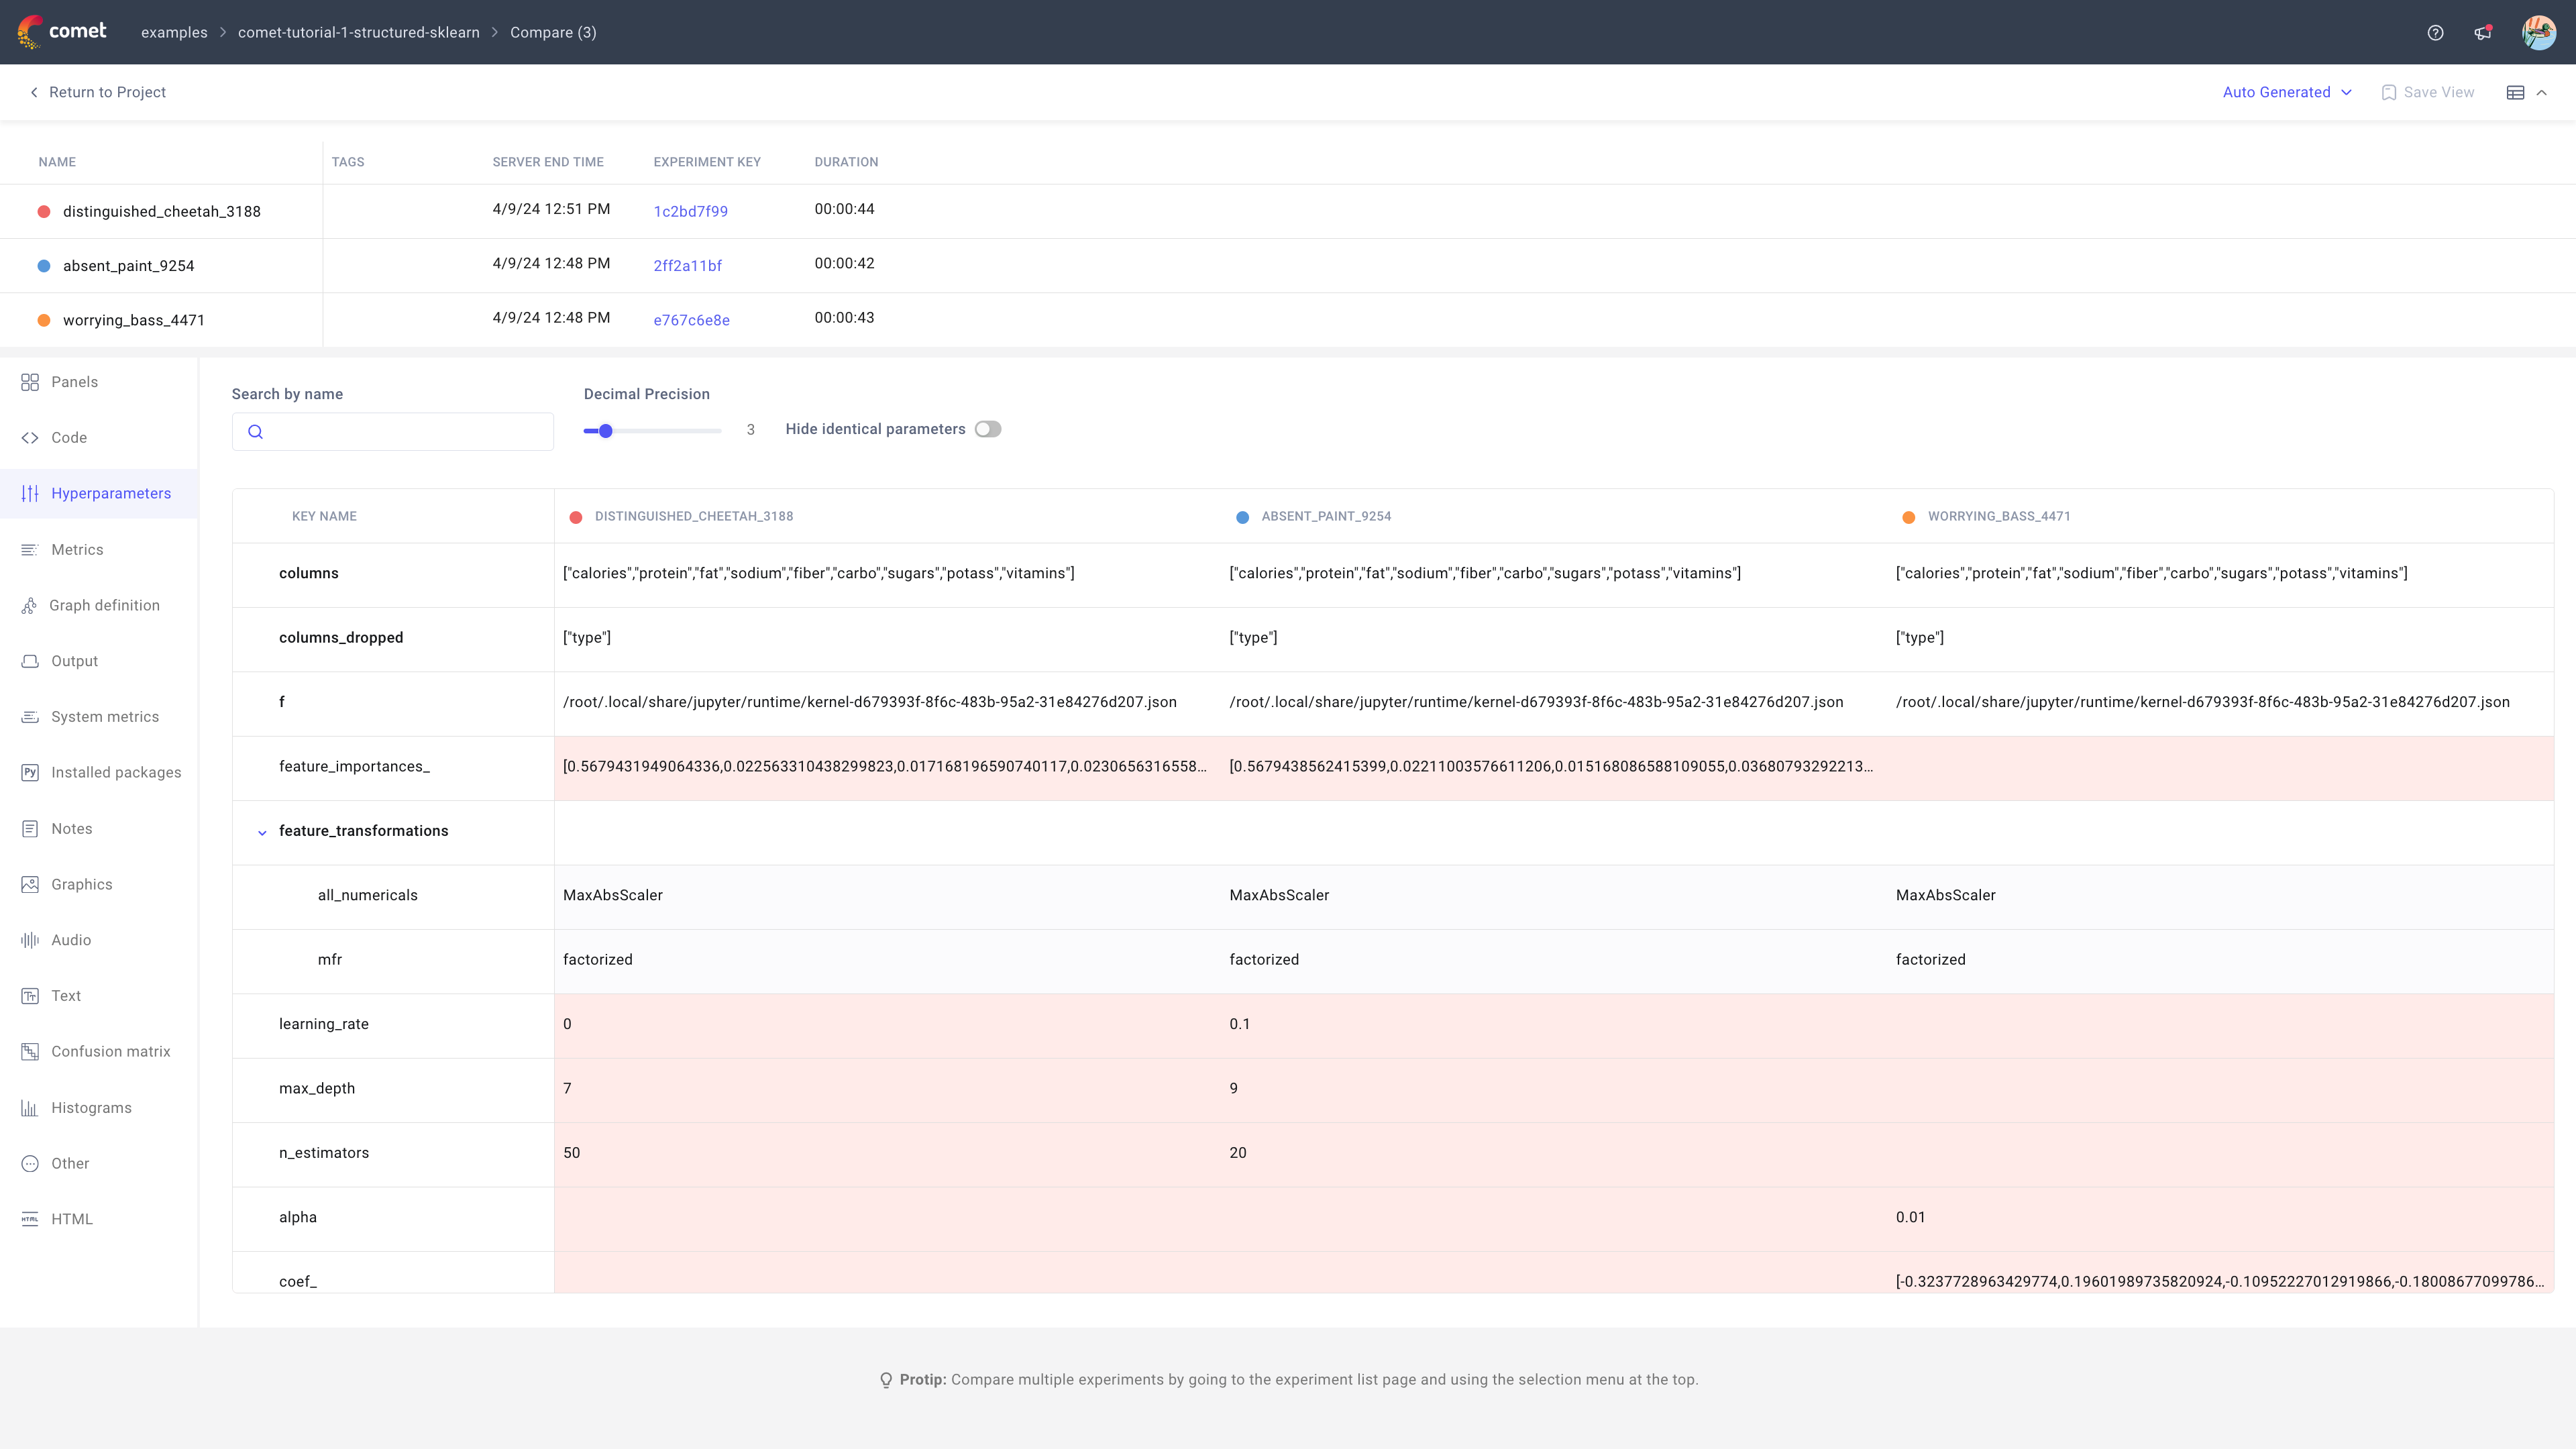
The most commonly used tabs in diff mode include:
- Hyperparameters tab: Allows you to view the parameters that changed between Experiments.
- Code tab: Allows you to compare the code for each training run.
- Installed packages: Allows you to view any changes in your Python dependencies.
Note
If you would like to view more code files in the Code tab, you can log these files using the log_code() method.