Comet Platform
The powerful and intuitive Comet UI makes it a valued workbench among many ML teams for managing and tracking their research.
Automatic and dynamic reporting: from Artifacts, to Experiments, Models and Production Monitoring, all Comet products automatically report and update artifacts, metadata, visualizations and pipelines to the UI. This functionality ensures that ML teams get full lineage and tracking across the ML lifecycle, without having to query databases or set up manual and static visualizations. Everything happens automatically.
Collaboration: Comet’s UI is shared across Organizations and can be broken down into Workspaces, allowing companies to easily manage research in one, central place.
Customization: Comet is built API-first and provides a code-based visualization builder that ensures that teams can create any visualizations or integrations they need without waiting for Comet engineering cycles.
Comet concepts
The Comet platform is built around several foundational concepts. Get to know these before you begin to work with the UI.
| Term | Definition |
|---|---|
| Organization | The top level of a Comet account. It contains one or more workspaces. Each user belongs to one and only one organization. Billing is done at an organization level. |
| Workspace | A collection of projects, used to manage user access to projects. It is often used to differentiate between teams. Within each organization there are a number of workspaces that are used to manage user permissions within an organization. They often map to teams within a company, but not necessarily. Models and datasets are available at a workspace level. Workspace names are globally unique. |
| Project | A collection of experiments. A project is often used to differentiate experiments per use case. Within each workspace, users can define projects that are used to manage each modeling project. These projects are a group of machine learning training runs. |
| Experiment | A unit of measurable research that defines a single run with some data, parameters, code, and results. |
| MPM | Model Production Monitoring - a Comet feature that allows you to track models in production. MPM is a custom feature. To enable it, contact our sales team. |
| Artifact | A set of assets represented as a folder that can be sorted and versioned in Comet. |
| View | Each project can have multiple views that correspond to different dashboards. |
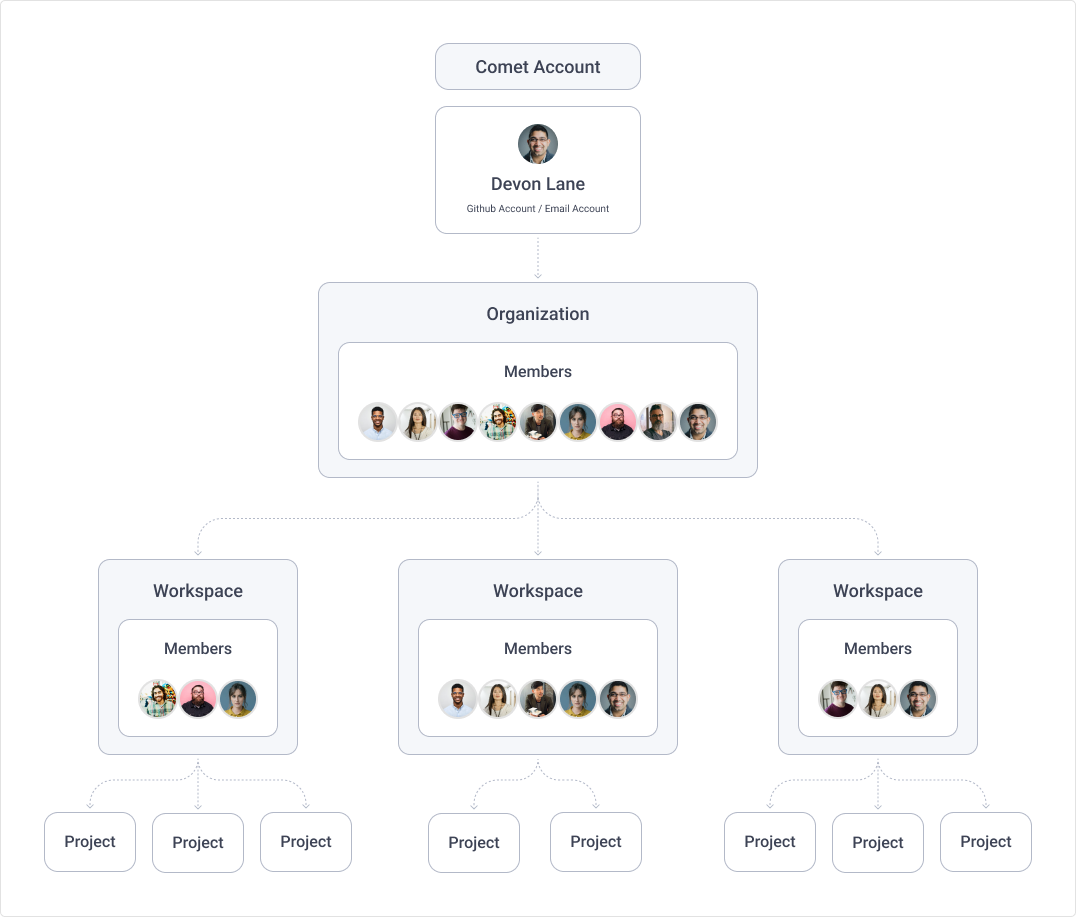
Organizations
An Organization contains one or more workspaces.
A default organization is created on user signup. From the admin dashboard, an admin can edit the organization name, invite other users to the organization and remove them from the organization.
Learn more about the Admin dashboard.
Workspaces
A Workspace is a collection of projects.
When you first create your account, Comet creates a default workspace for you with your username. This default workspace contains your personal private and public projects. In addition, you can create additional workspaces, where each workspace can have its own set of members.
The default workspace is used in two main ways:
- Comet Dashboard: When you first log in you will be sent to your default workspace. You can always change the workspace using the dropdown in the user menu or on the project list page.
- Comet SDK: When logging an experiment to Comet specifying the workspace that the experiment should be logged to is optional. If you don't specify one then the experiment goes to the default workspace, otherwise it goes to the specified workspace.
A Workspace has four tabs:
- Projects: Visualizes the performance of machine learning training runs.
- Model Registry: Visualizes trained models and manage their deployment.
- Artifacts: Tracks and versions large datasets.
- Model Production Monitoring: Tracks the performance of models deployed to production.
Note
You can allow collaborators on your personal workspace and create private projects byupgrading your plan. If you ever have any questions, feel free to send us a note at support@comet.com or on our Slack channel.
View a workspace
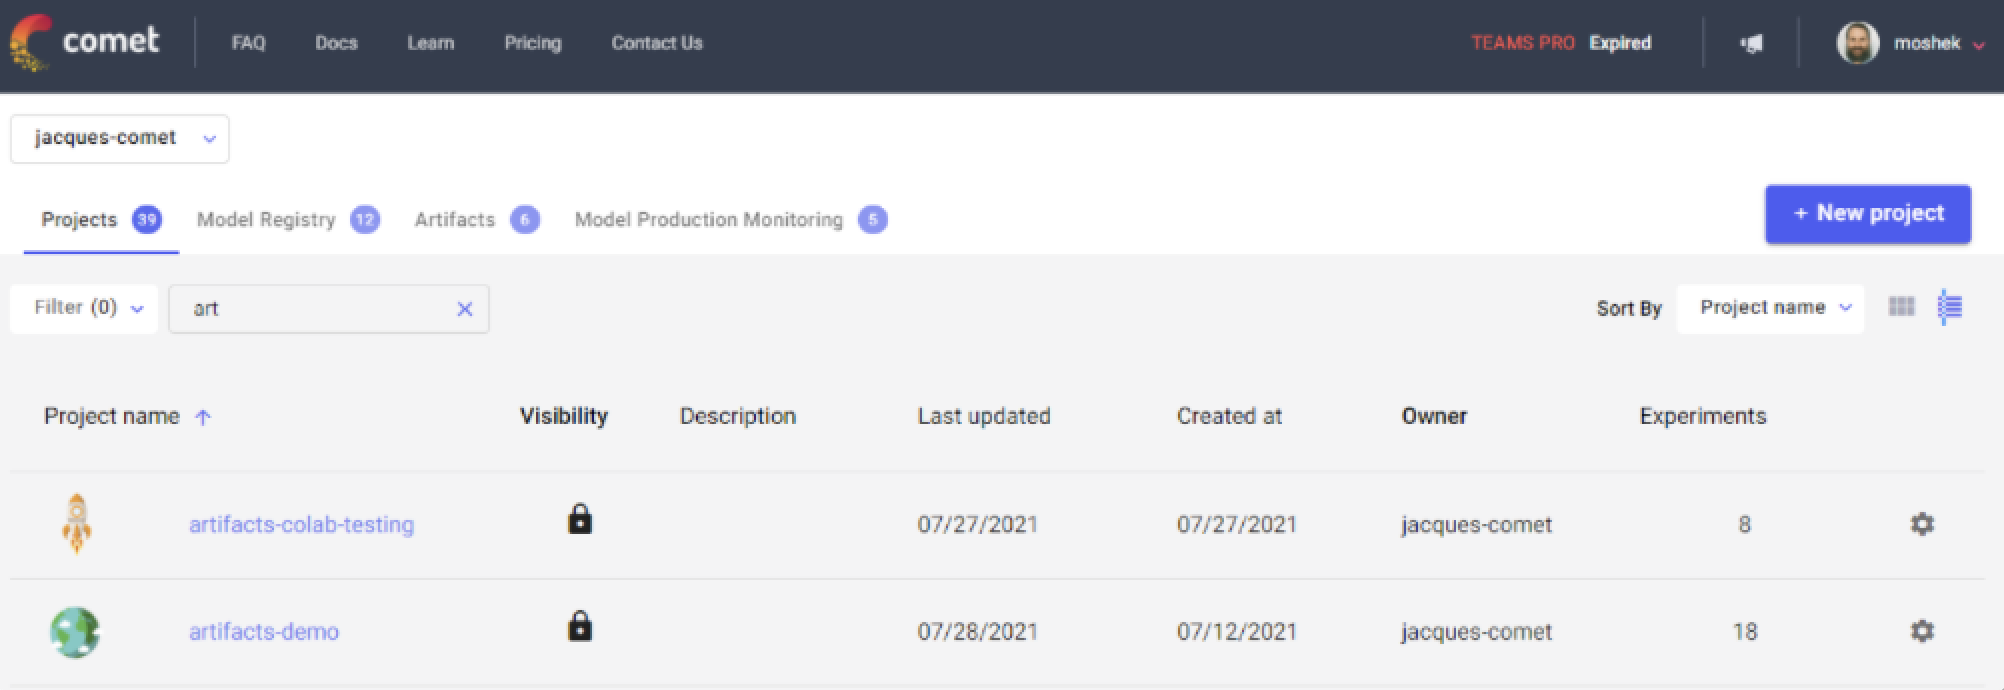
The Workspace can be displayed as either a grid of Project cards, or as a list.
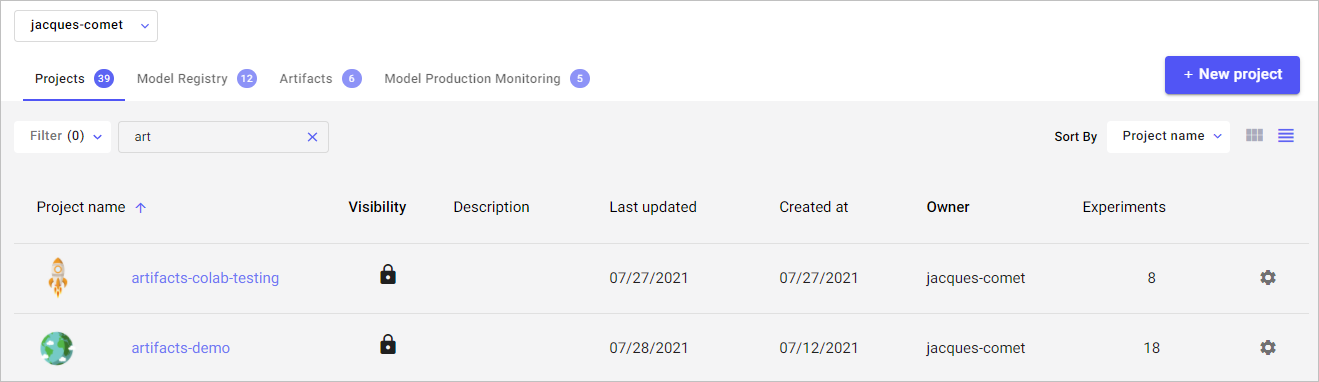 Workspace: Project list view
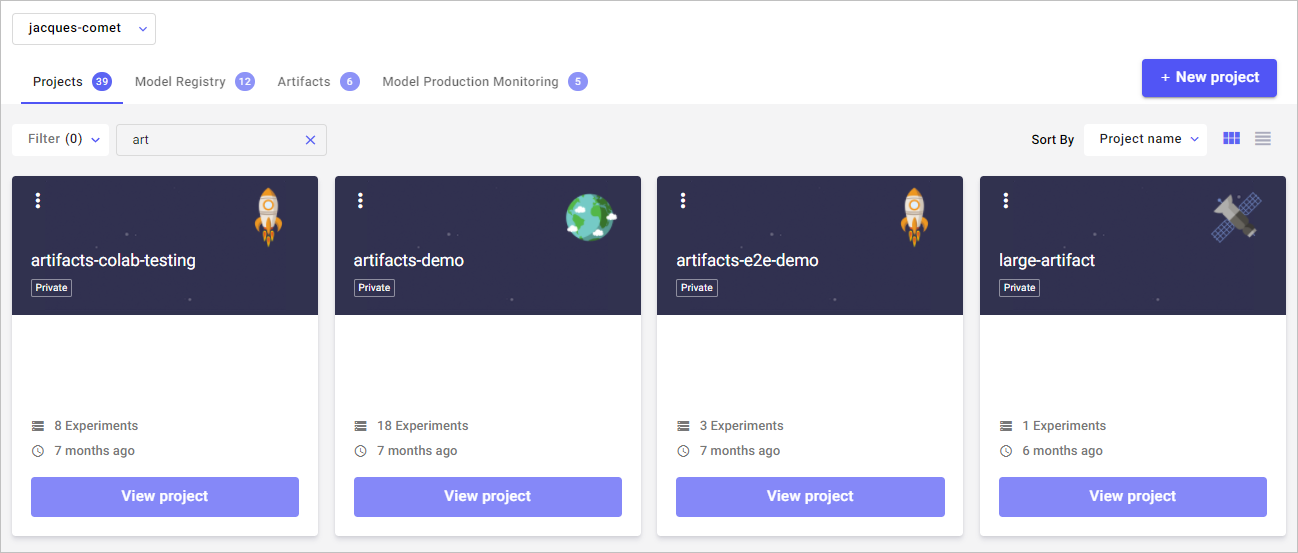 Workspace: Project card view
In both views, you can:
- Filter projects by owner or visibility (public or private) or category.
- Search projects by name or description.
- Sort projects by name, description, last updated, experiment counts, or creation date.
In the Project list view, a configuration button in the right-most column lets you:
- Edit a project's name, description, or visibility (public versus private).
- Delete a project.
- Share a project.
- Change the project's icon image.
In the Project grid view, these options are accessible through the vertical ellipsis in the upper-left corner of each card.
Projects
A Project is a collection of Experiments.
A Project is either private (viewable and editable by all collaborators with the proper permission level) or is public (editable by the owner, and viewable by everyone). You can set a project’s public or private visibility under the Manage section of the Project view.
View Projects
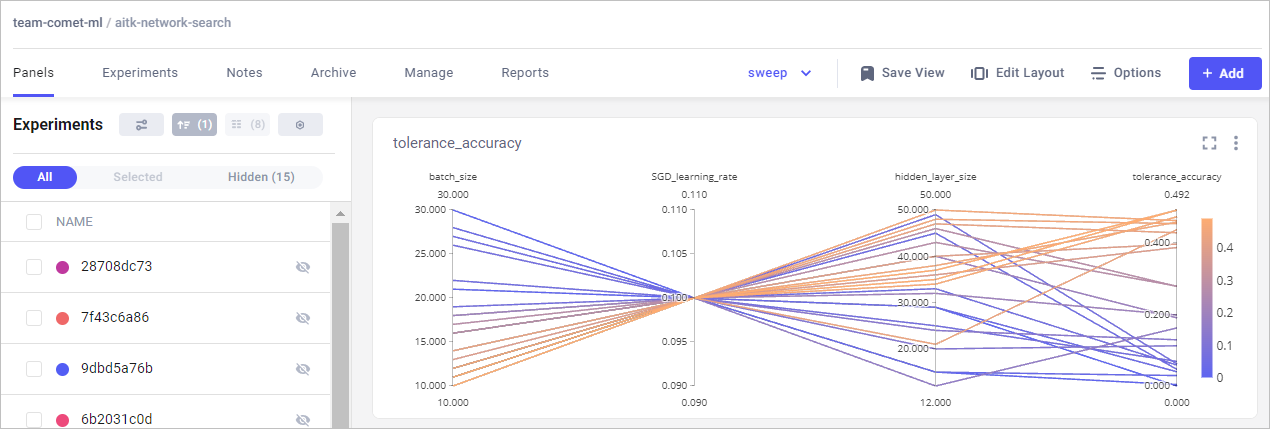
The Project view is your primary working area. Here you can manage, select, an analyze all, or subsets, of the project’s experiments.
The Project view contains tabs to manage your project’s artifacts including:
- Panels: Visualizations of important metrics that are used in your Experiments. Visualize Project data with Panels describes how you can add visualizations that serve your needs.
- Experiments: Displays the Experiment table.
- Notes: Allows you to make notes in this project.
- Archive: Shows all experiments for this project that have been archived. From here, you can permanently delete or restore an experiment or group of experiments.
- Manage: For managing Projects. See below for more details.
- Reports: Shows all the reports for this Project.
The Project view also presents the following useful shortcuts:
- Current Project view name. If you are using the default view generated by Comet, Auto Generated is displayed. Click to display a list of possible views.
- Save View lets you turn changes in your current Project into a custom Project view. For more, see Create Project views.
- Edit Layout lets you customize the size and position of the panels.
- Add lets you add an experiment, report, or panel.
- Options provides a shareable URL for this project, and controls for decimal precision and auto refresh.
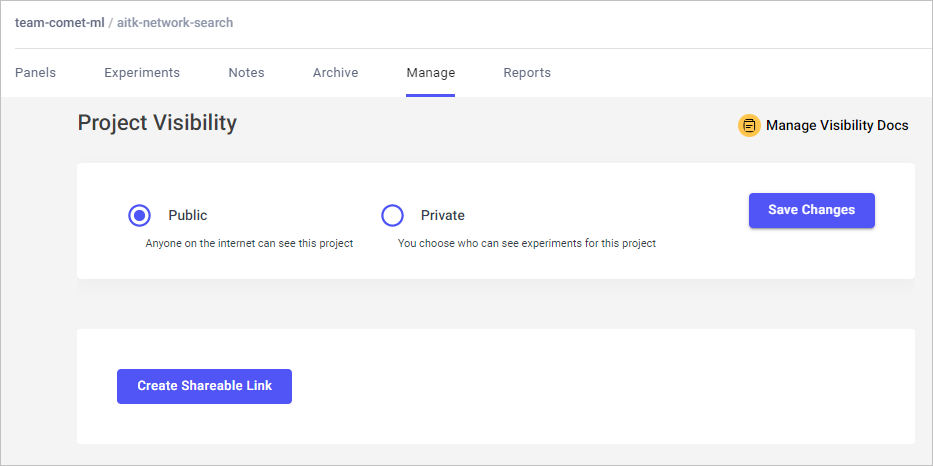
Manage Projects
The Manage section allows you to control a project's visibility. Here, you can make a project public (anyone can see the project) or private (you choose who can see the project).
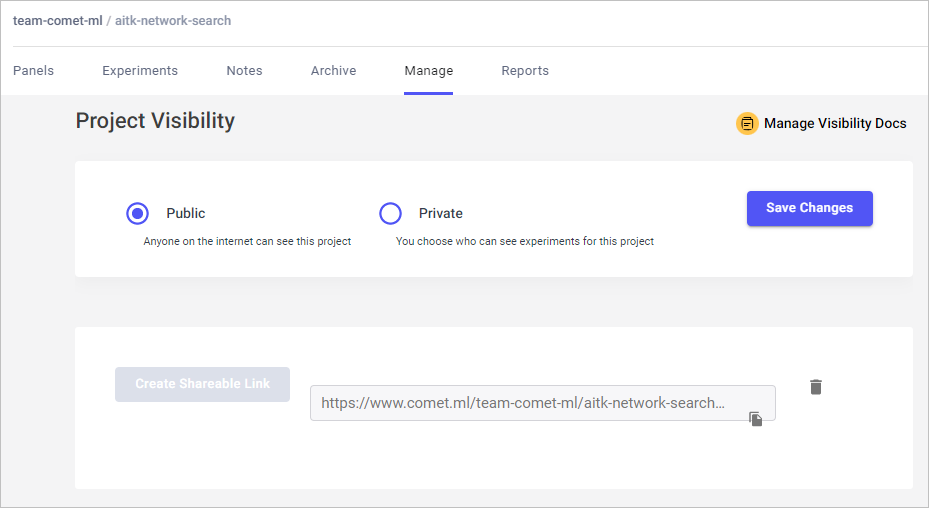
By clicking Create Shareable Link, you can create a link to the project. The link works, even if a project is private. Each project can have a single, shareable link.
At any time, you can delete a shareable link by clicking the recycle icon next to the link.
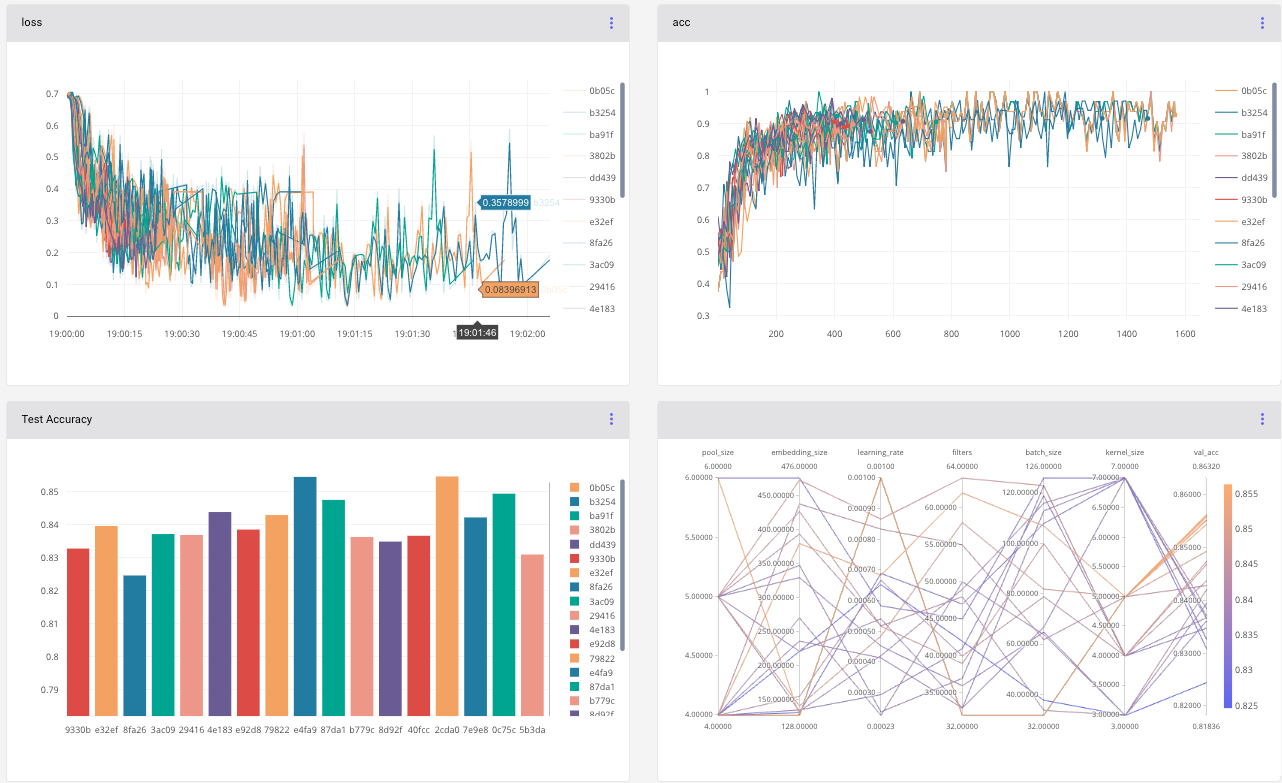
Visualize Project data
Project visualizations allow you to view and compare performance across multiple experiments. Comet supports many types of visualizations, including line charts, bar charts, scatter charts, and parallel coordinates charts. In addition, there is an entire marketplace of additional reports, exporters, and tools available in the Comet Panel Gallery.
Note
The Panels in the Project view page are editable. If you wish to change an aspect of a panel, click the three vertical dots in the top right of the panel and select Edit Panel.
Experiments
An Experiment is a unit of measurable research that defines a single run with data, parameters, code, and results. Creating an Experiment object in your code reports a new experiment to your Comet project. Your Experiment automatically tracks and collects many items and also allows you to manually report anything.
For more information on how to log experiments to Comet, see Quick Start.
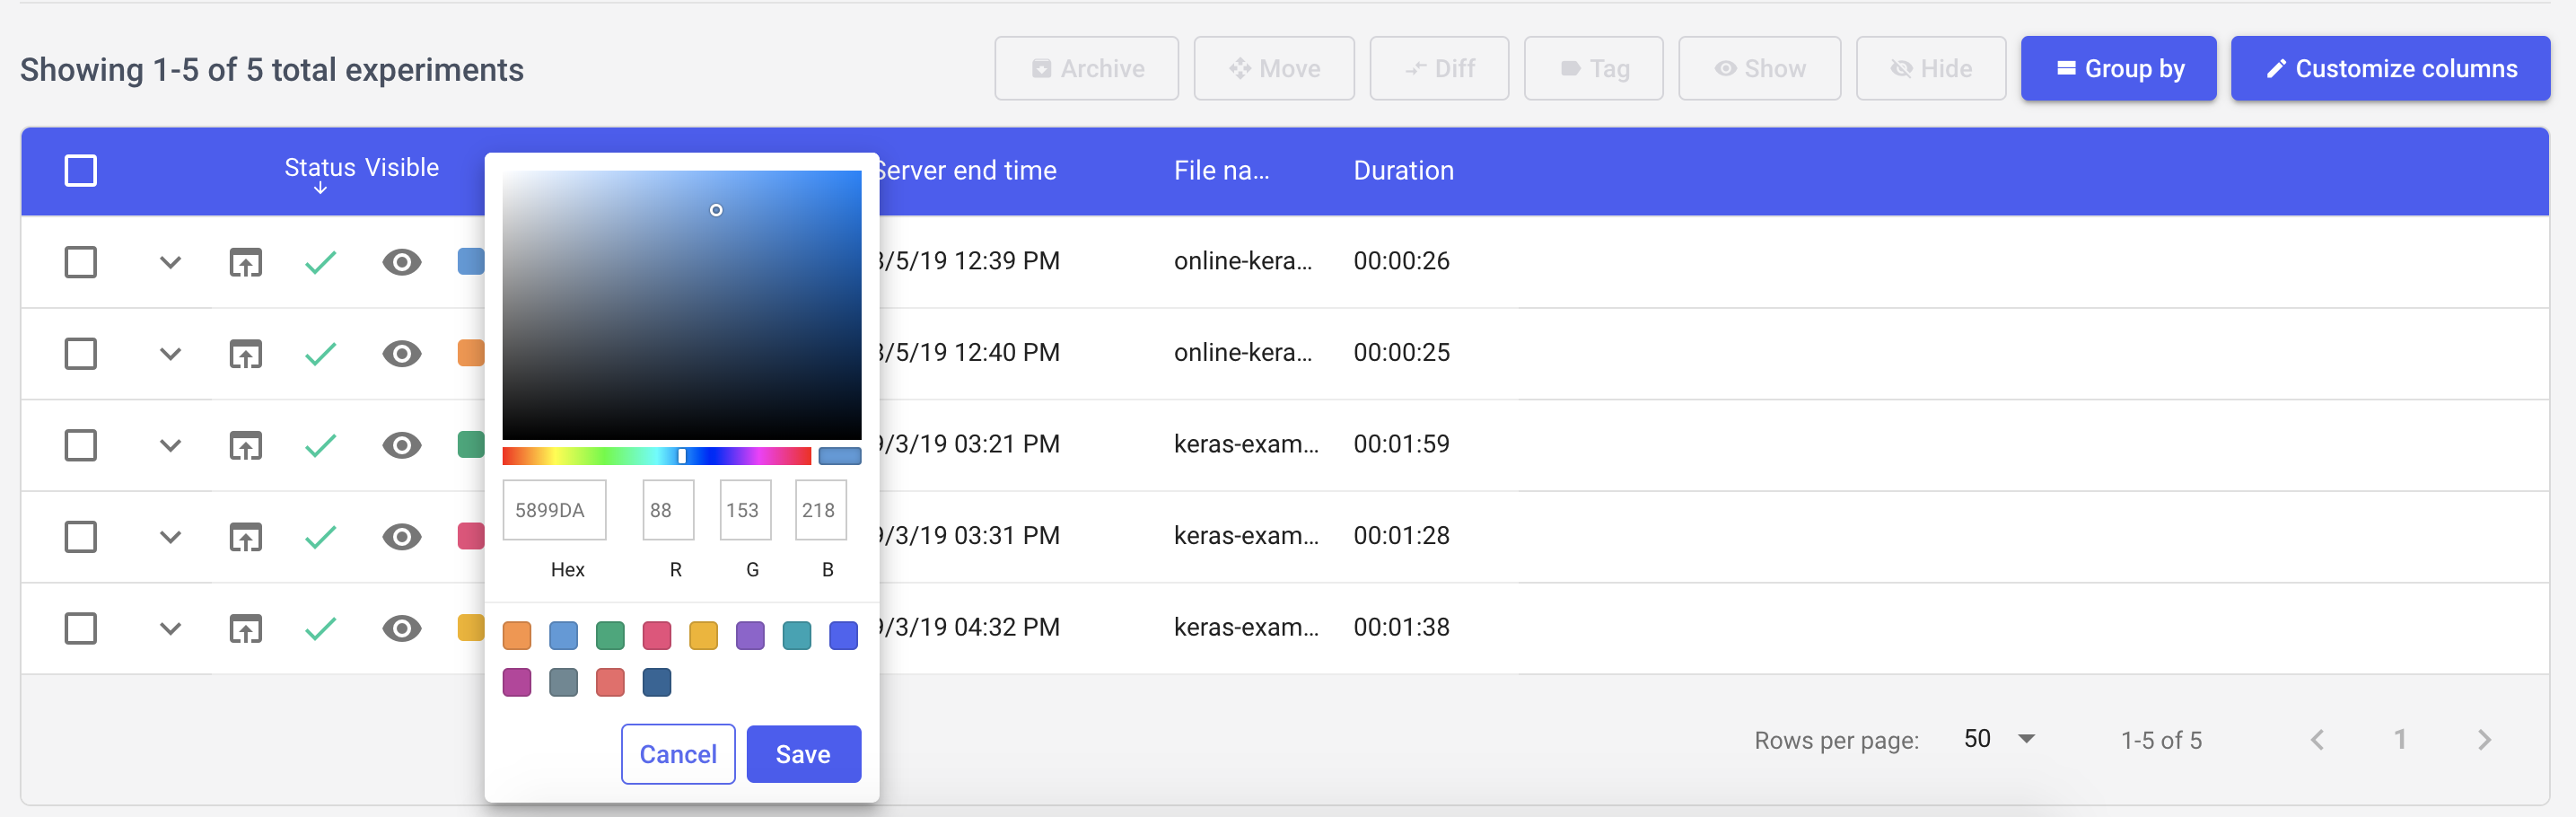
Experiment table
The Experiment table is a fully-customizable tabular form of your experiments for a given Project. The default columns are: Checkbox, Status, Visible, Color, Tags, Experiment key, Server end time, File name, and Duration.
You can update the Experiment table with additional columns.