Logged Curve
A logged curve displays data points consisting of a pair of x-axis and y-axis values.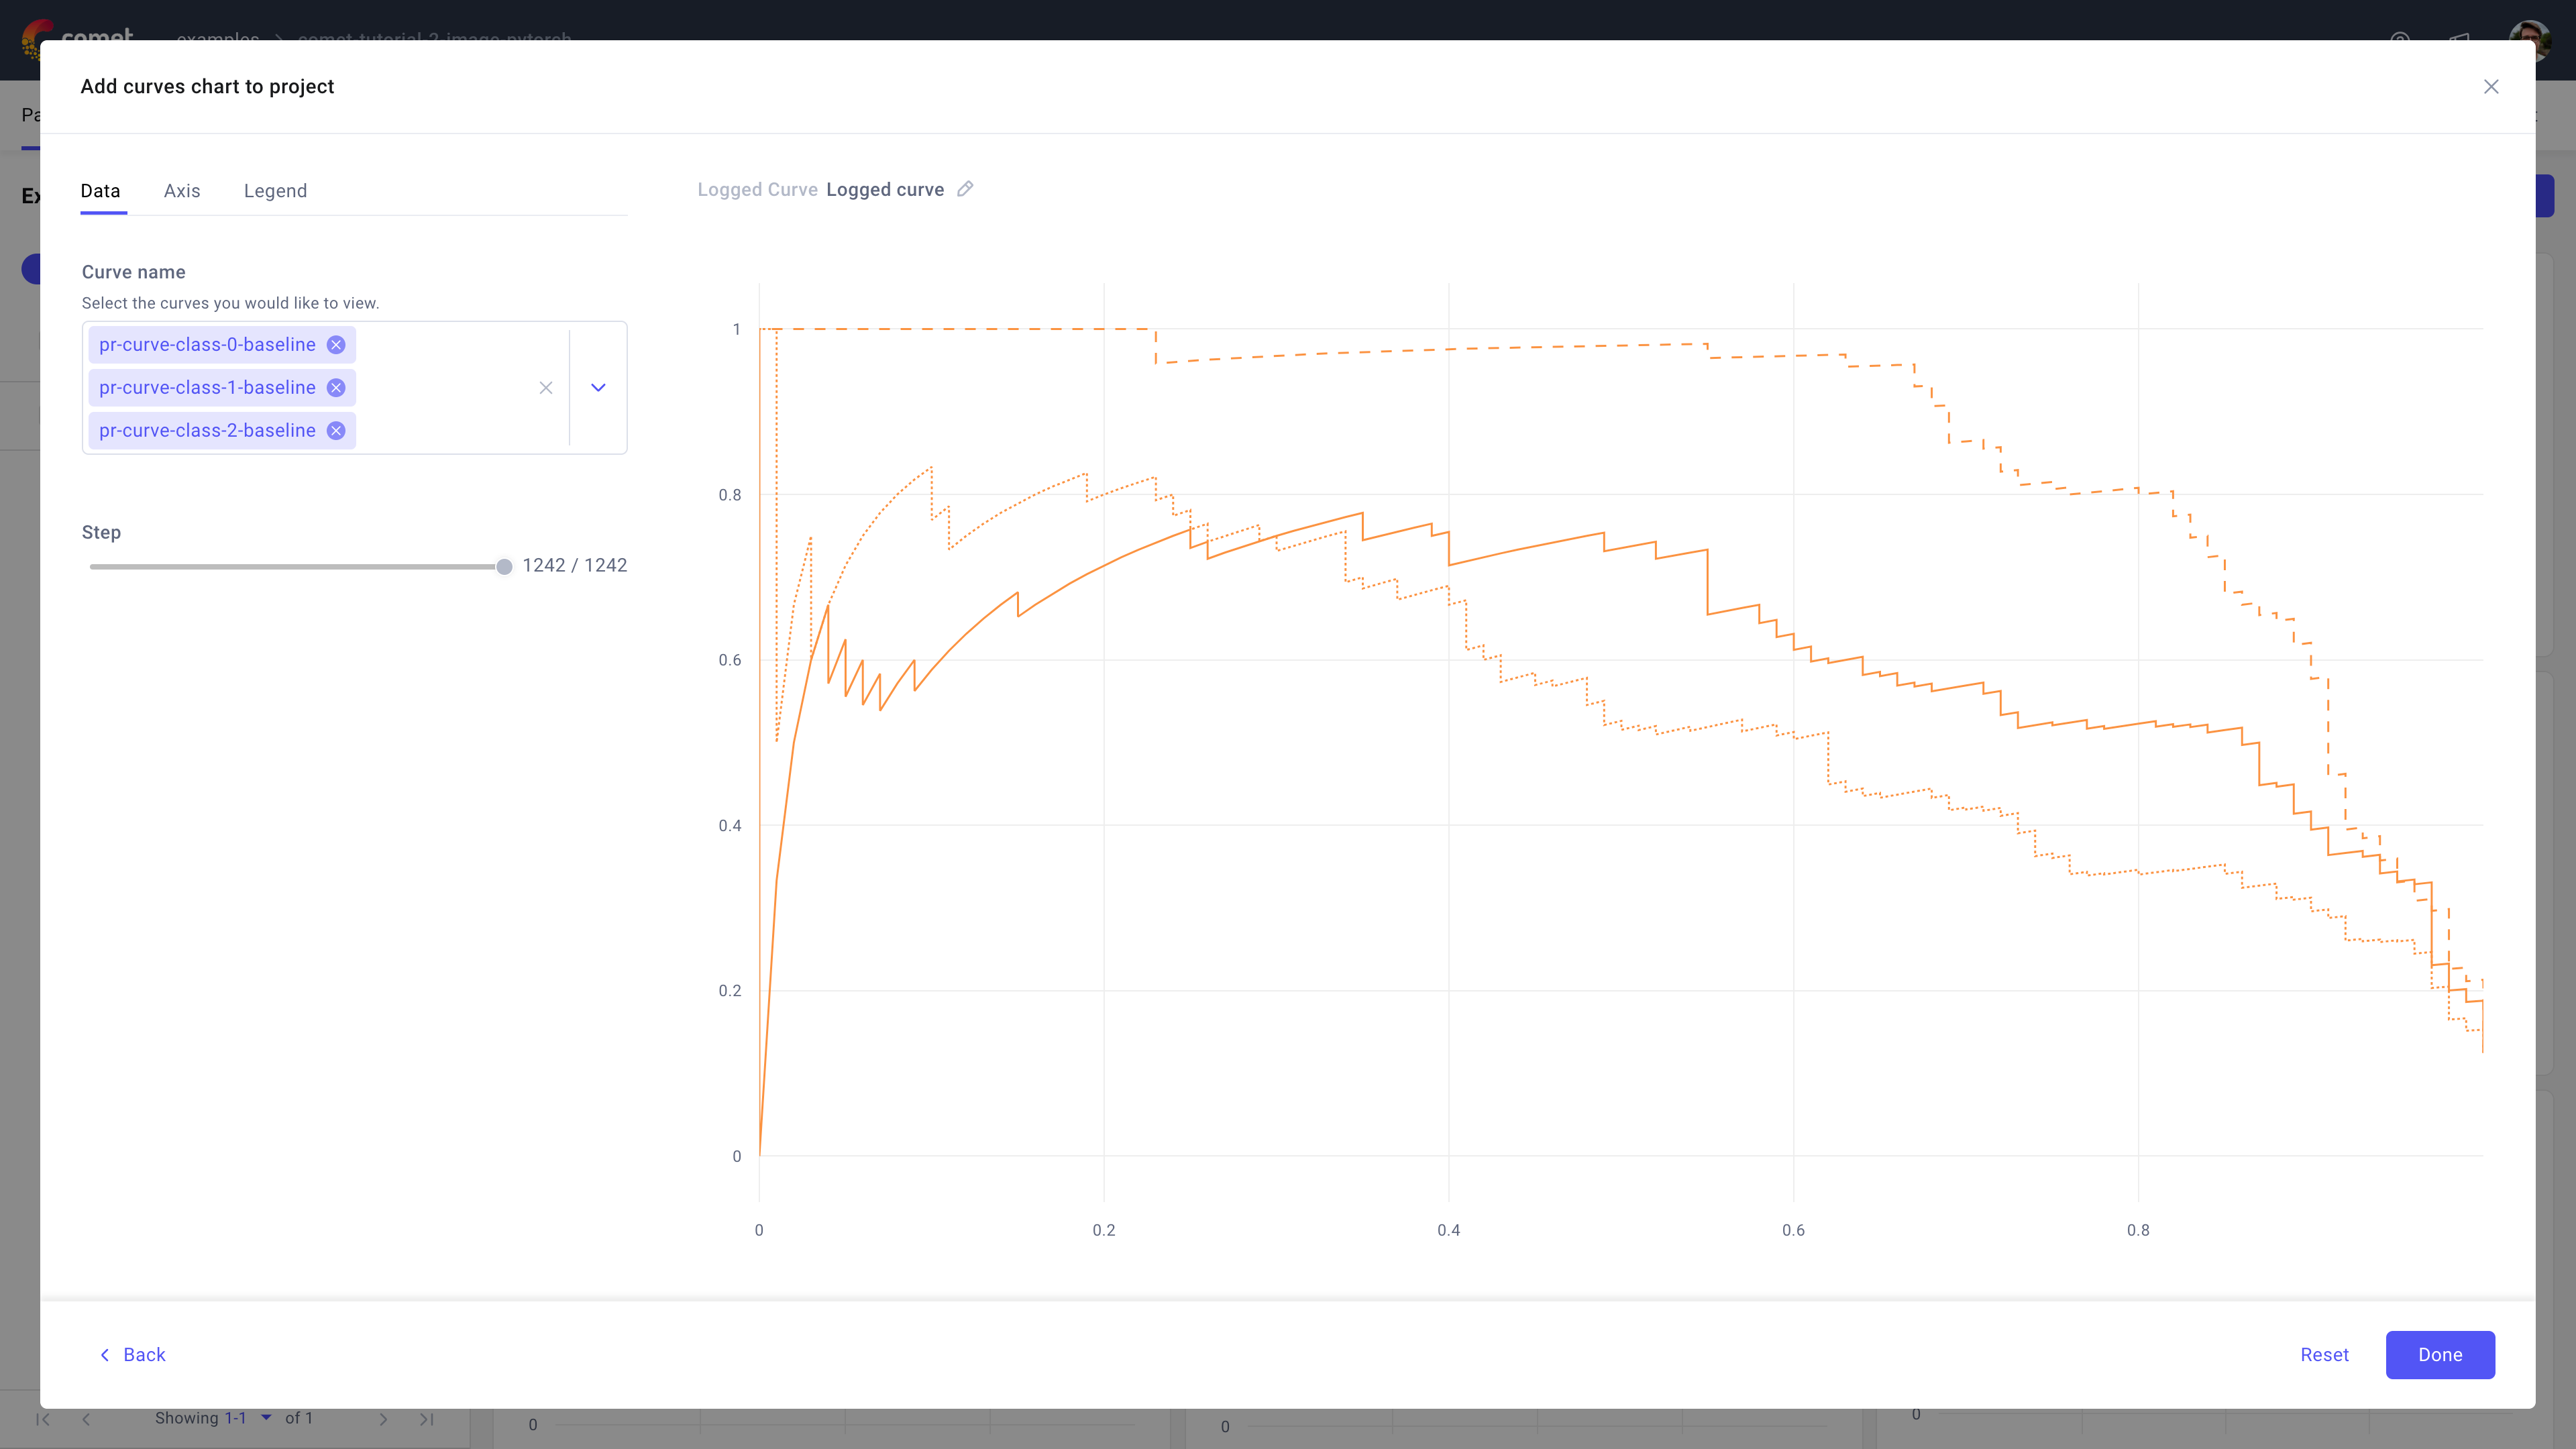
Use the logged curve in Comet to view and interact with curves logged via the log_curve() method across experiments, steps, and different models.
Note
If the data your are looking to log is per step or per epoch, we recommend using Experiment.log_metric() and the line chart.
About the Configuration Sidebar
The Configuration sidebar consists of three tabs:
Data: Define the curves to visualize in the panel.
Curve name: Select the curves to display in the panel by name.
You can type the curves filename in the Search bar or select it from the dropdown list.
For example, if you logged curve1.json in 2 different experiments across 5 different steps, your search result will still only return one result for curve1.json.
By selecting that curve, you can view its permutations in the panel.
Note
You can always look up saved curves for the project by opening an experiment, selecting the Assets & Artifacts tab, and exploring the curves/ folder.
Step: Define how to move through the steps related to your selected curves.
Note that some curves may be logged in some steps but not others - in those cases, the panel will not display a curve since none was logged.
Axis: Define min and max value for either or both X and Y axis.
Legend: Decide whether or not to display up to 3 legend keys in the chart.
The selected legend keys are appended in order and separated via a "-".
By default, the panel does not display the legend and suggests using the experiment name only.
Also, you can select the Max number of experiments to show on chart tooltip and Comet will display only the top X experiments from the left legend, including the hovered one. You can always filter, sort, select, or pin experiments.
About the Panel Preview
The panel allows you to interactively analyze the lines at each X-axis step.
When hovering on any (imaginary) vertical line rooted at an X-axis step, the panel displays the dotted vertical line and the Y-axis value for each line.