Data Panel
A data panel is a structured display of raw textual and numeric data in a tabular format.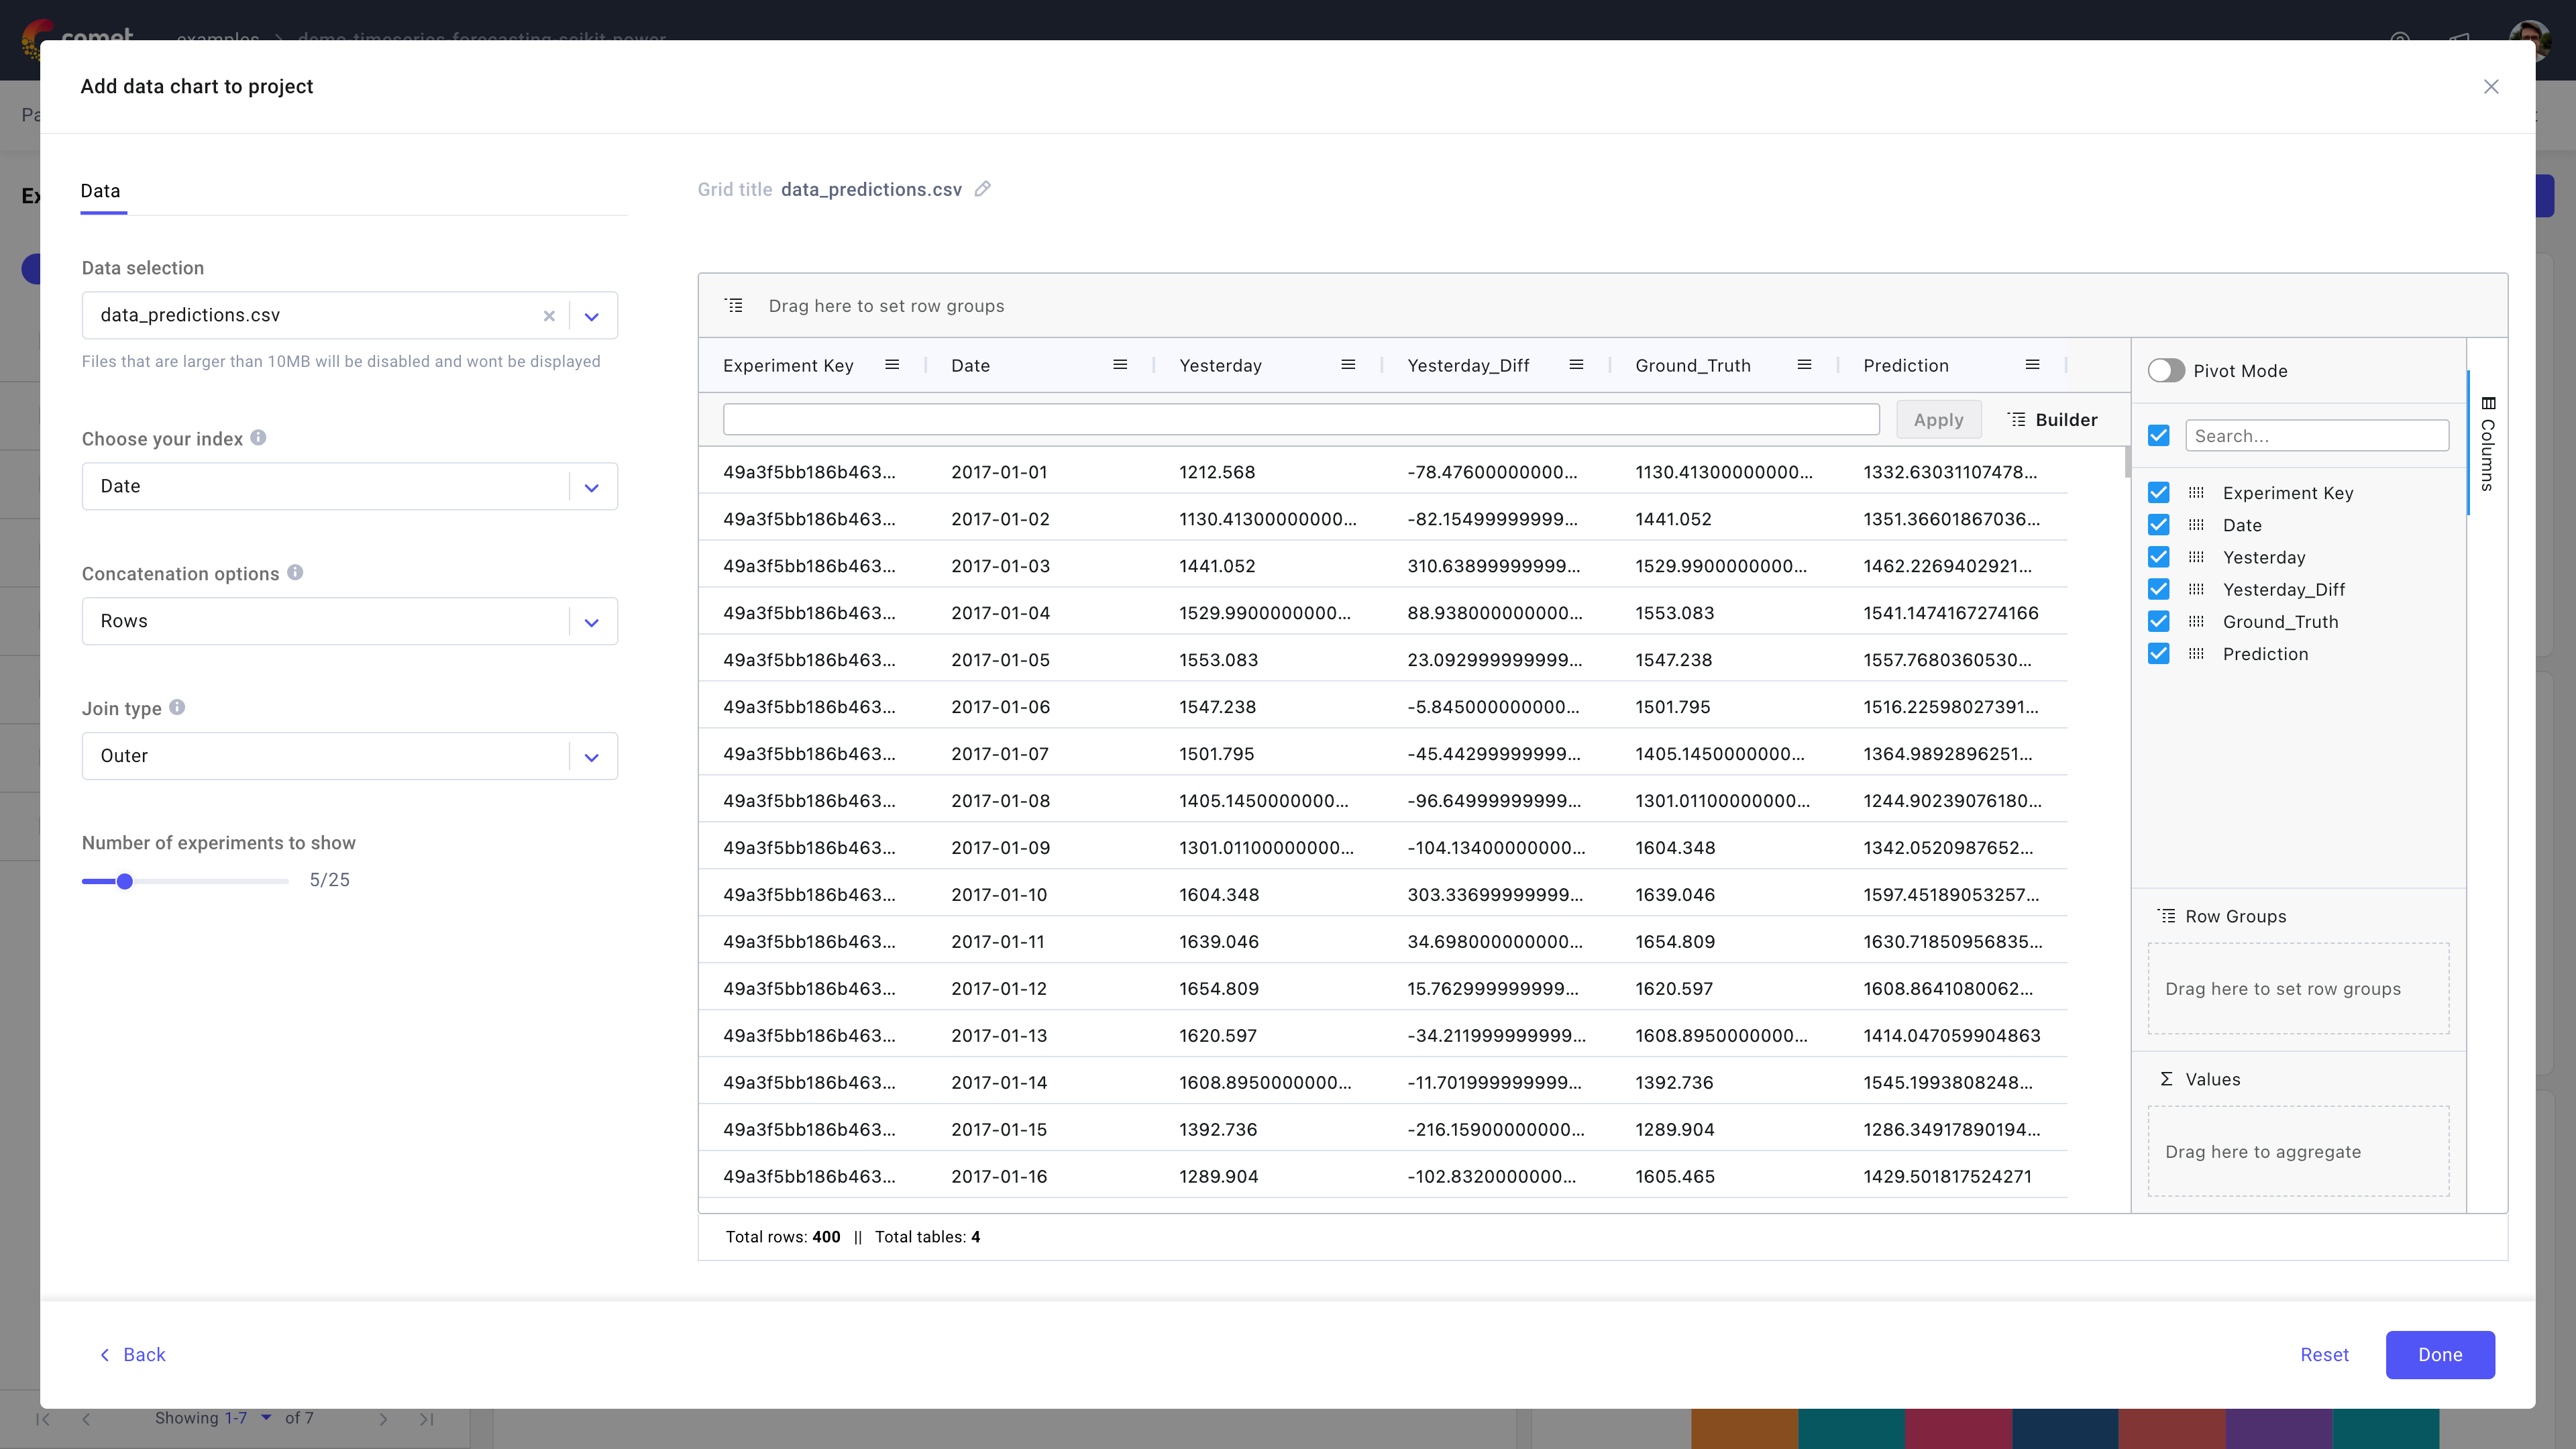
Use the data panel in Comet to view and interact with any tabular data logged via the log_table() method, and even use any filtered data output in your custom panels.
About the Configuration Sidebar
The Configuration sidebar consists of one tab:
Data: Select what to display in the table.
Note that the panel provides you with a view over the data across all experiments where it is logged; hence, the panel needs to concatenate the data across experiments, following the same logic as the pandas.concat() function.
Data selection: Select the desired data amongst any data logged during experimentation.
You can type the data filename in the Search bar or select it from the dropdown list.
Warning
It is important to use the same file name across your experiments since that is how the data is joined.
For example, if you logged mnist_data.csv in experiment_1 and in experiment_2, you will see a single choice to select mnist_data.csv in the data panel and then the panel will read both your logged csvs, join them according to the specified configuration, and visualize them as a single table.Chose your index: Define the column to use as index for the join.
Concatenation options: Choose between joining the selected data on columns or rows.
When joining by rows, Comet will append an experiment_id column specifying where the row came from.
Join type: Choose between an inner or outer join for the selected data.
Number of experiments to show: Configure how many experiments to track.
About the Panel Preview
The panel displays the data in a table format.
You can customize the size of each column by dragging the separator line that divides the column titles. You can further customize each column by clicking on the menu icon by the top right corner of the column title, and choose to:
- Pin the column.
- Auto-size the selected column or all columns, or reset all columns.
- Filter the column values for the selected column.
- Filter out any column.
Also, the panel provides you with a count of Total rows and Total tables at the bottom of the table.