3D Panel
The 3D panel visualizes data in three dimensions, allowing you to explore relationships spatially.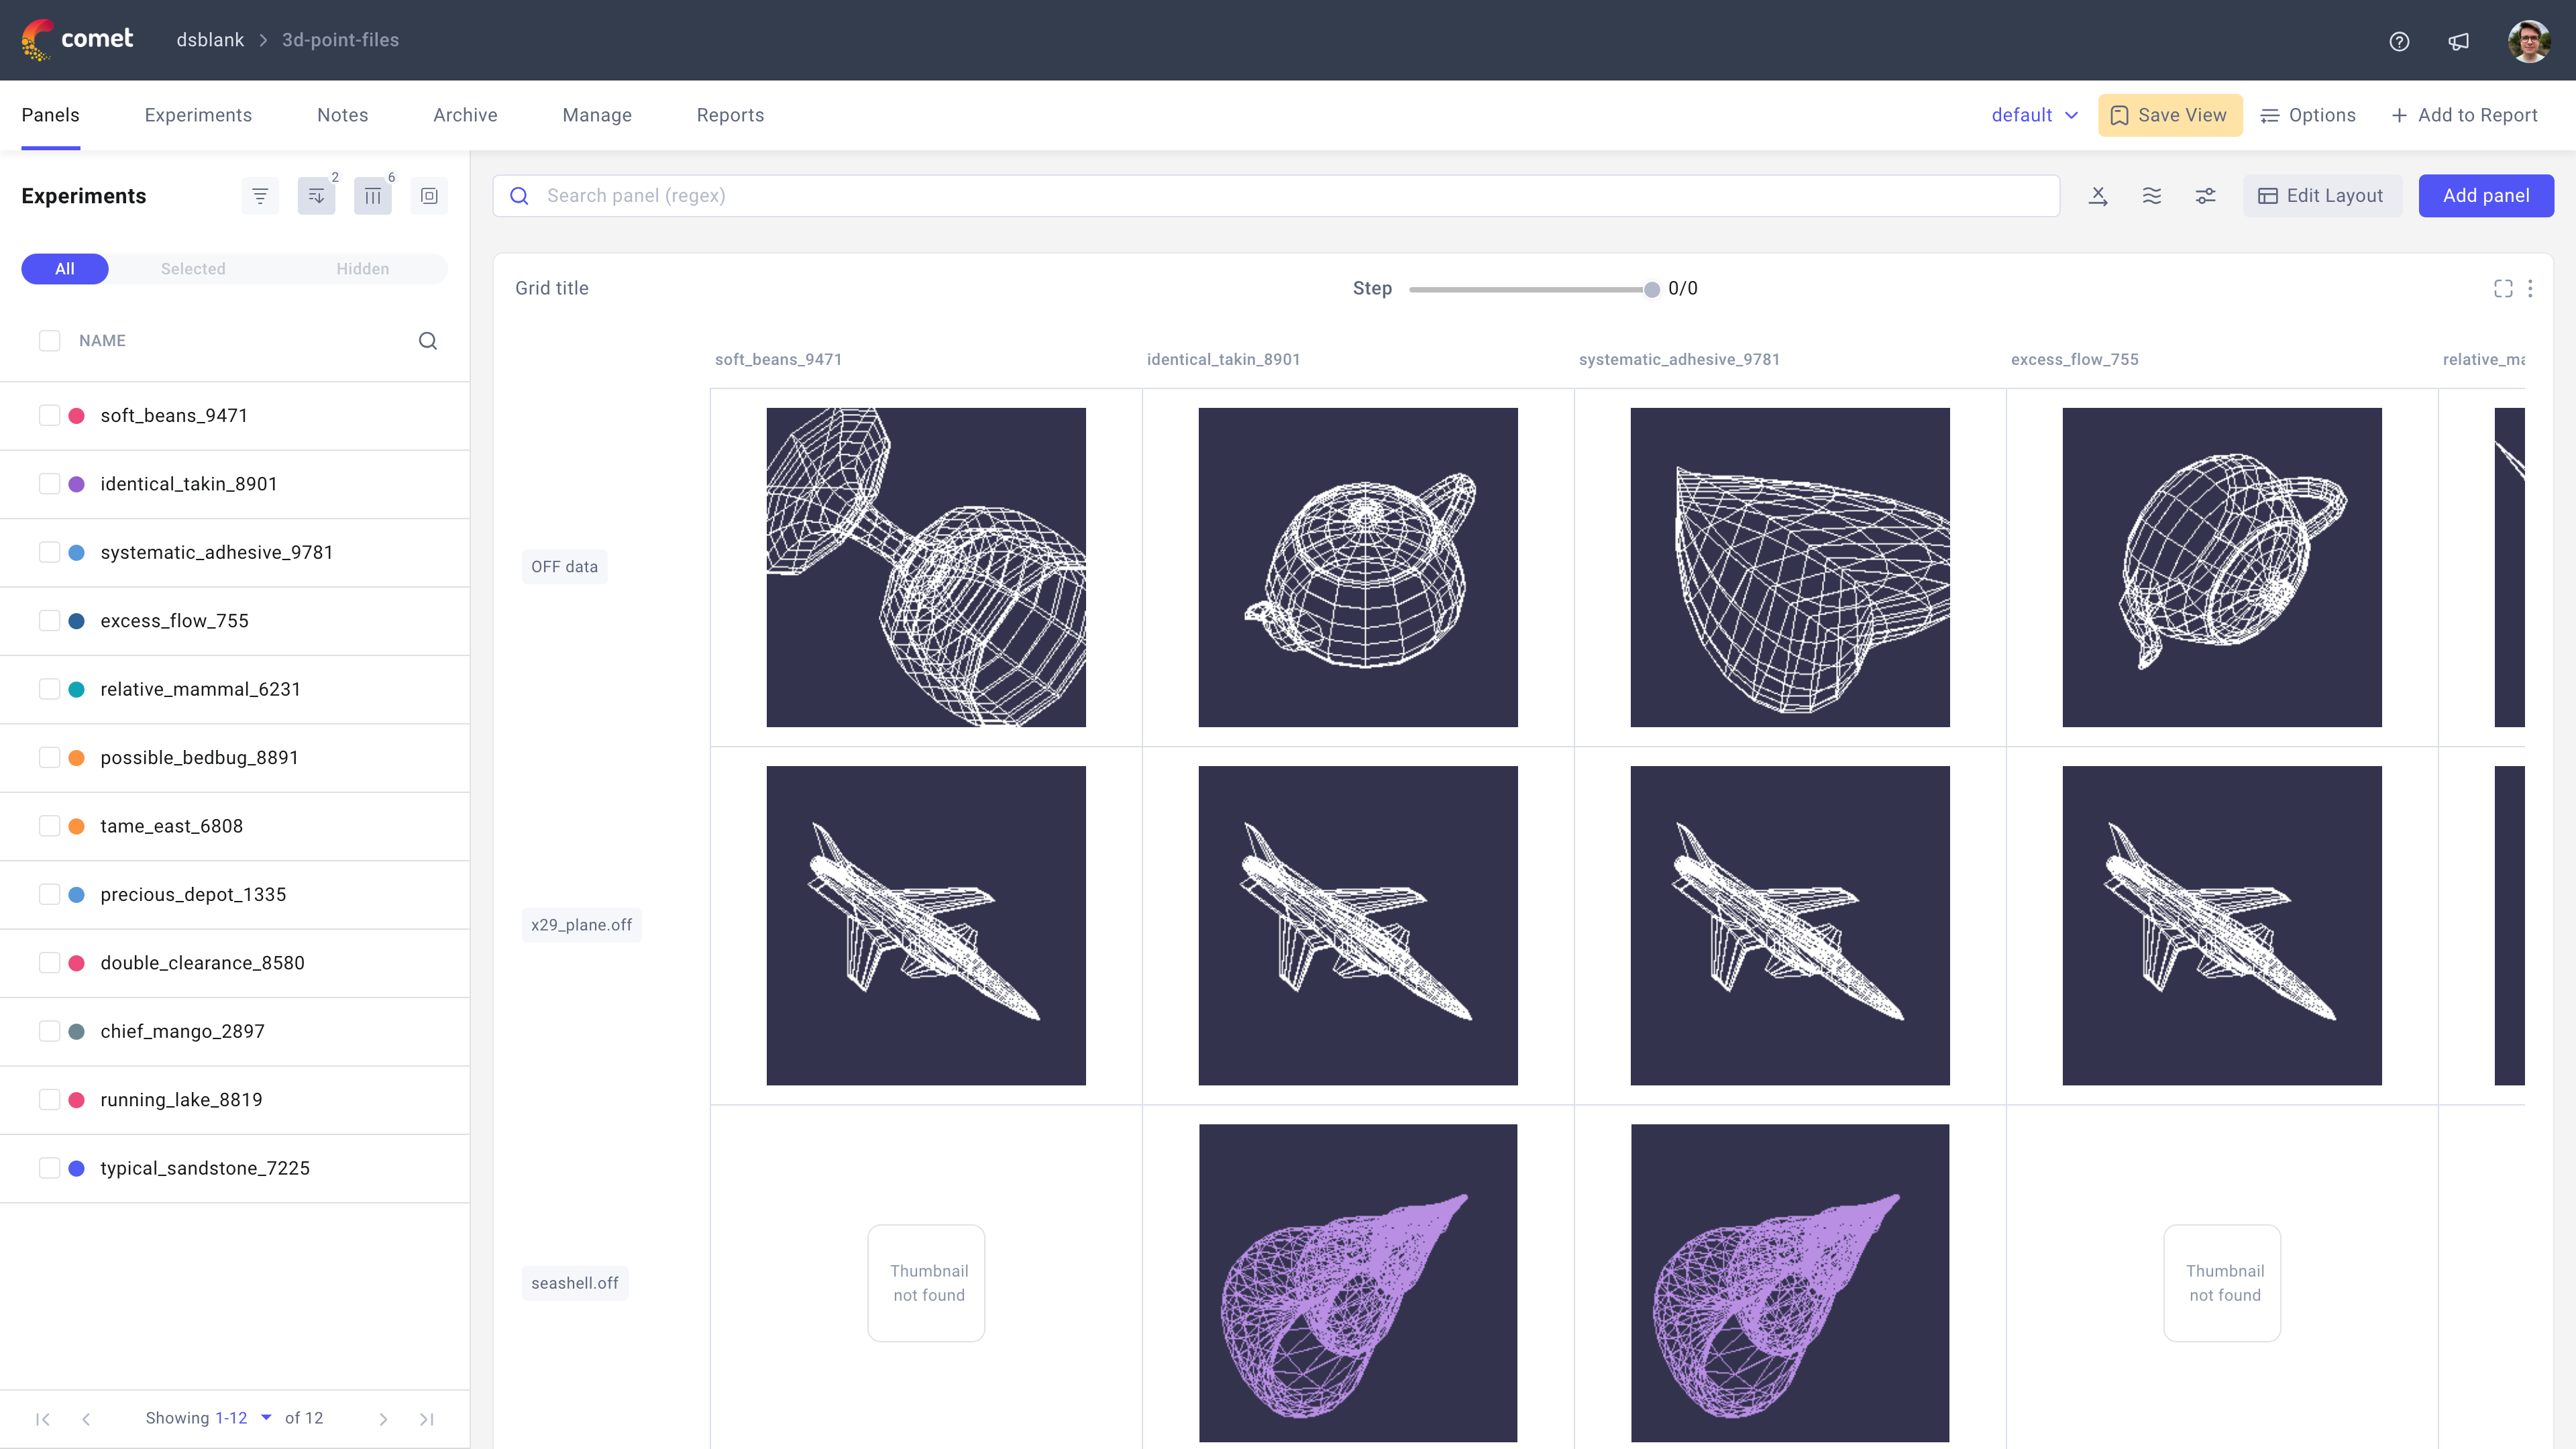
Use the 3D panel in Comet to visualize and compare your 3D assets logged via the log_points_3d() method across experiments, steps, and different models.
About the Configuration Sidebar
The Configuration sidebar consists of one tab:
Data: Select the 3D assets to visualize in the panel.
Asset name: Select the 3D asset to display in the panel by name.
Search begins after you type 3 characters, and looks for unique 3D asset names across steps and experiments.For example, if you logged 3dasset1.json in 5 different experiments across 20 different steps, your search result will still only return one result for 3dasset1.json.
By selecting that 3d asset, you can view its permutations in the panel.
Note
You can always look up saved 3d assets for the project by opening an experiment, selecting the Assets & Artifacts tab, and exploring the others/ folder.
Step: Define how to move through the steps related to your selected 3d assets.
Note that some 3d assets may be logged in some steps but not others - in those cases, the panel will not display a 3d asset since none was logged.Number of experiments to show: Configure how many experiments to track.
The panel will display the 3d assets from the last X experiments from the top.