Single Experiment page
In a single Experiment page, you can visualize and explore all the data you have collected in your training runs. This includes automatically logged and custom metrics, code, logs, text, images, and audio. There are also powerful features available in an Experiment page, such as the Confusion Matrix.
Experiment tabs
Each Experiment contains a set of tabs where you can view additional details about the Experiment. Following is a description of some of the more interesting tabs:
Panels
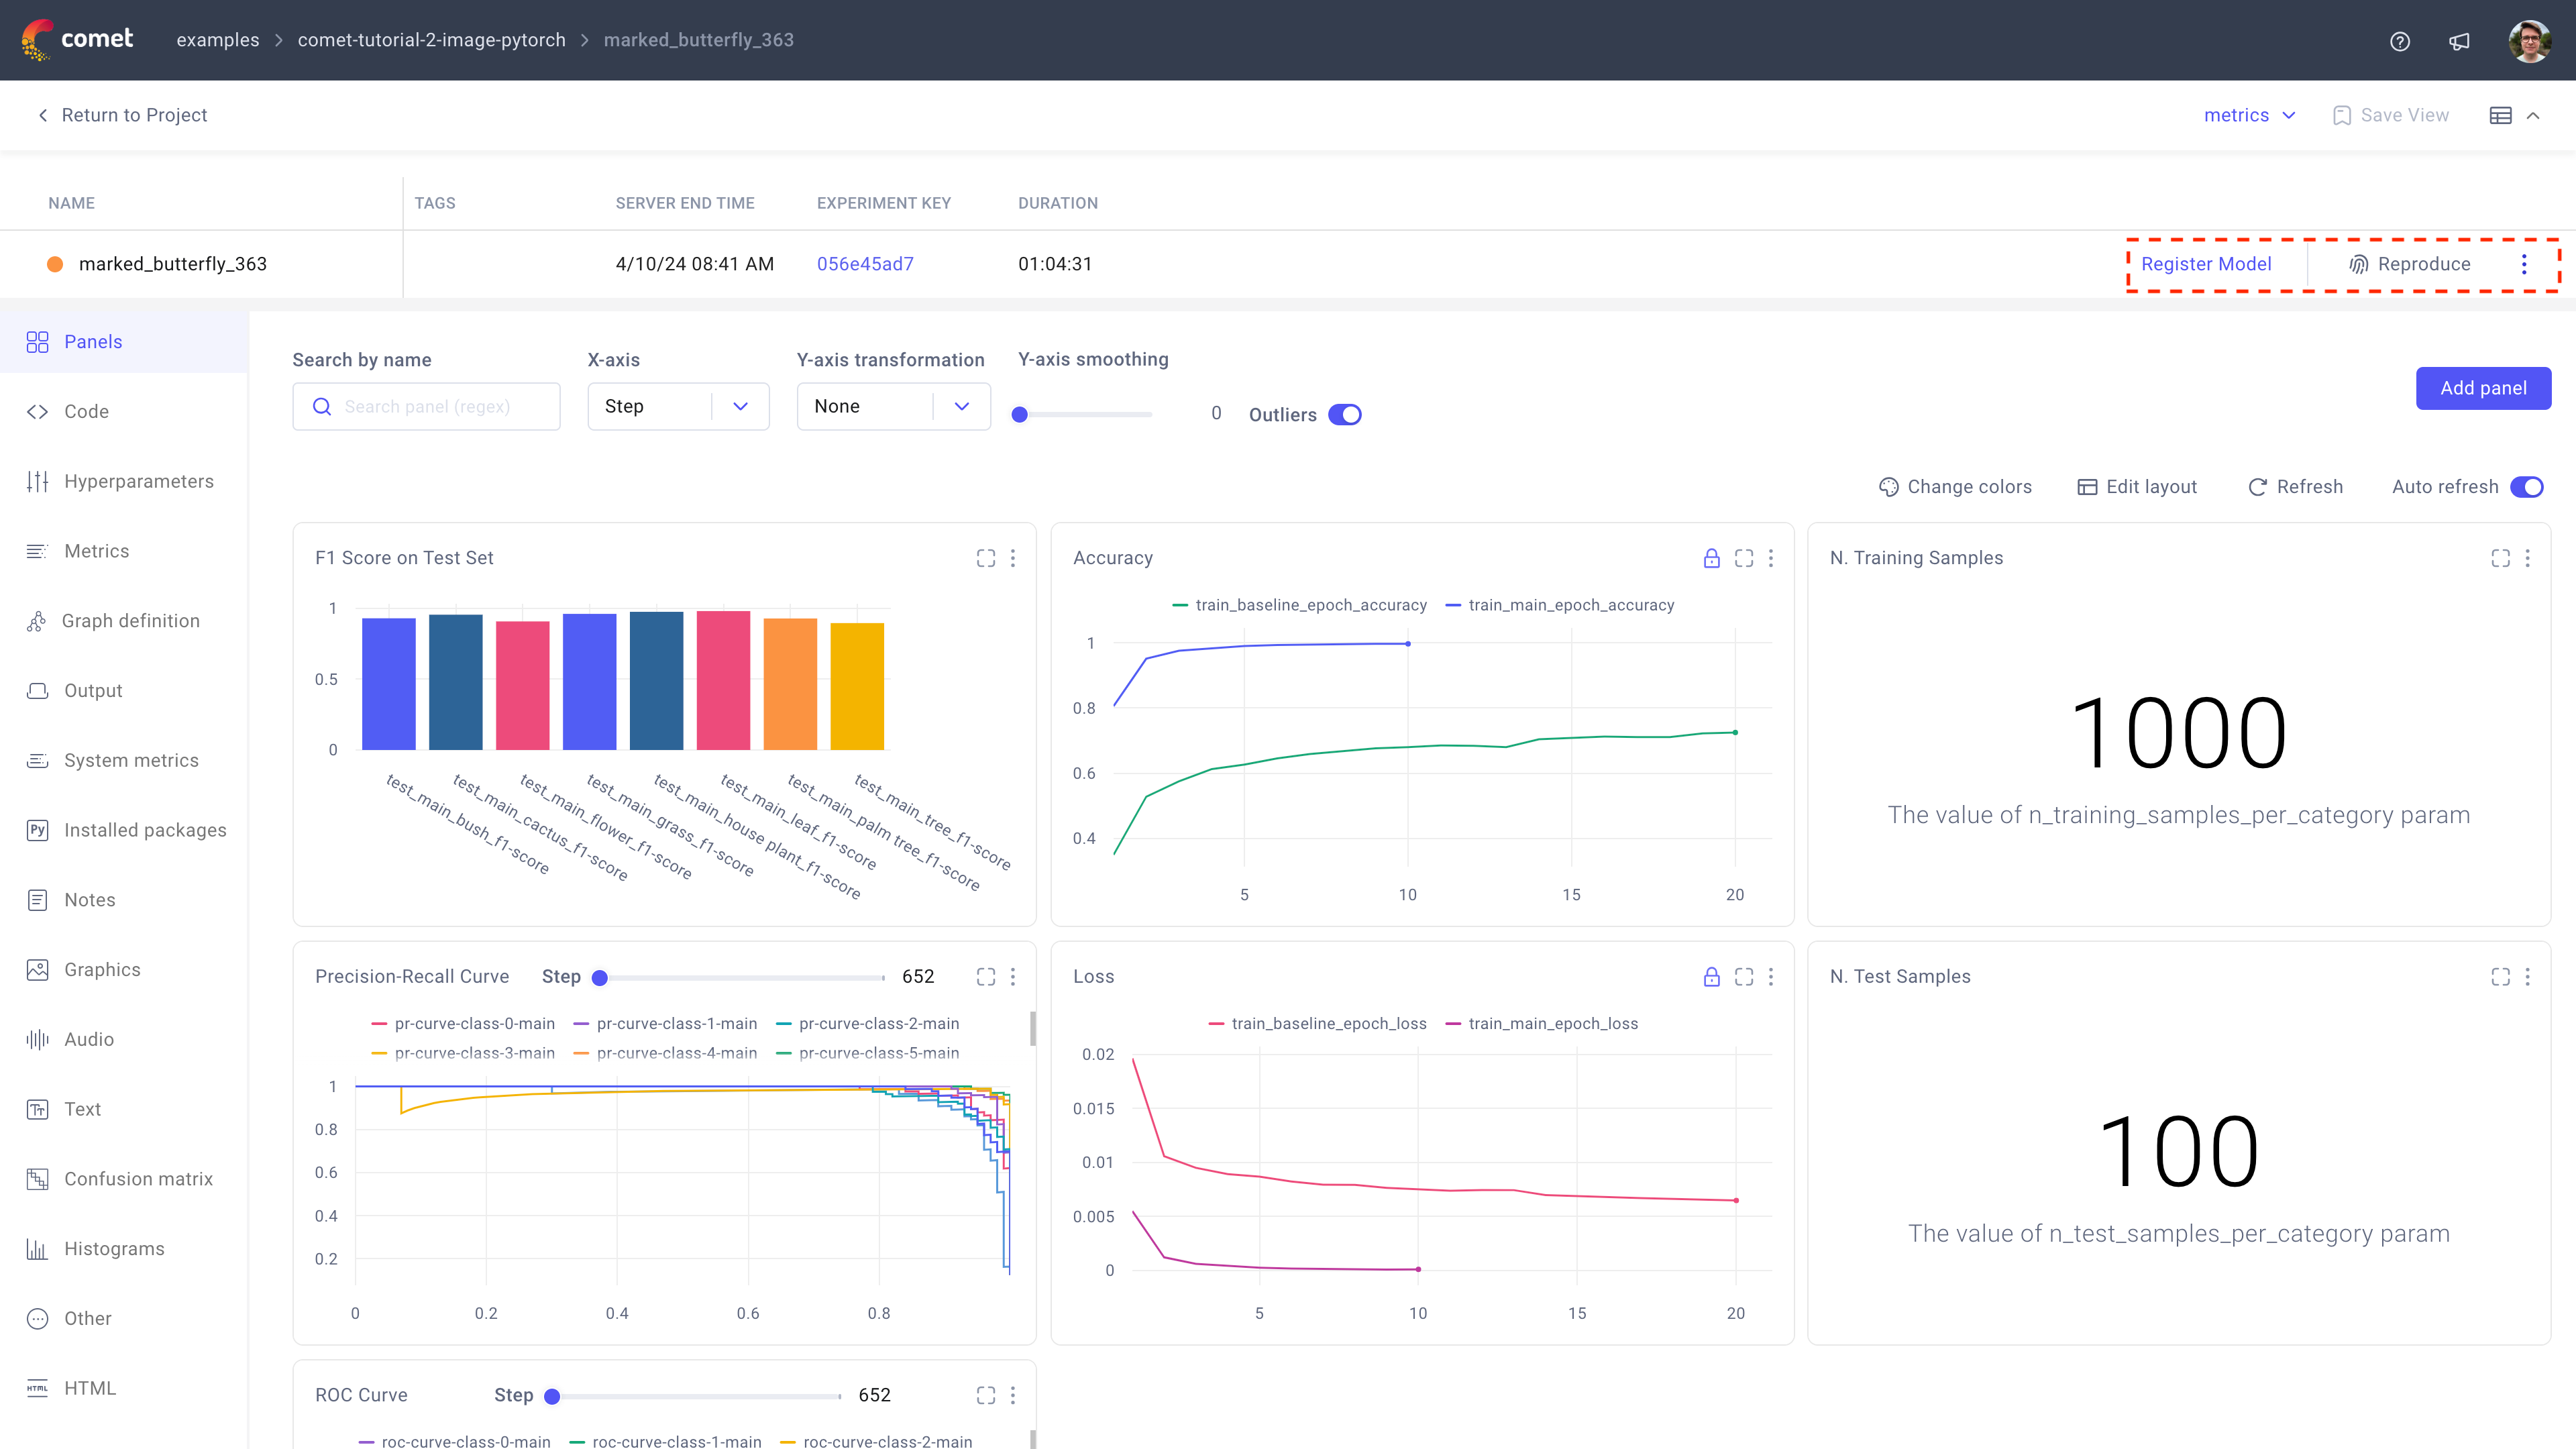
The Panels tab displays a dashboard comprising of all the panels in the specified view. Comet defaults to the "Auto Generated" view which is created by Comet automatically for your experiment given the tracked metrics.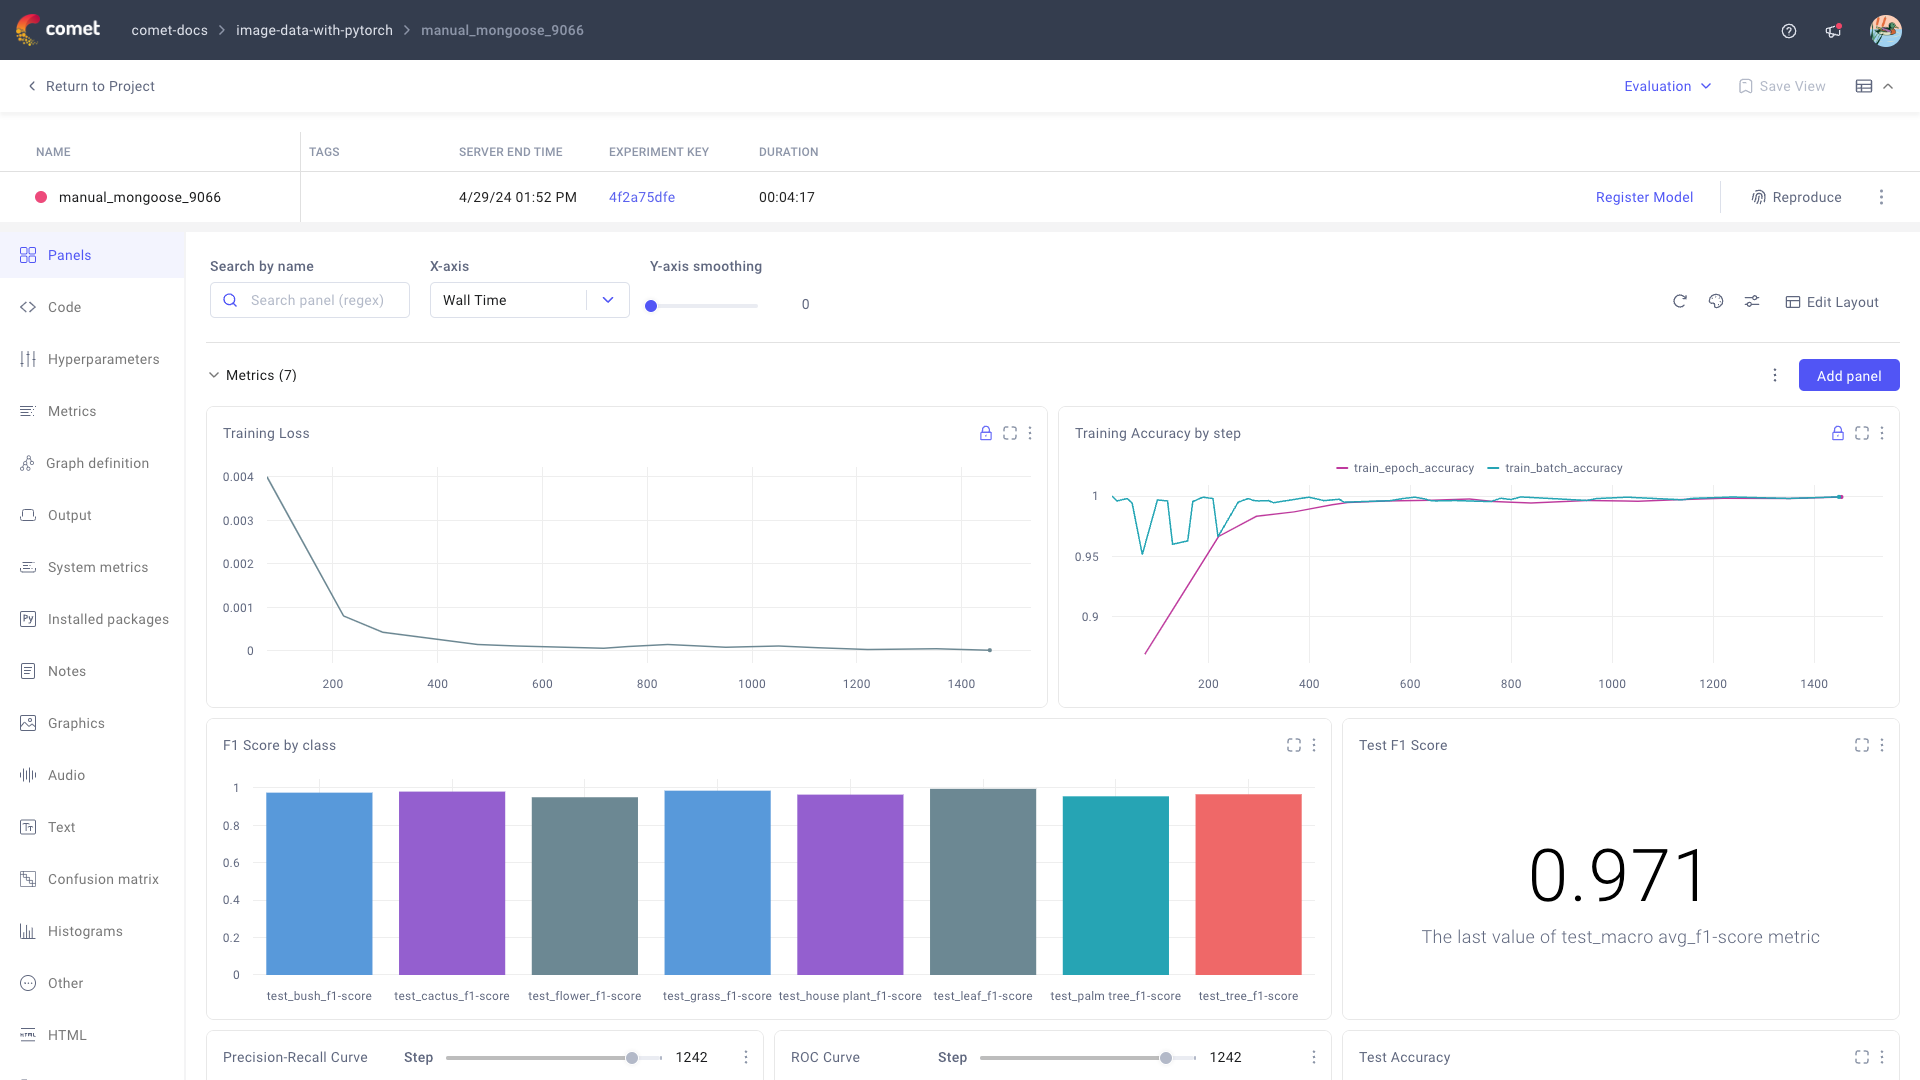
If you need to add any other visualizations to this view, you can add as many panels as you like by clicking Add Panels. As in the Project Panels page, you can set and save it, set the smoothing level, X axis, Y axis transformation, and how to handle outliers.
For many machine learning frameworks (such as TensorFlow, fastai, PyTorch, scikit-learn, MLflow, and others) many metrics and hyperparameters are automatically logged for you. However, you can also log any metric, parameter, or other value using the following methods:
Code tab
The Code tab contains the source code of the program used to run the experiment.
This is one between the script, Jupyter Notebook, or module that instantiated the Experiment.
From this tab, you can:
- Copy the filepath.
- View the raw file.
- Download the
.pyfile (and optionally change the download filename).
Note
If you run your experiment from a Jupyter-based environment (such as ipython, JupyterLab, or Jupyter Notebook), the Code tab contains the exact history that was run to execute the experiment. In addition, you can download this history as a Jupyter Notebook under the Reproduce button on the Experiment view.
Discover more from the Reproduce an experiment page.
Hyperparameters tab
The Hyperparameters tab shows all of the hyperparameters logged during the experiment.
Even if you log a hyperparameter multiple times over the run of an experiment, this tab shows only the last reported value.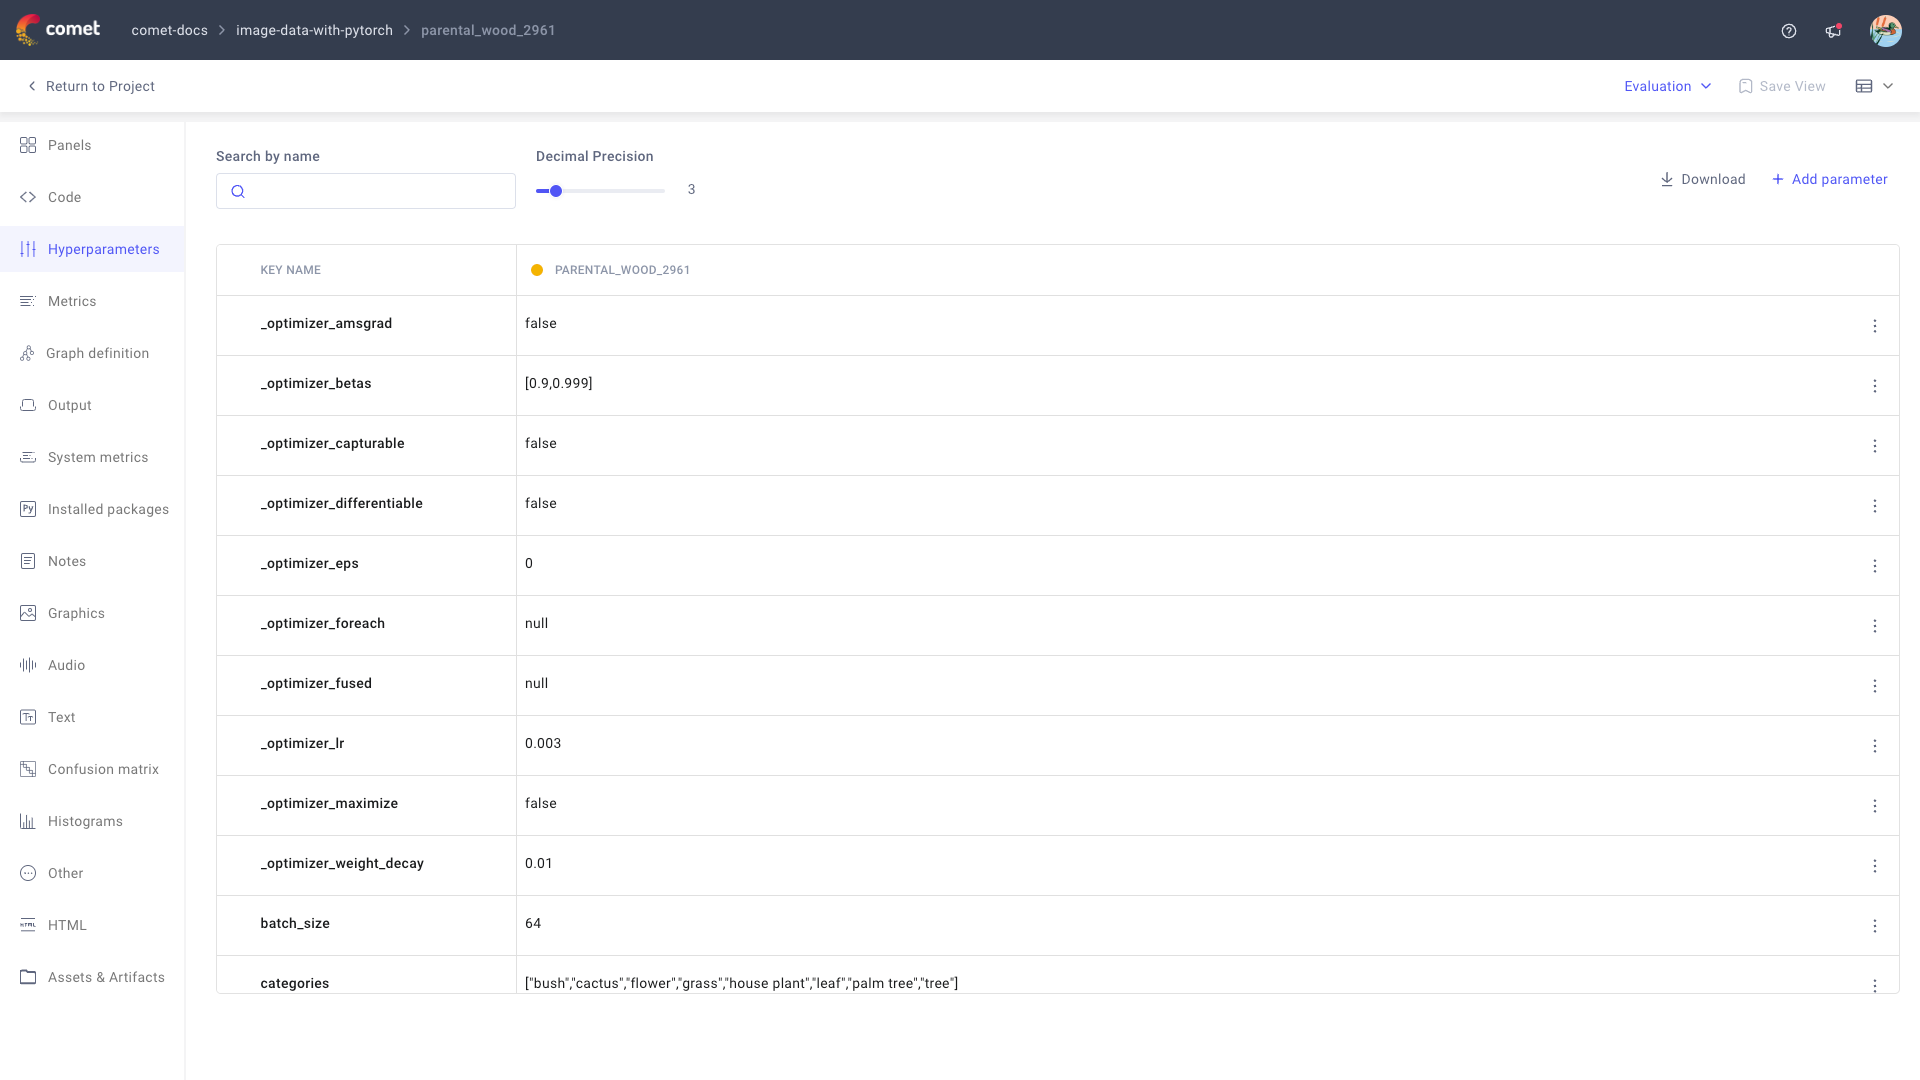
From this tab, you can:
- Search across all logged hyperparameters.
- Define the decimal precision for displaying the values [default is 3].
- Download the hyperparameters as a JSON.
- Manually add a parameter, as defined by a custom {key: value} pair.
Metrics tab
The Metrics tab shows all of the metrics logged during the experiment.
Even if you log a metric multiple times over the run of an experiment, this tab shows only the last, min, and max value for the metric together with corresponding step (or epoch) and time.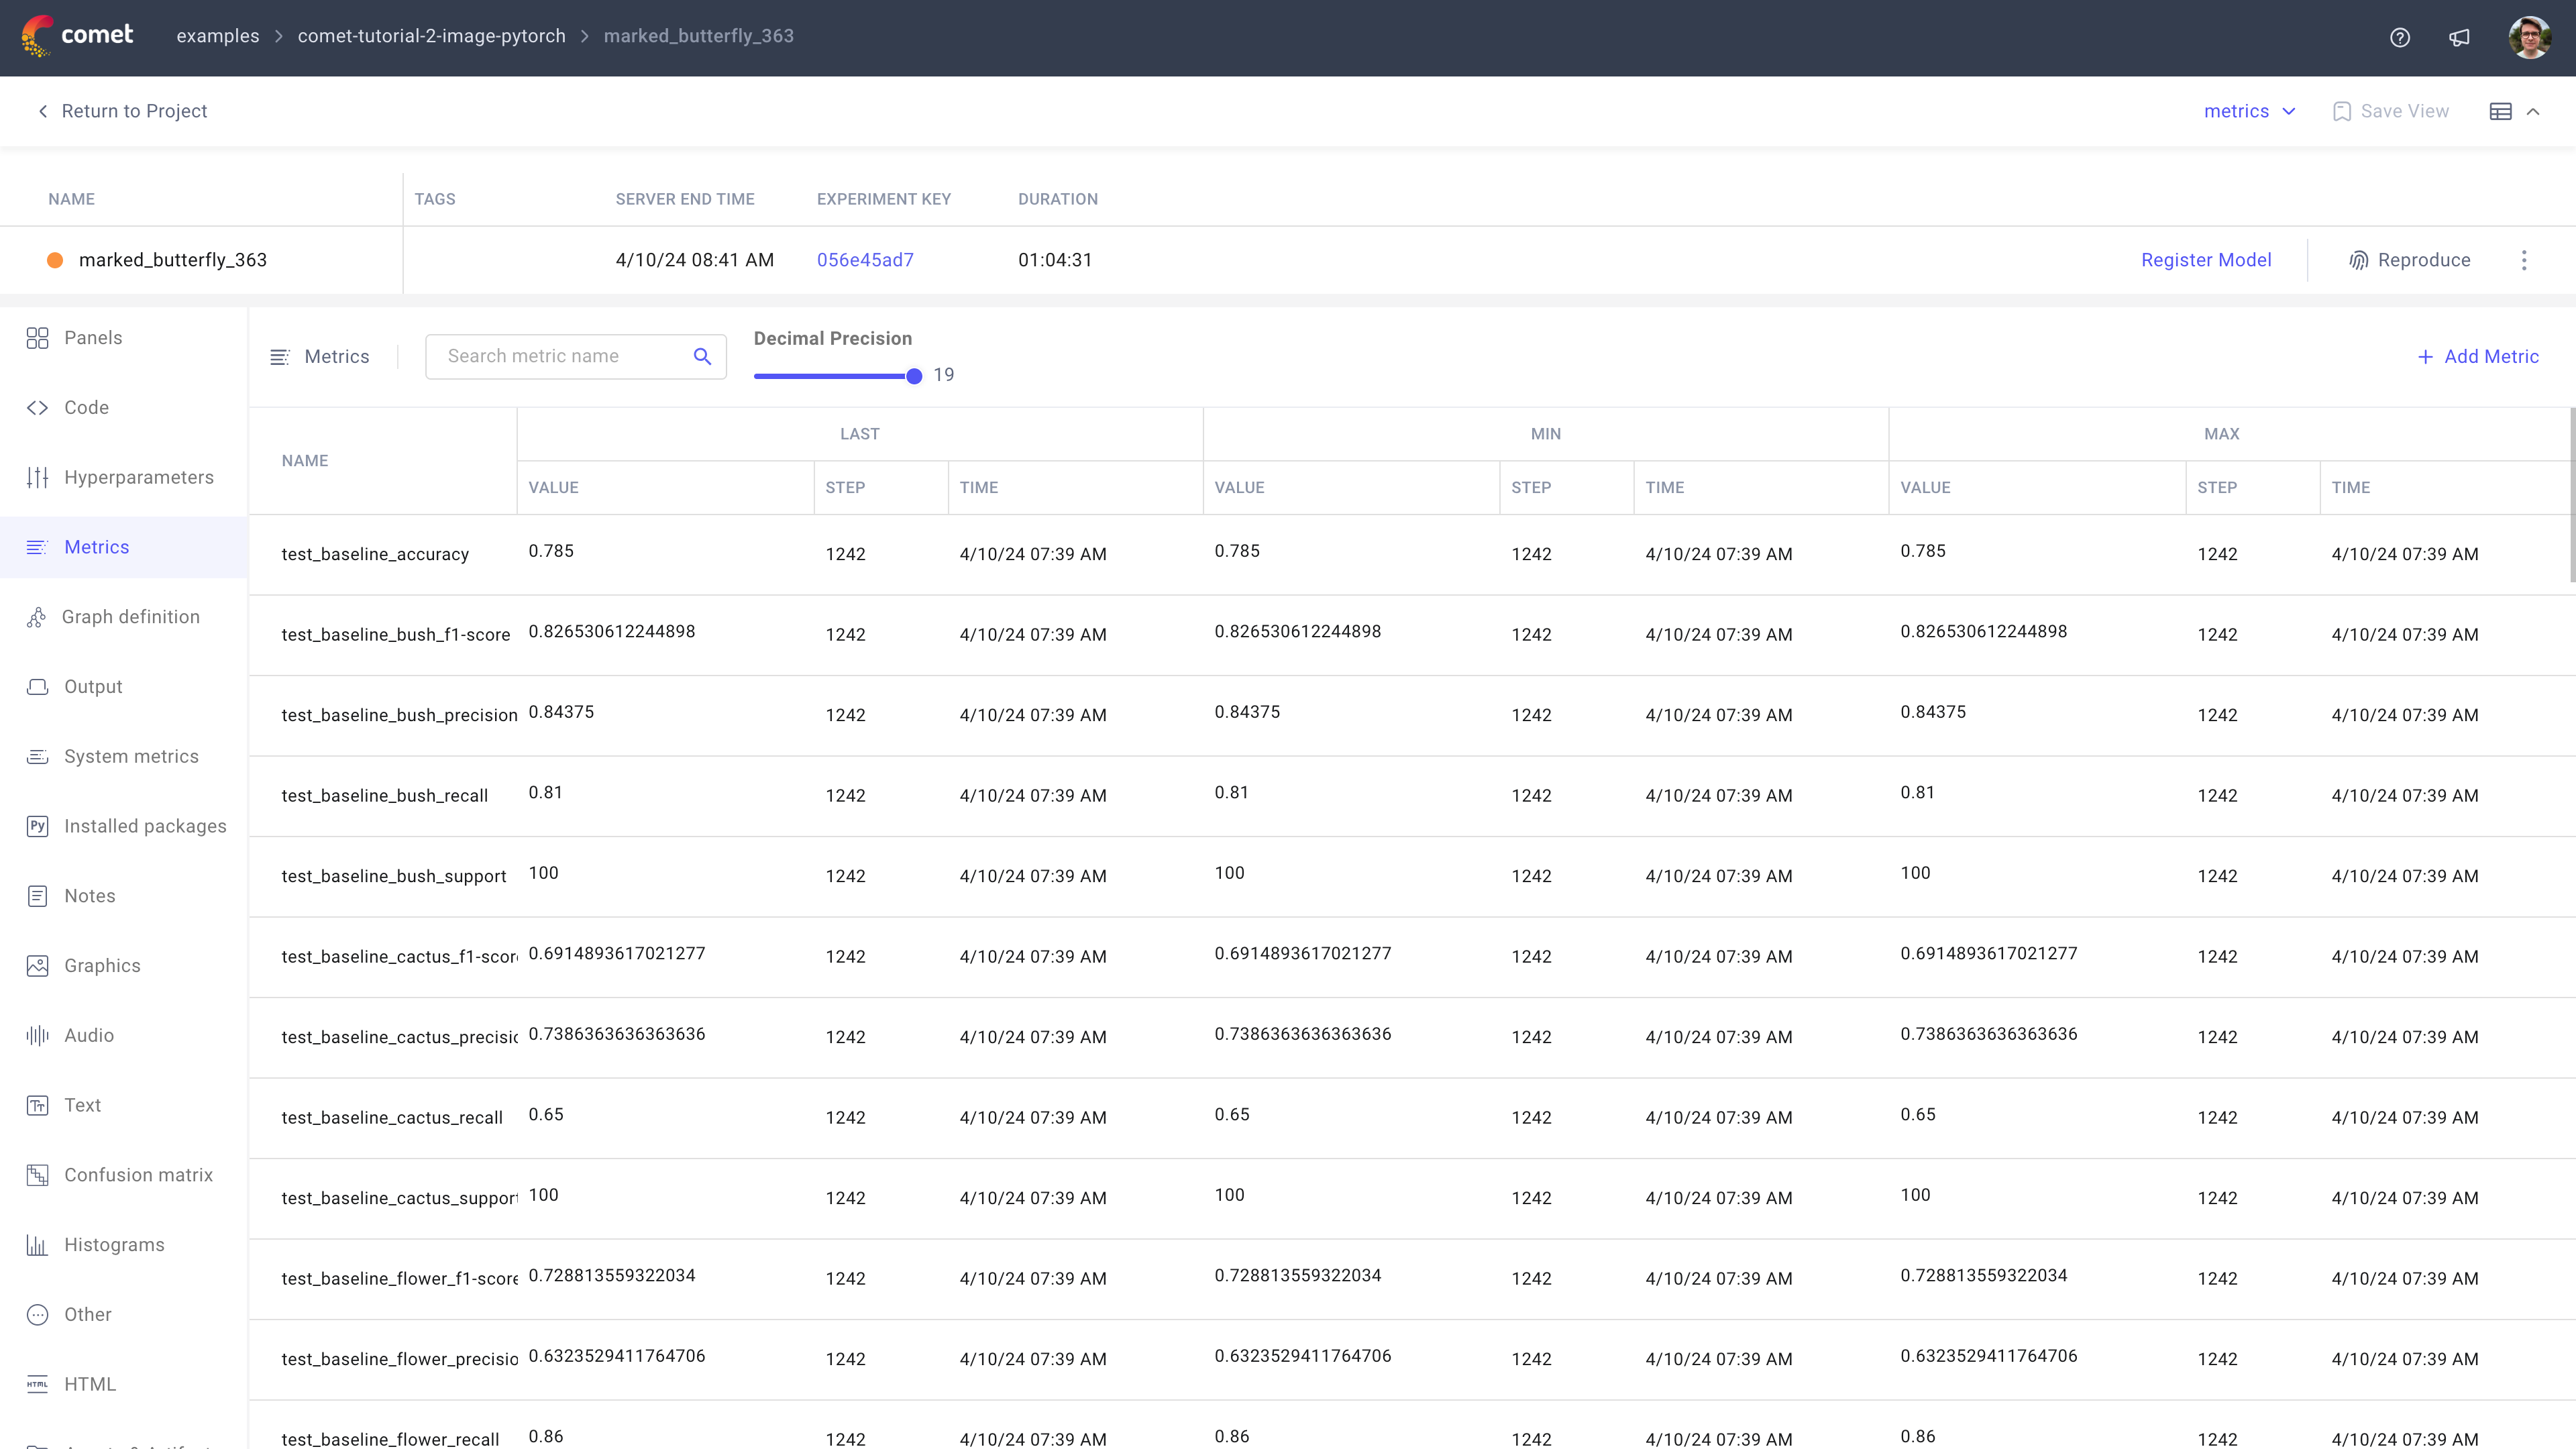
From this tab, you can:
- Search across all logged metrics.
- Define the decimal precision for displaying the values [default is set to the maximum precision recorded].
- Manually add a metric.
Note that you need to populate all fields in the Metrics table to be able to save the new entry.
Graph definition tab
The Graph definition tab displays a text representation of the model's architecture, only for supported frameworks.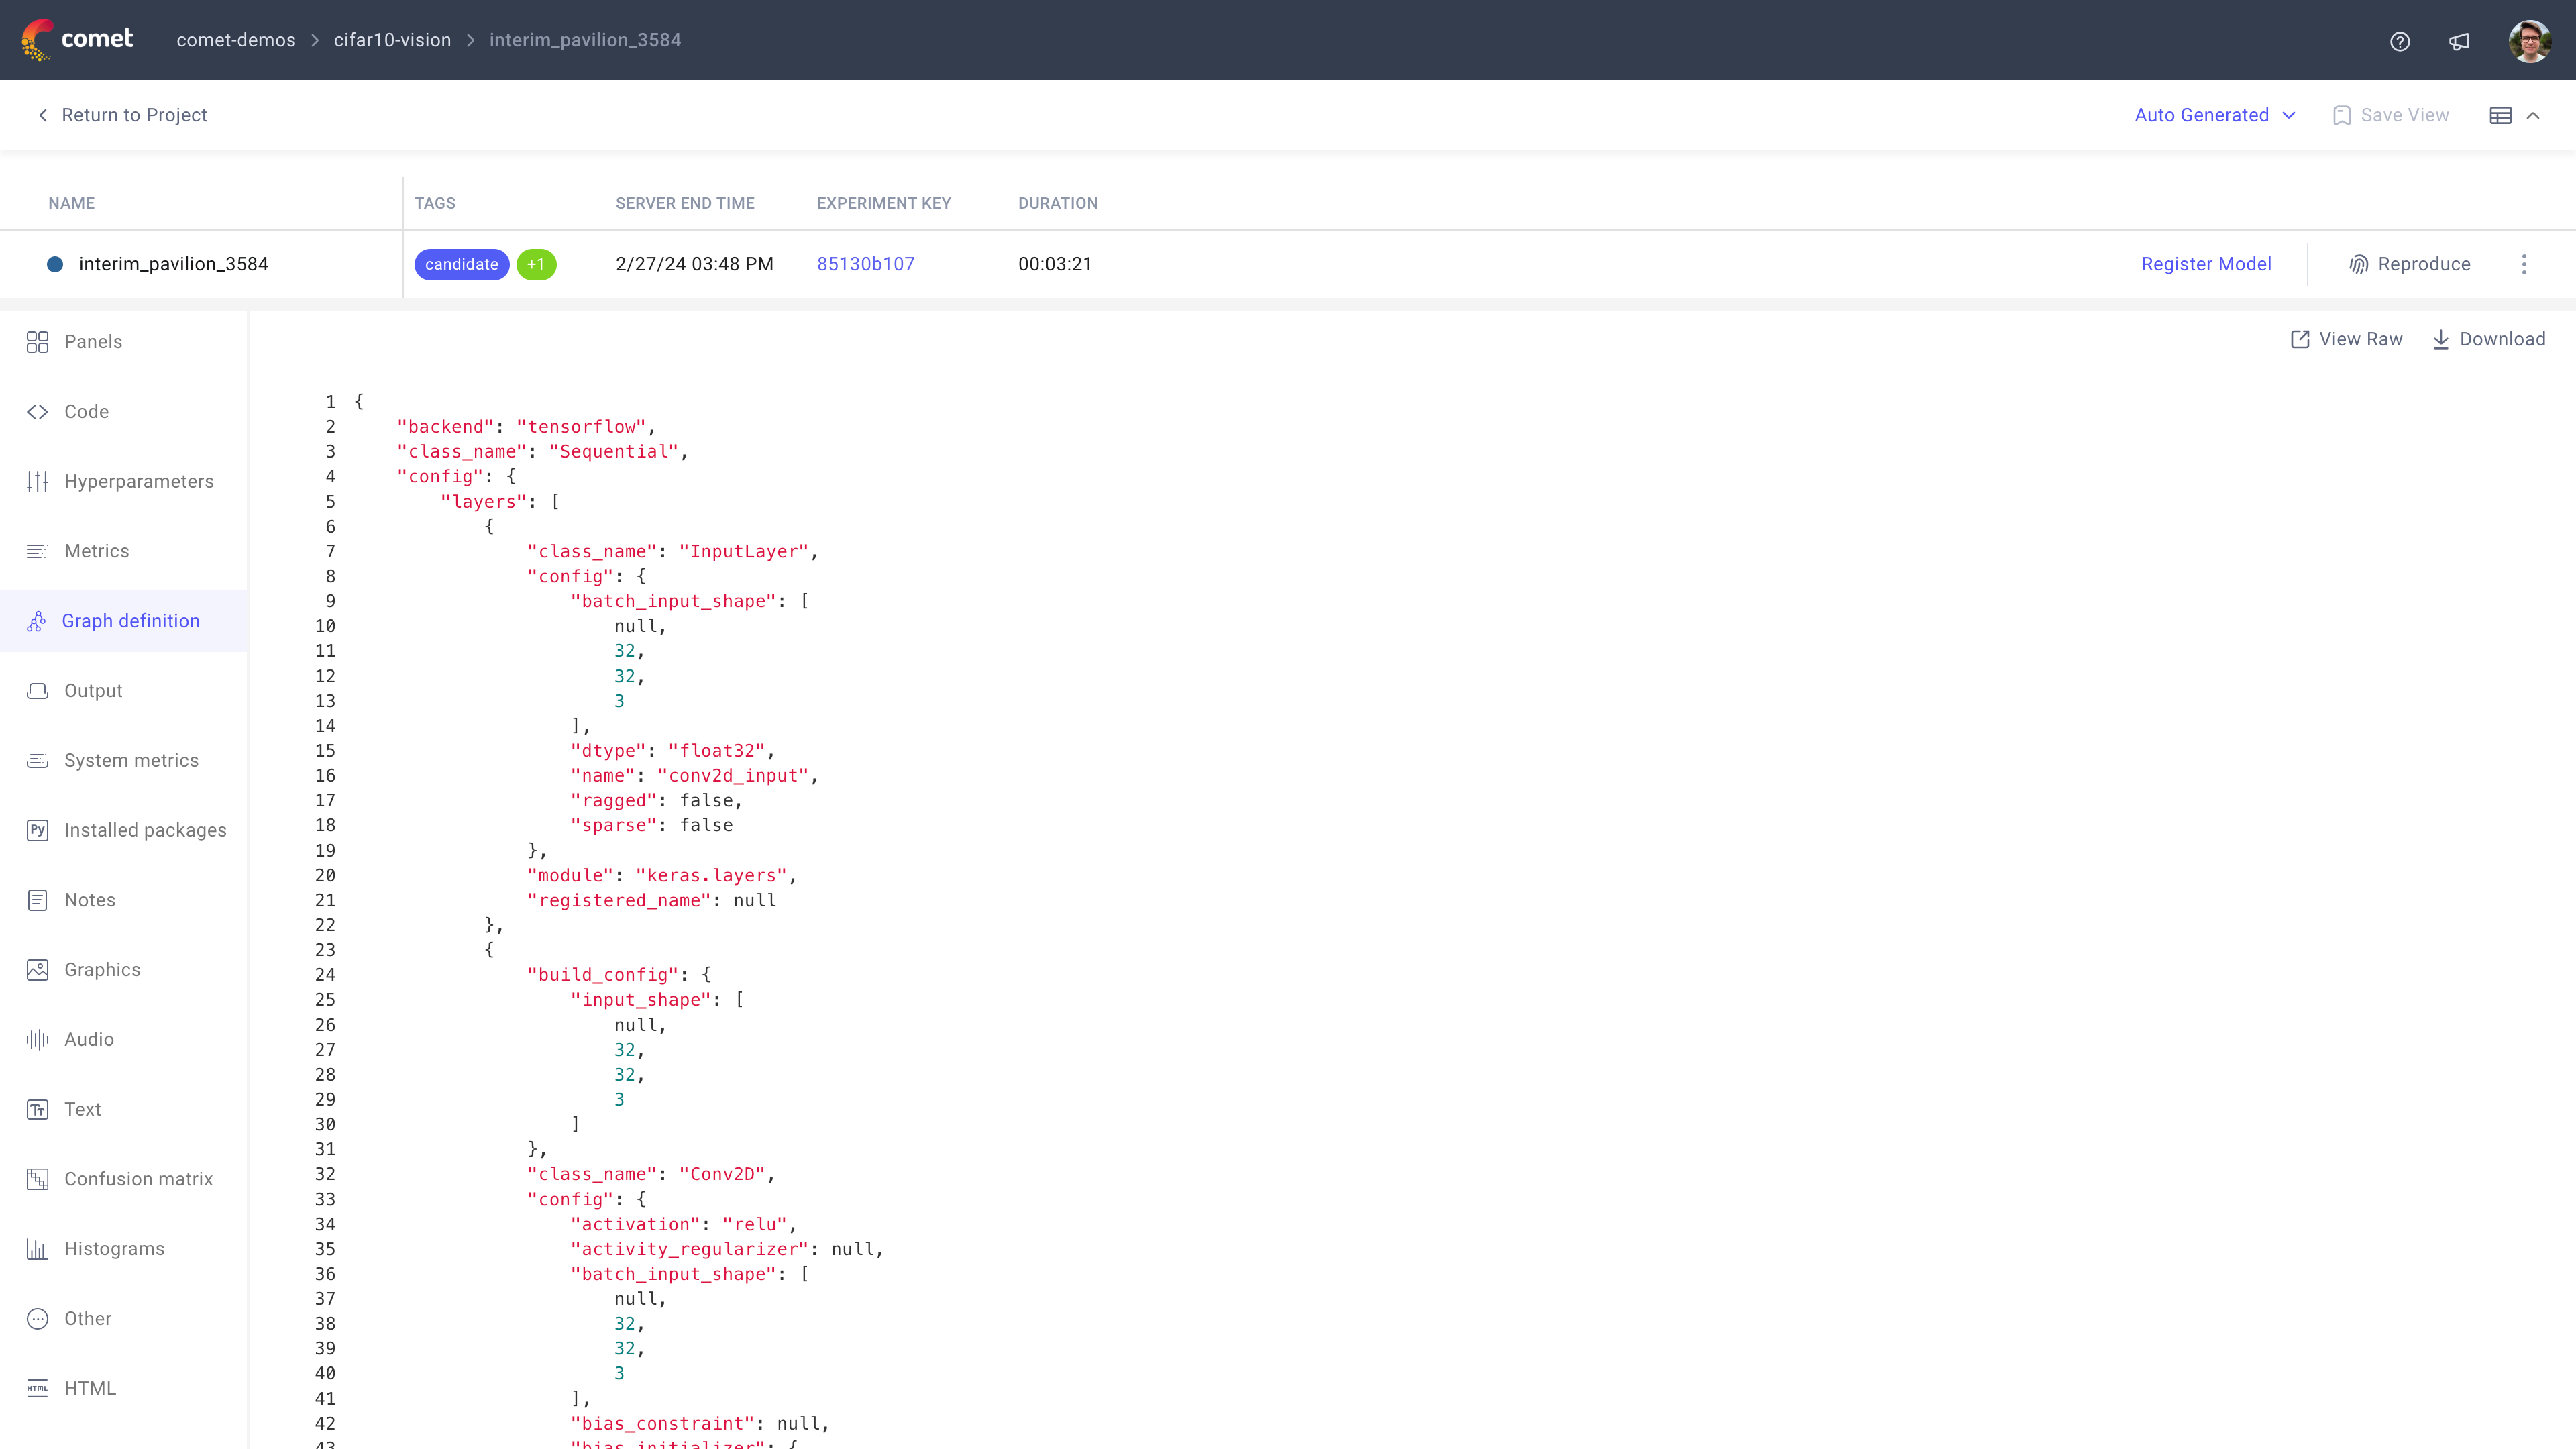
From this tab, you can:
- View the raw file with the graph definition.
- Download the
.jsonfile with the graph definition (and optionally change the download filename).
Output tab
The Output tab displays STDERR and STDOUT outputs from the code execution for the experiment.
By default, the tab displays the end of the combined output from STDERR and STDOUT.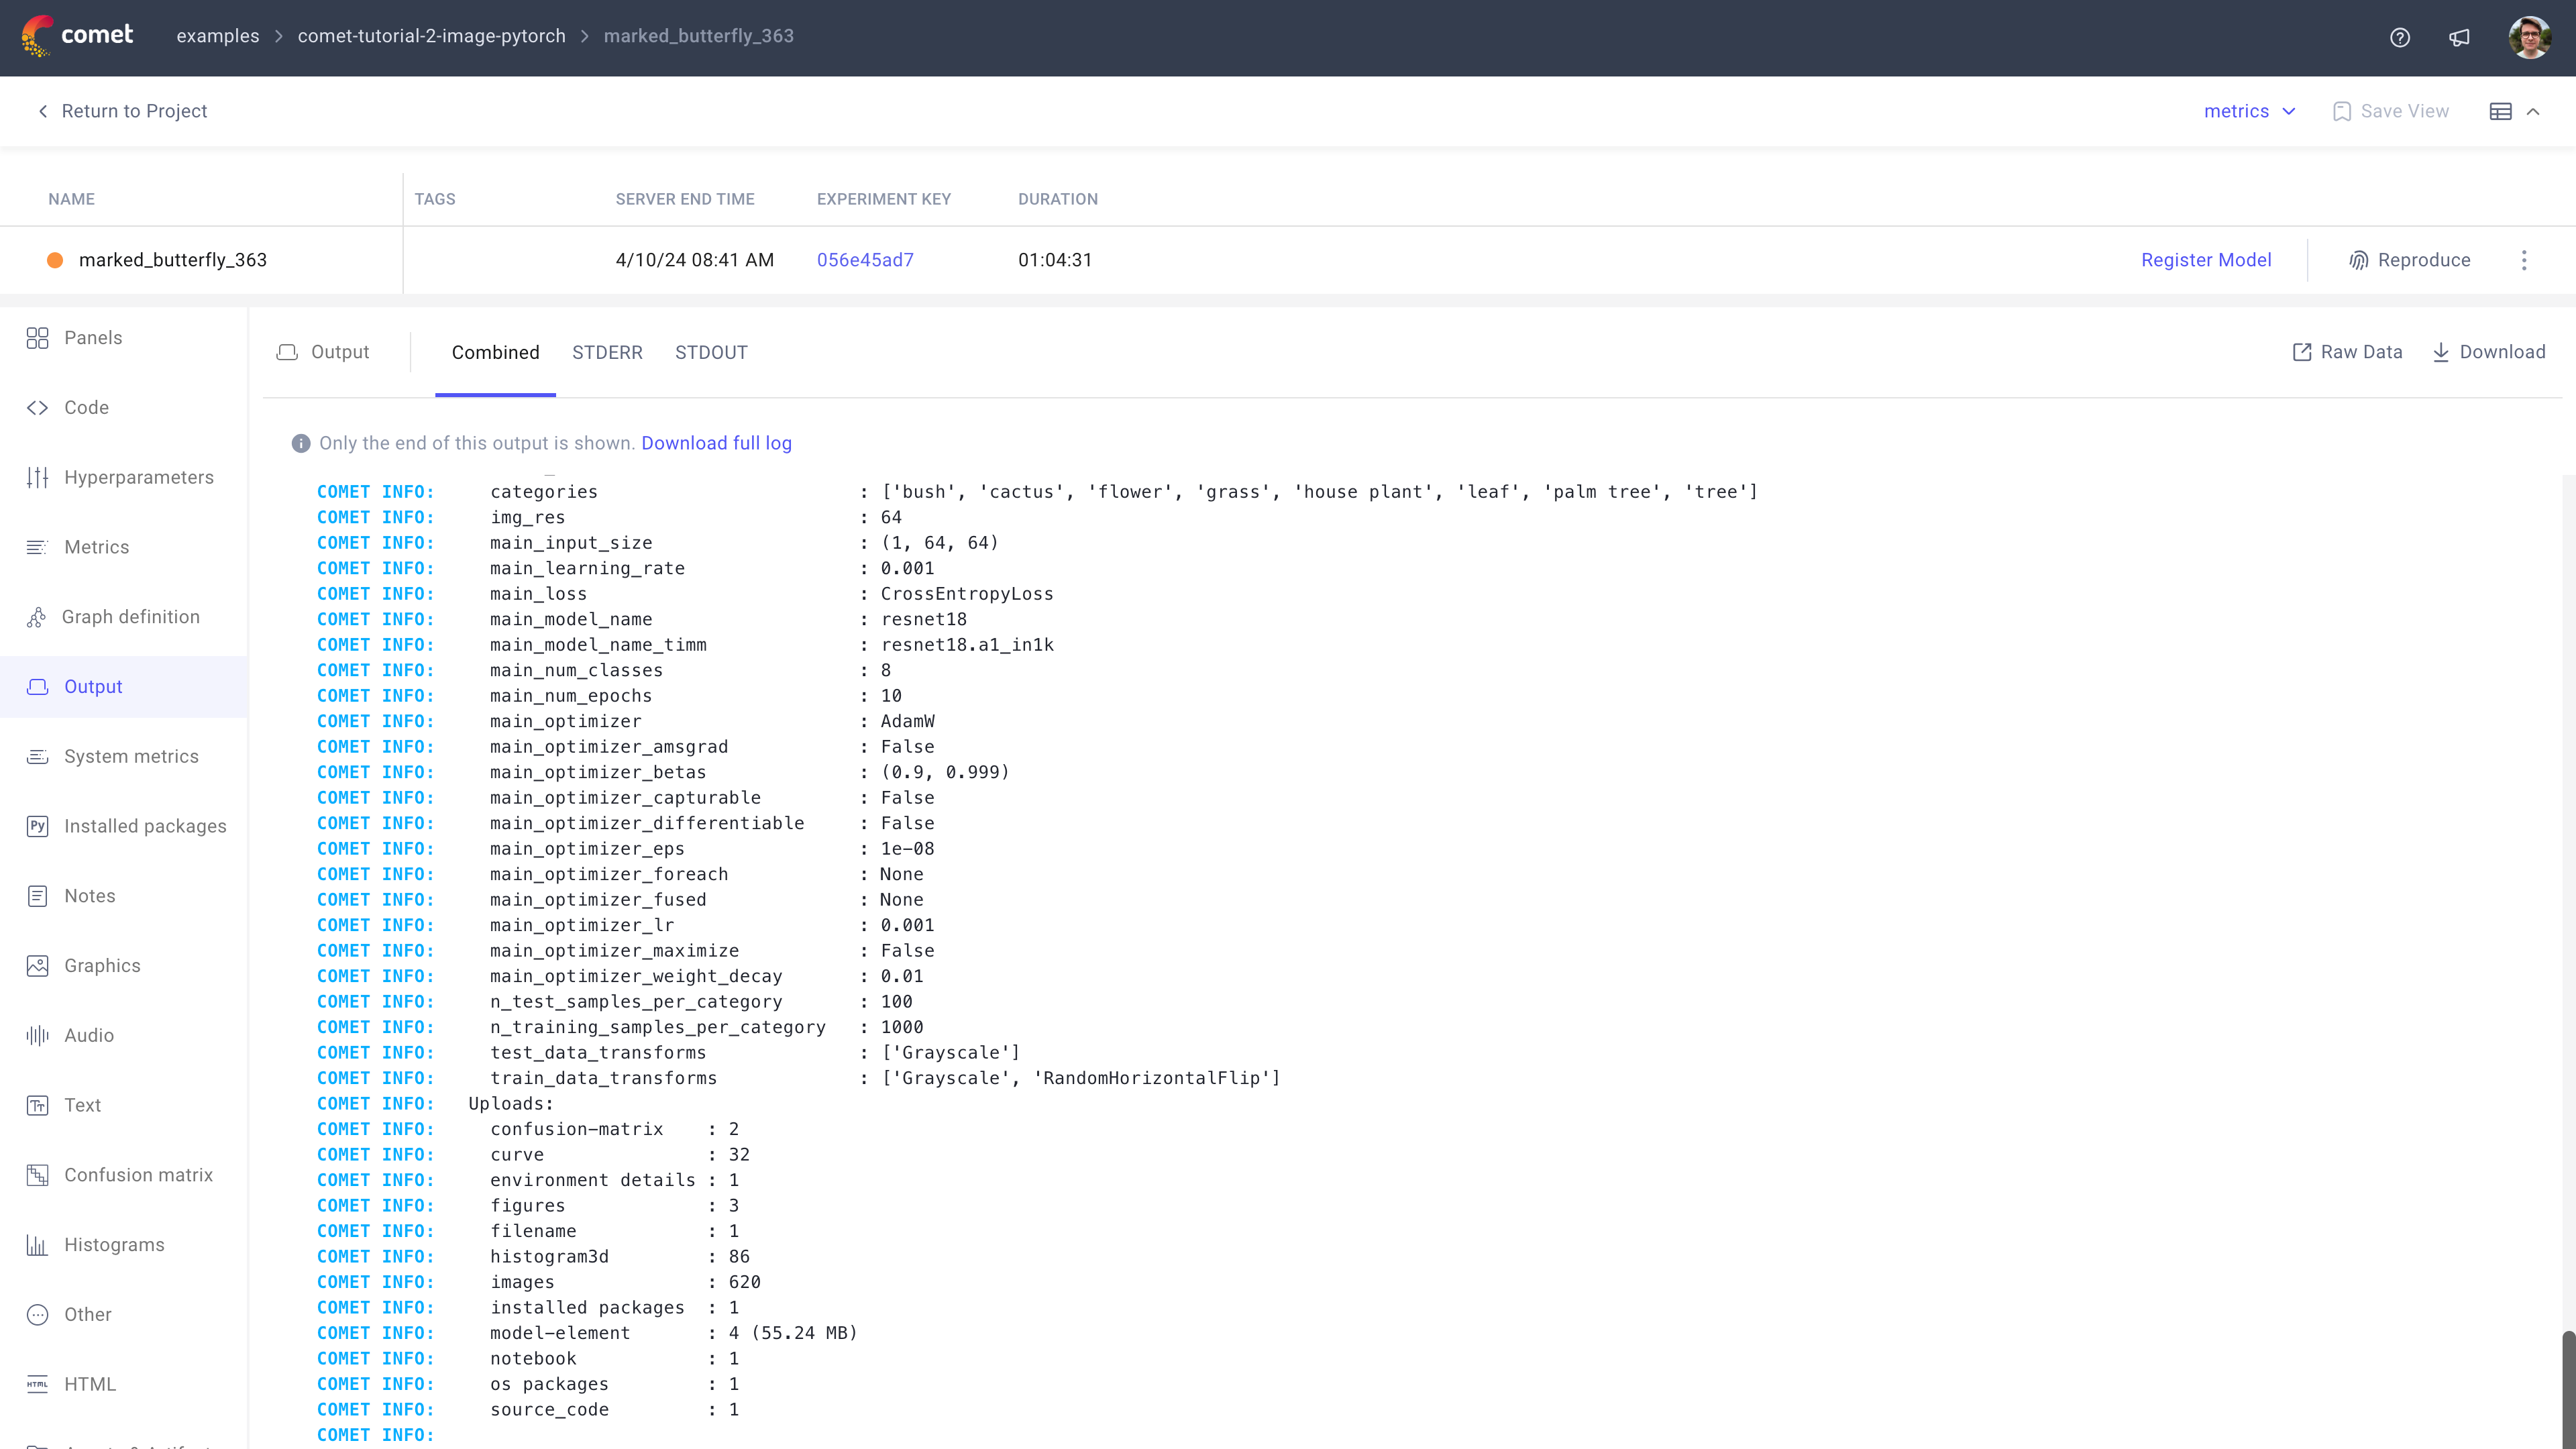
From this tab, you can:
- Filter to view Combined, STDERR only, or STDOUT only.
- View the raw file with the full logs.
- Download the
.txtfile with the full logs (and optionally change the download filename).
System Metrics tab
The System Metrics tab display information about your training environment.
As models are often trained on large machines, the logged system metrics are limited to the ones used as part of the training process. This is done by checking for the CUDA_VISIBLE_DEVICES environment variable; if it isn't set, then all the metrics are logged for each GPU.
By default, the tab displays four graph groups showcasing system performance and a section of key-value pairs about the training environment.
Note
You can log more data manually by calling Experiment.log_log_system_info or APIExperiment.log_additional_system_info.
The system performance graphs

An example of the system performance graphs in System metrics tab for an Experiment The graphs are aimed at helping users identify bottlenecks in their training scripts:
GPU Memory Usage, GPU Power Usage, GPU Utilization, and GPU Temperature per GPU device.
Memory Usage (available and used) and CPU Utilization (overall and utilized).
Note
For CPU Utilization,
sys.compute.overallrefers to the percentage of utilization of all CPU cores, whilesys.compute.utilizedrefers to the percentage of utilization for the current training process.
Values above 100% are possible through parallelization.Network Usage (incoming and outgoing).
Metrics are reported in bytes per second.
Disk (Total) Utilization and Disk I/O Utilization (read and write).
Info
Before the Python SDK version 3.31.21, the CPU metrics were the percentage of utilization of each core instead. Those values are still logged and you can visualize them with the built-in Line panel, and look for metrics that contain the string
sys.cpu.The training environment key-value pairs
The key-value information includes details such as the Python version, OS name and version, and other relevant details. This information can help users understand the context in which the training is taking place and troubleshoot any issues that may arise.
Here is a list of what is logged automatically by the Python SDK:
Name Description user The OS username python_version The Python Version as MAJOR.MINOR.PATCH python_version_verbose The detailed Python Version pid The process identifier of the process that created the Experiment os_type The OS type os The platform name osRelease The OS release machine The Machine type processor The Processor name ip The IP address of the interface used to connect to Comet hostname The hostname of the machine
Installed packages tab
The Installed package tab shows a complete list of all packages installed in the system when the experiment ran.
This corresponds to the output of pip freeze.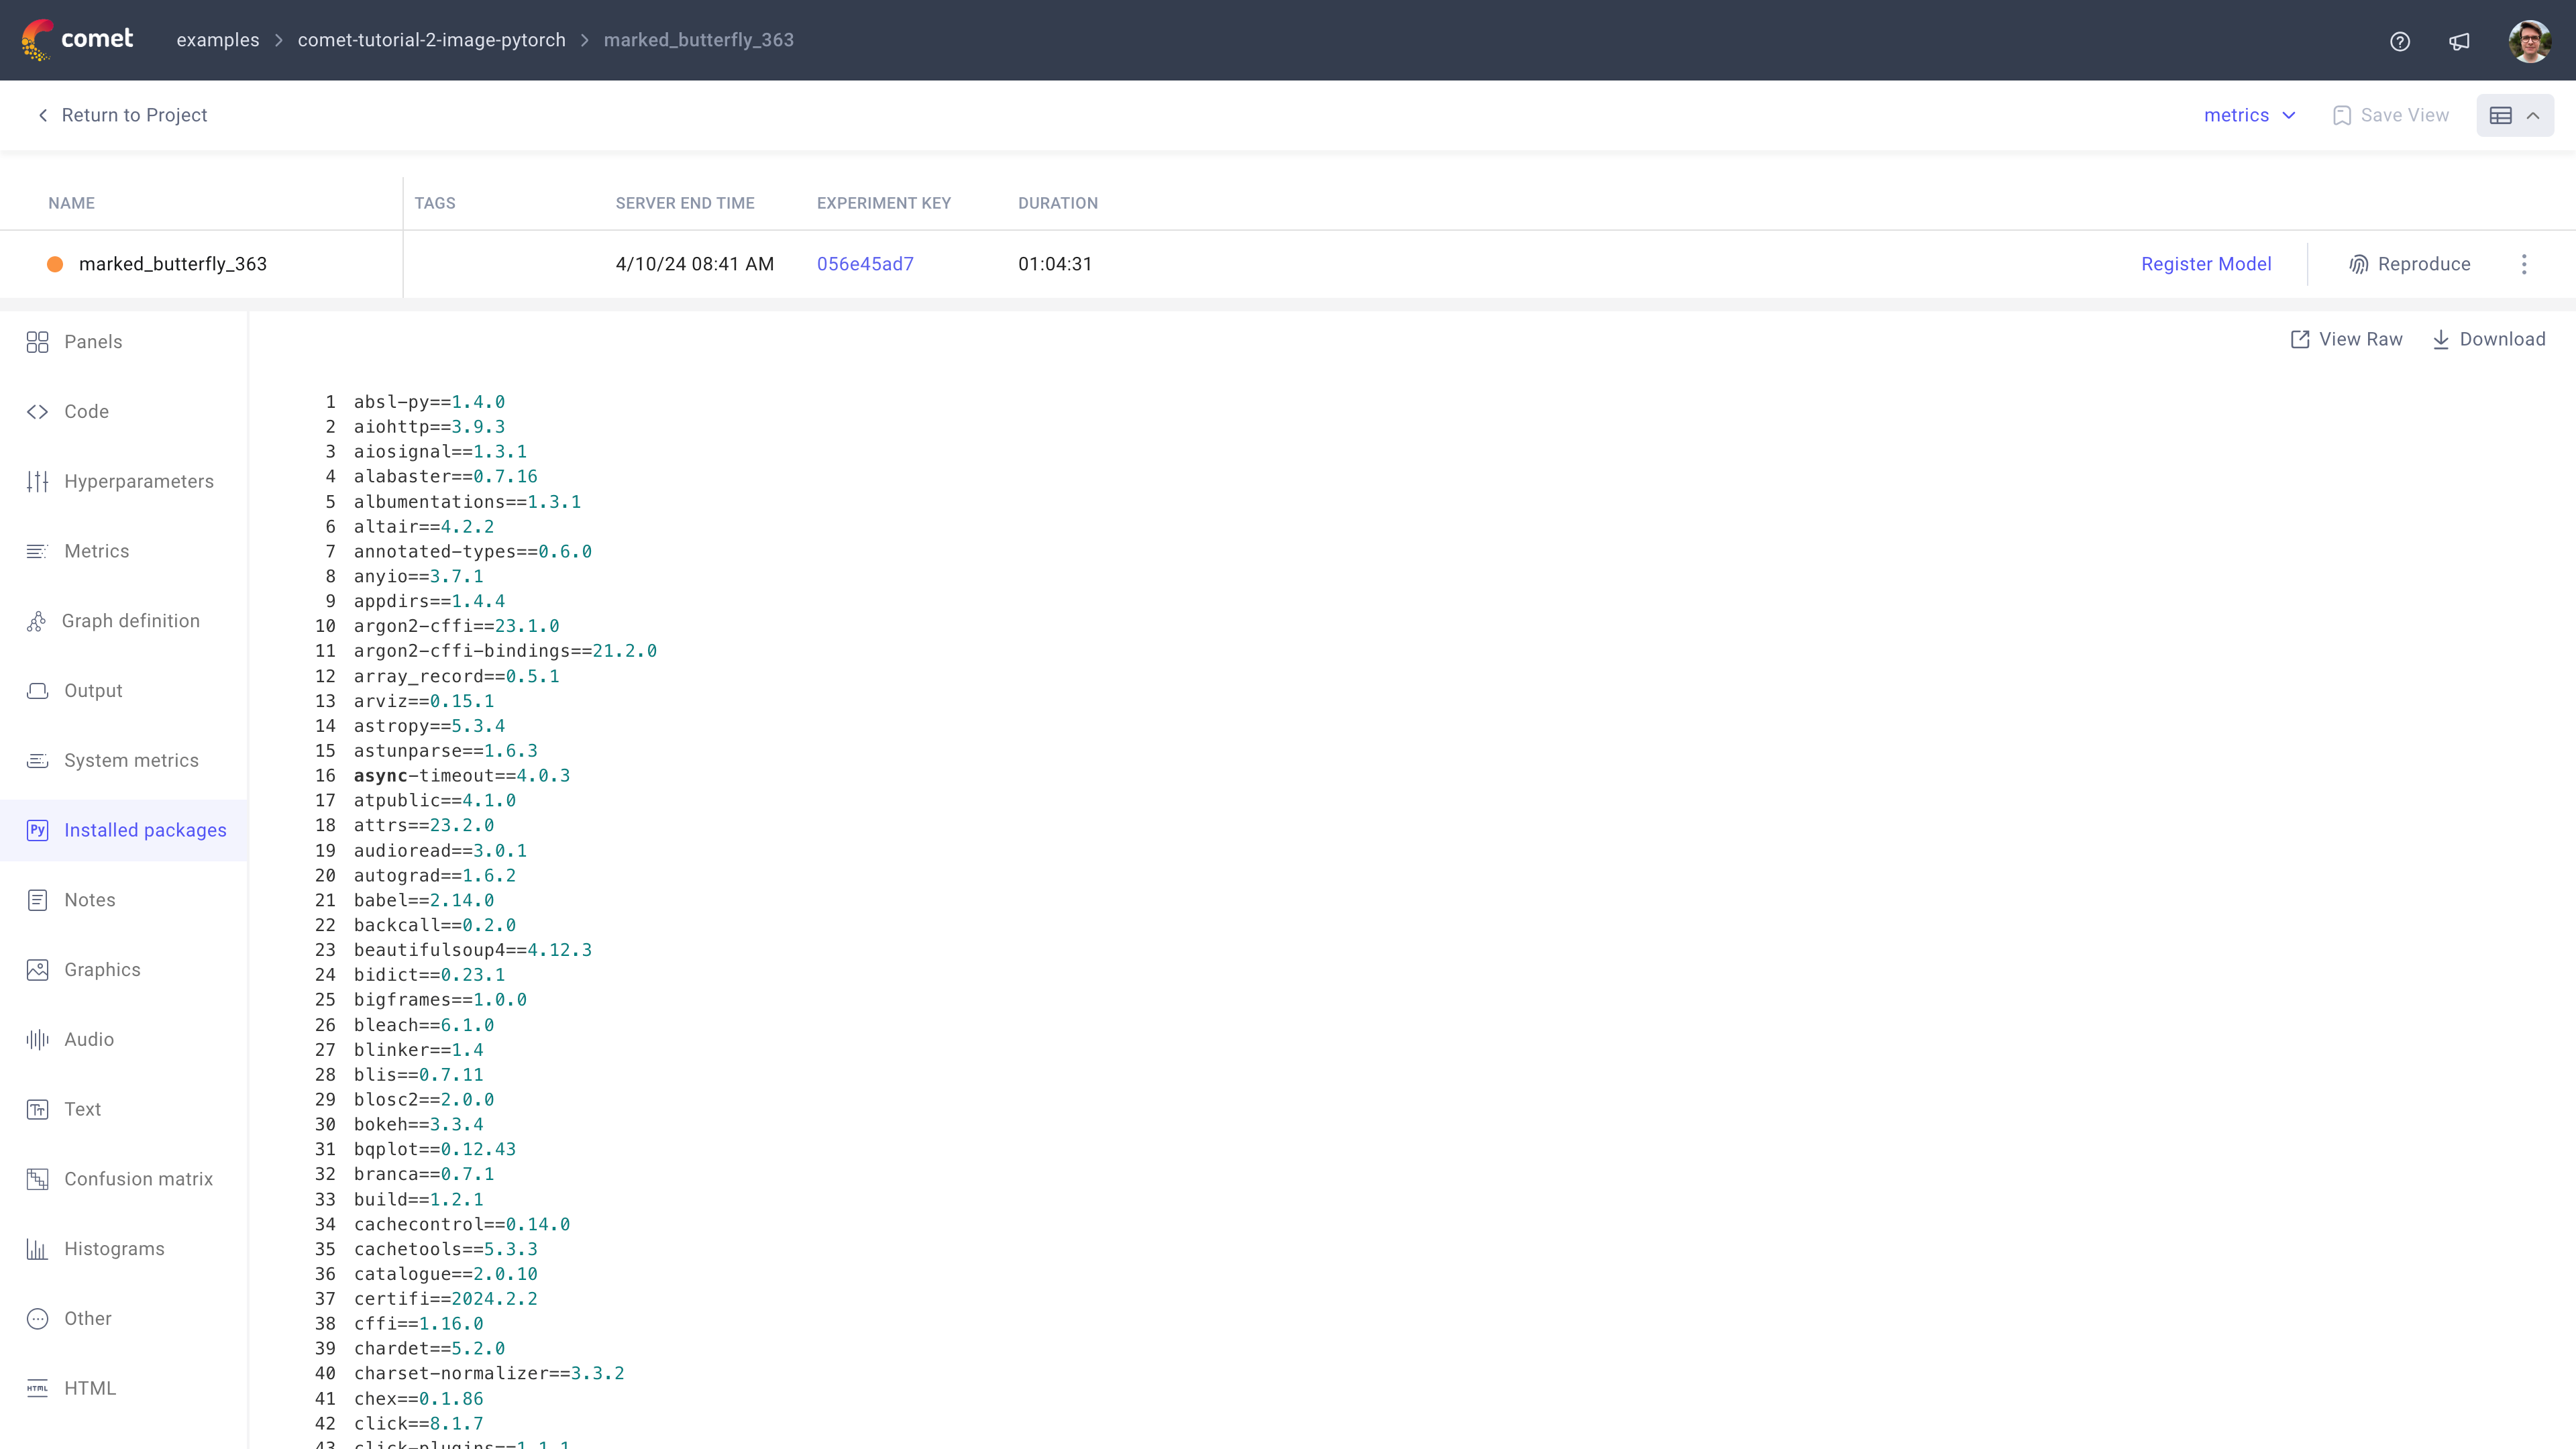
From this tab, you can:
- View the raw file with the list of installed packages
- Download the
.txtfile with the list of installed packages (and optionally change the download filename).
Notes tab
The Notes tab allows you to add and view any added custom information about the experiment.
You can use this to keep track of any unexpected or important-to-know information of the experiment, such as the owner or the creator.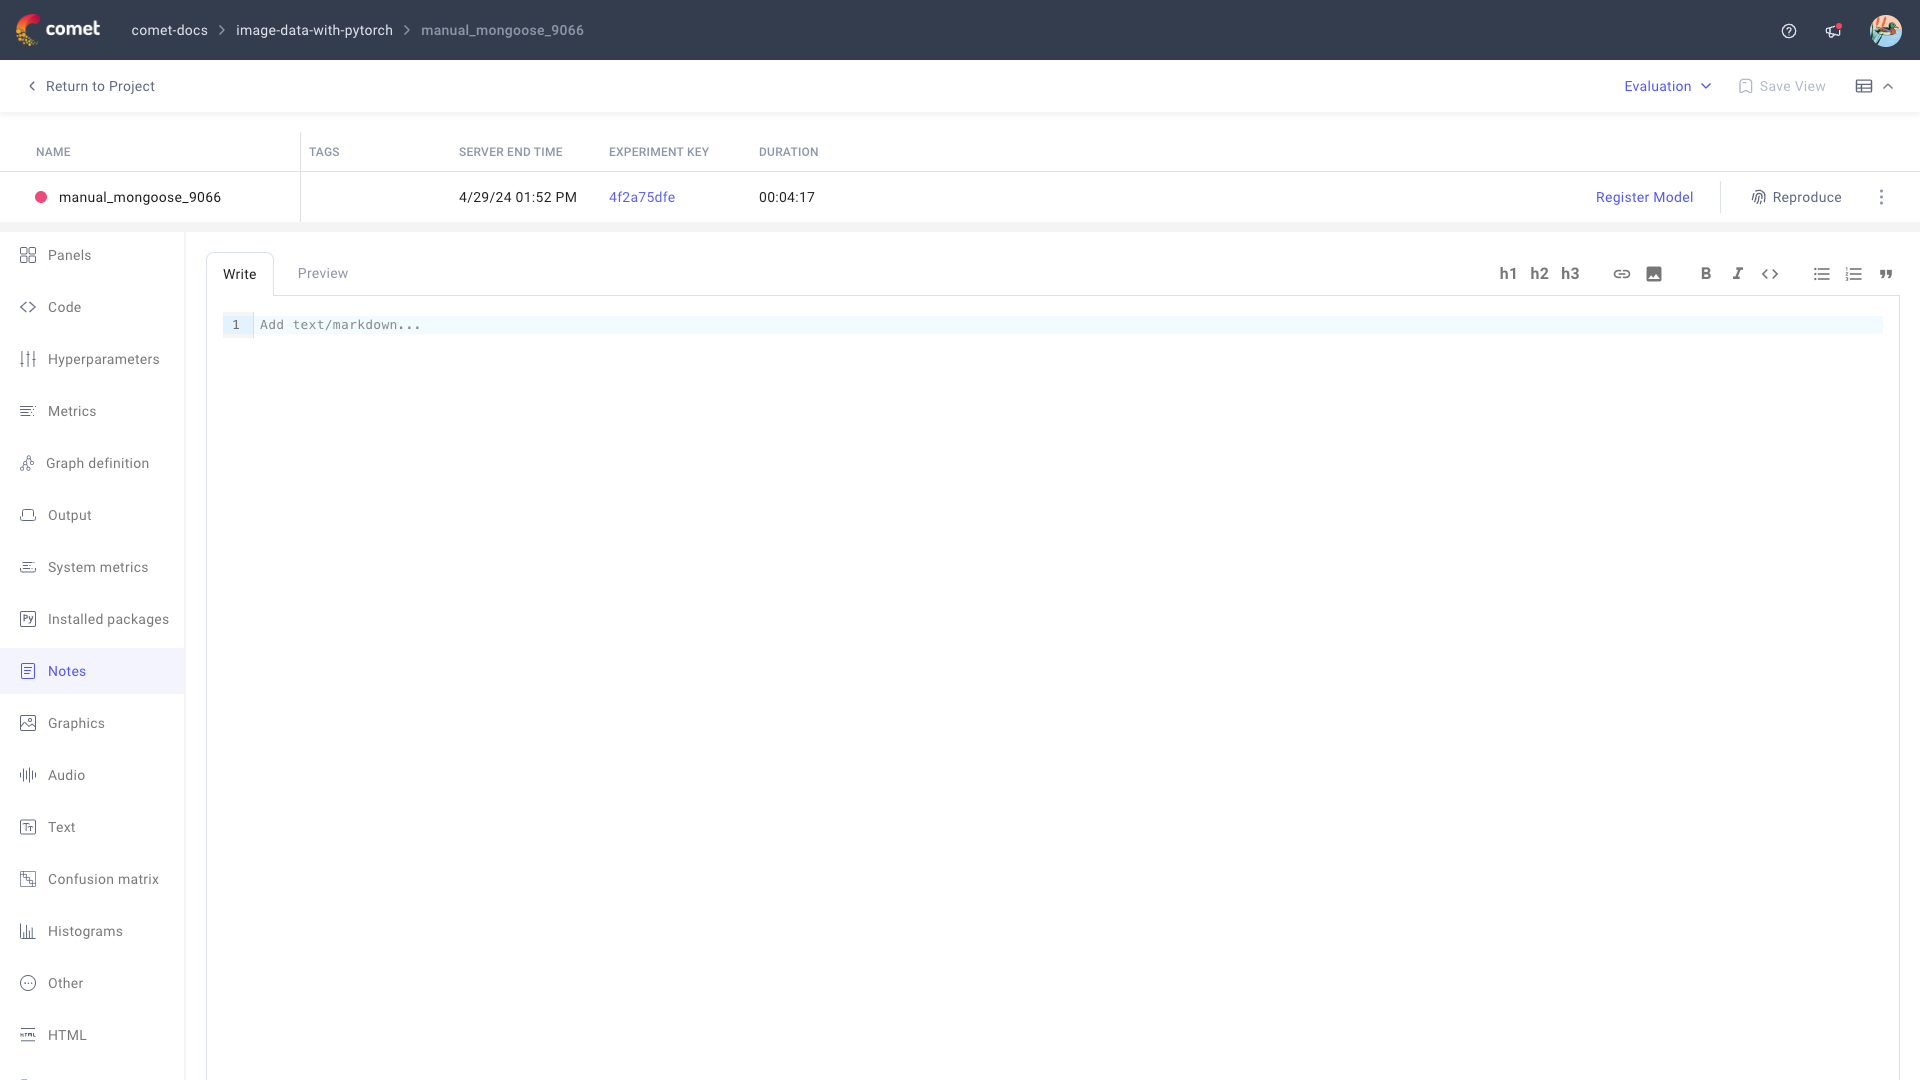
From this tab, you can:
- Preview the custom notes.
- Add custom notes through an interactive Markdown editor.
Graphics tab
The Graphics tab becomes visible when an Experiment has associated:
- Images, logged with
log_image(). - Assets, logged with
log_asset(). - Videos, logged with
log_video().
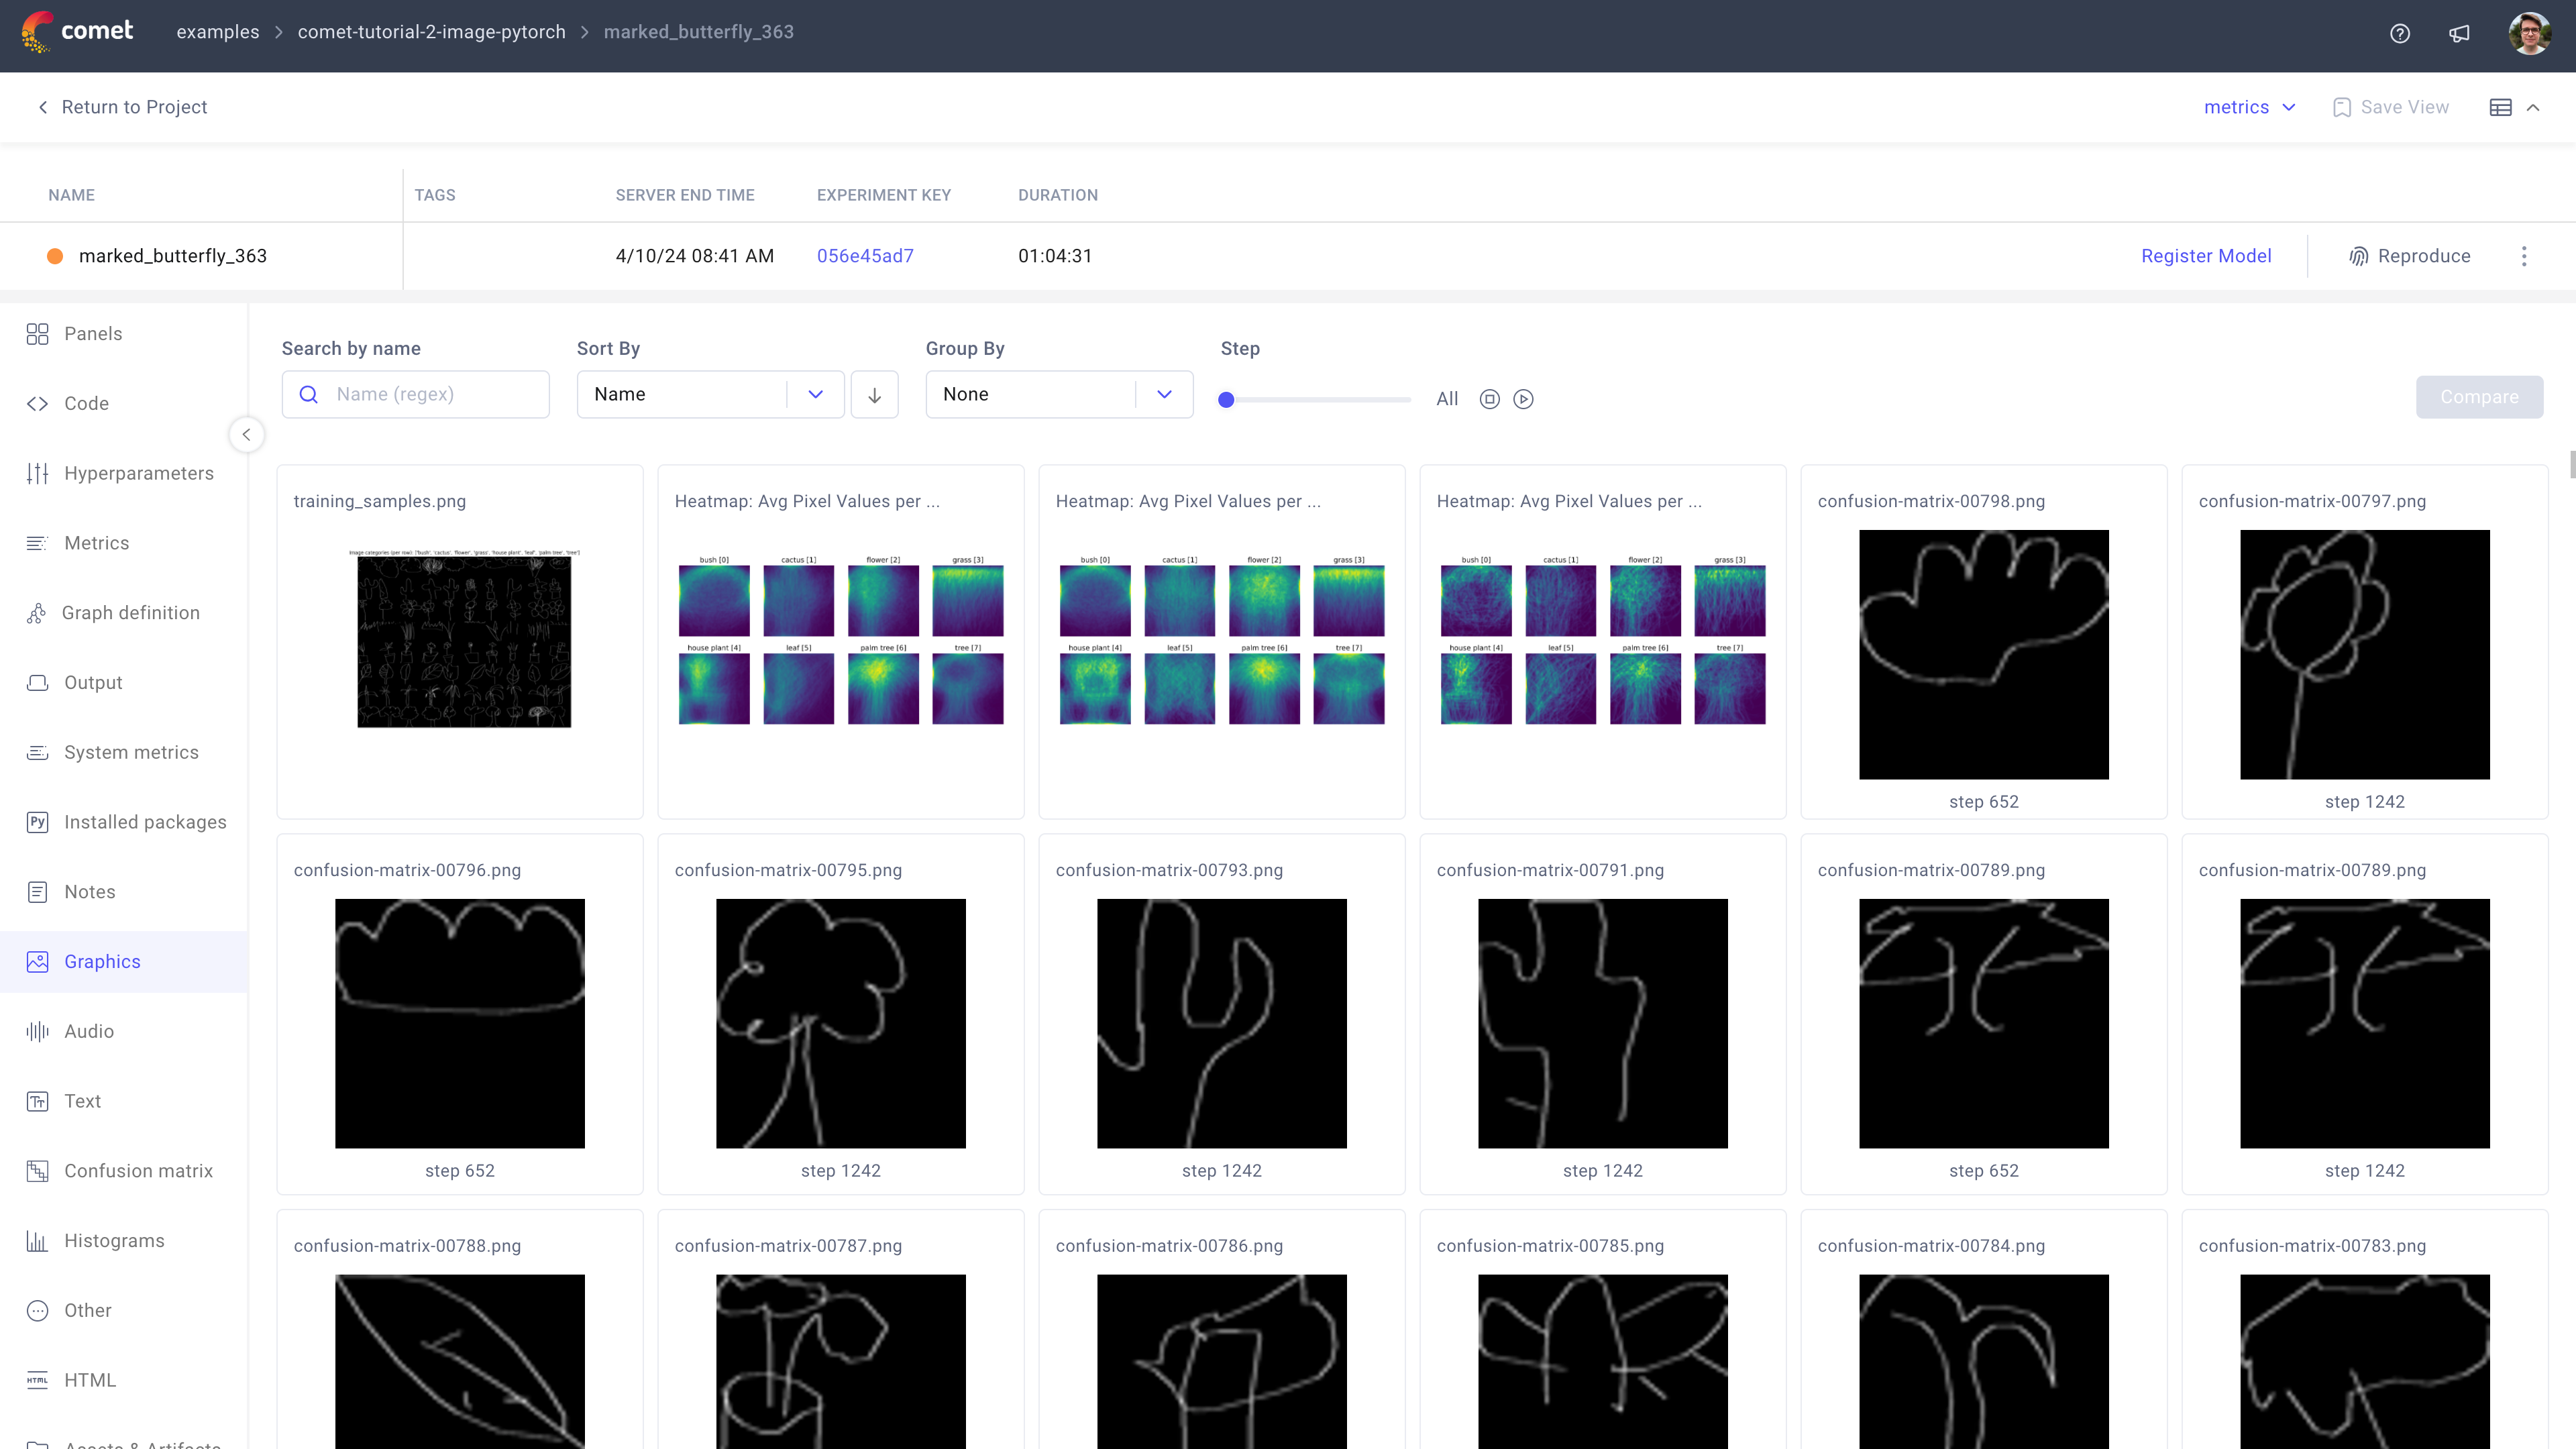
From this tab, you can:
- Search, sort, and group logged graphics.
- Select the step to display the logged graphics at, or animate across steps.
Select one or more logged graphics to compare across experiments.
This will prompt you to create a new panel of the same type as the graphics selected.
Audio tab
The Audio tab shows all audio waveforms uploaded with the log_audio() method.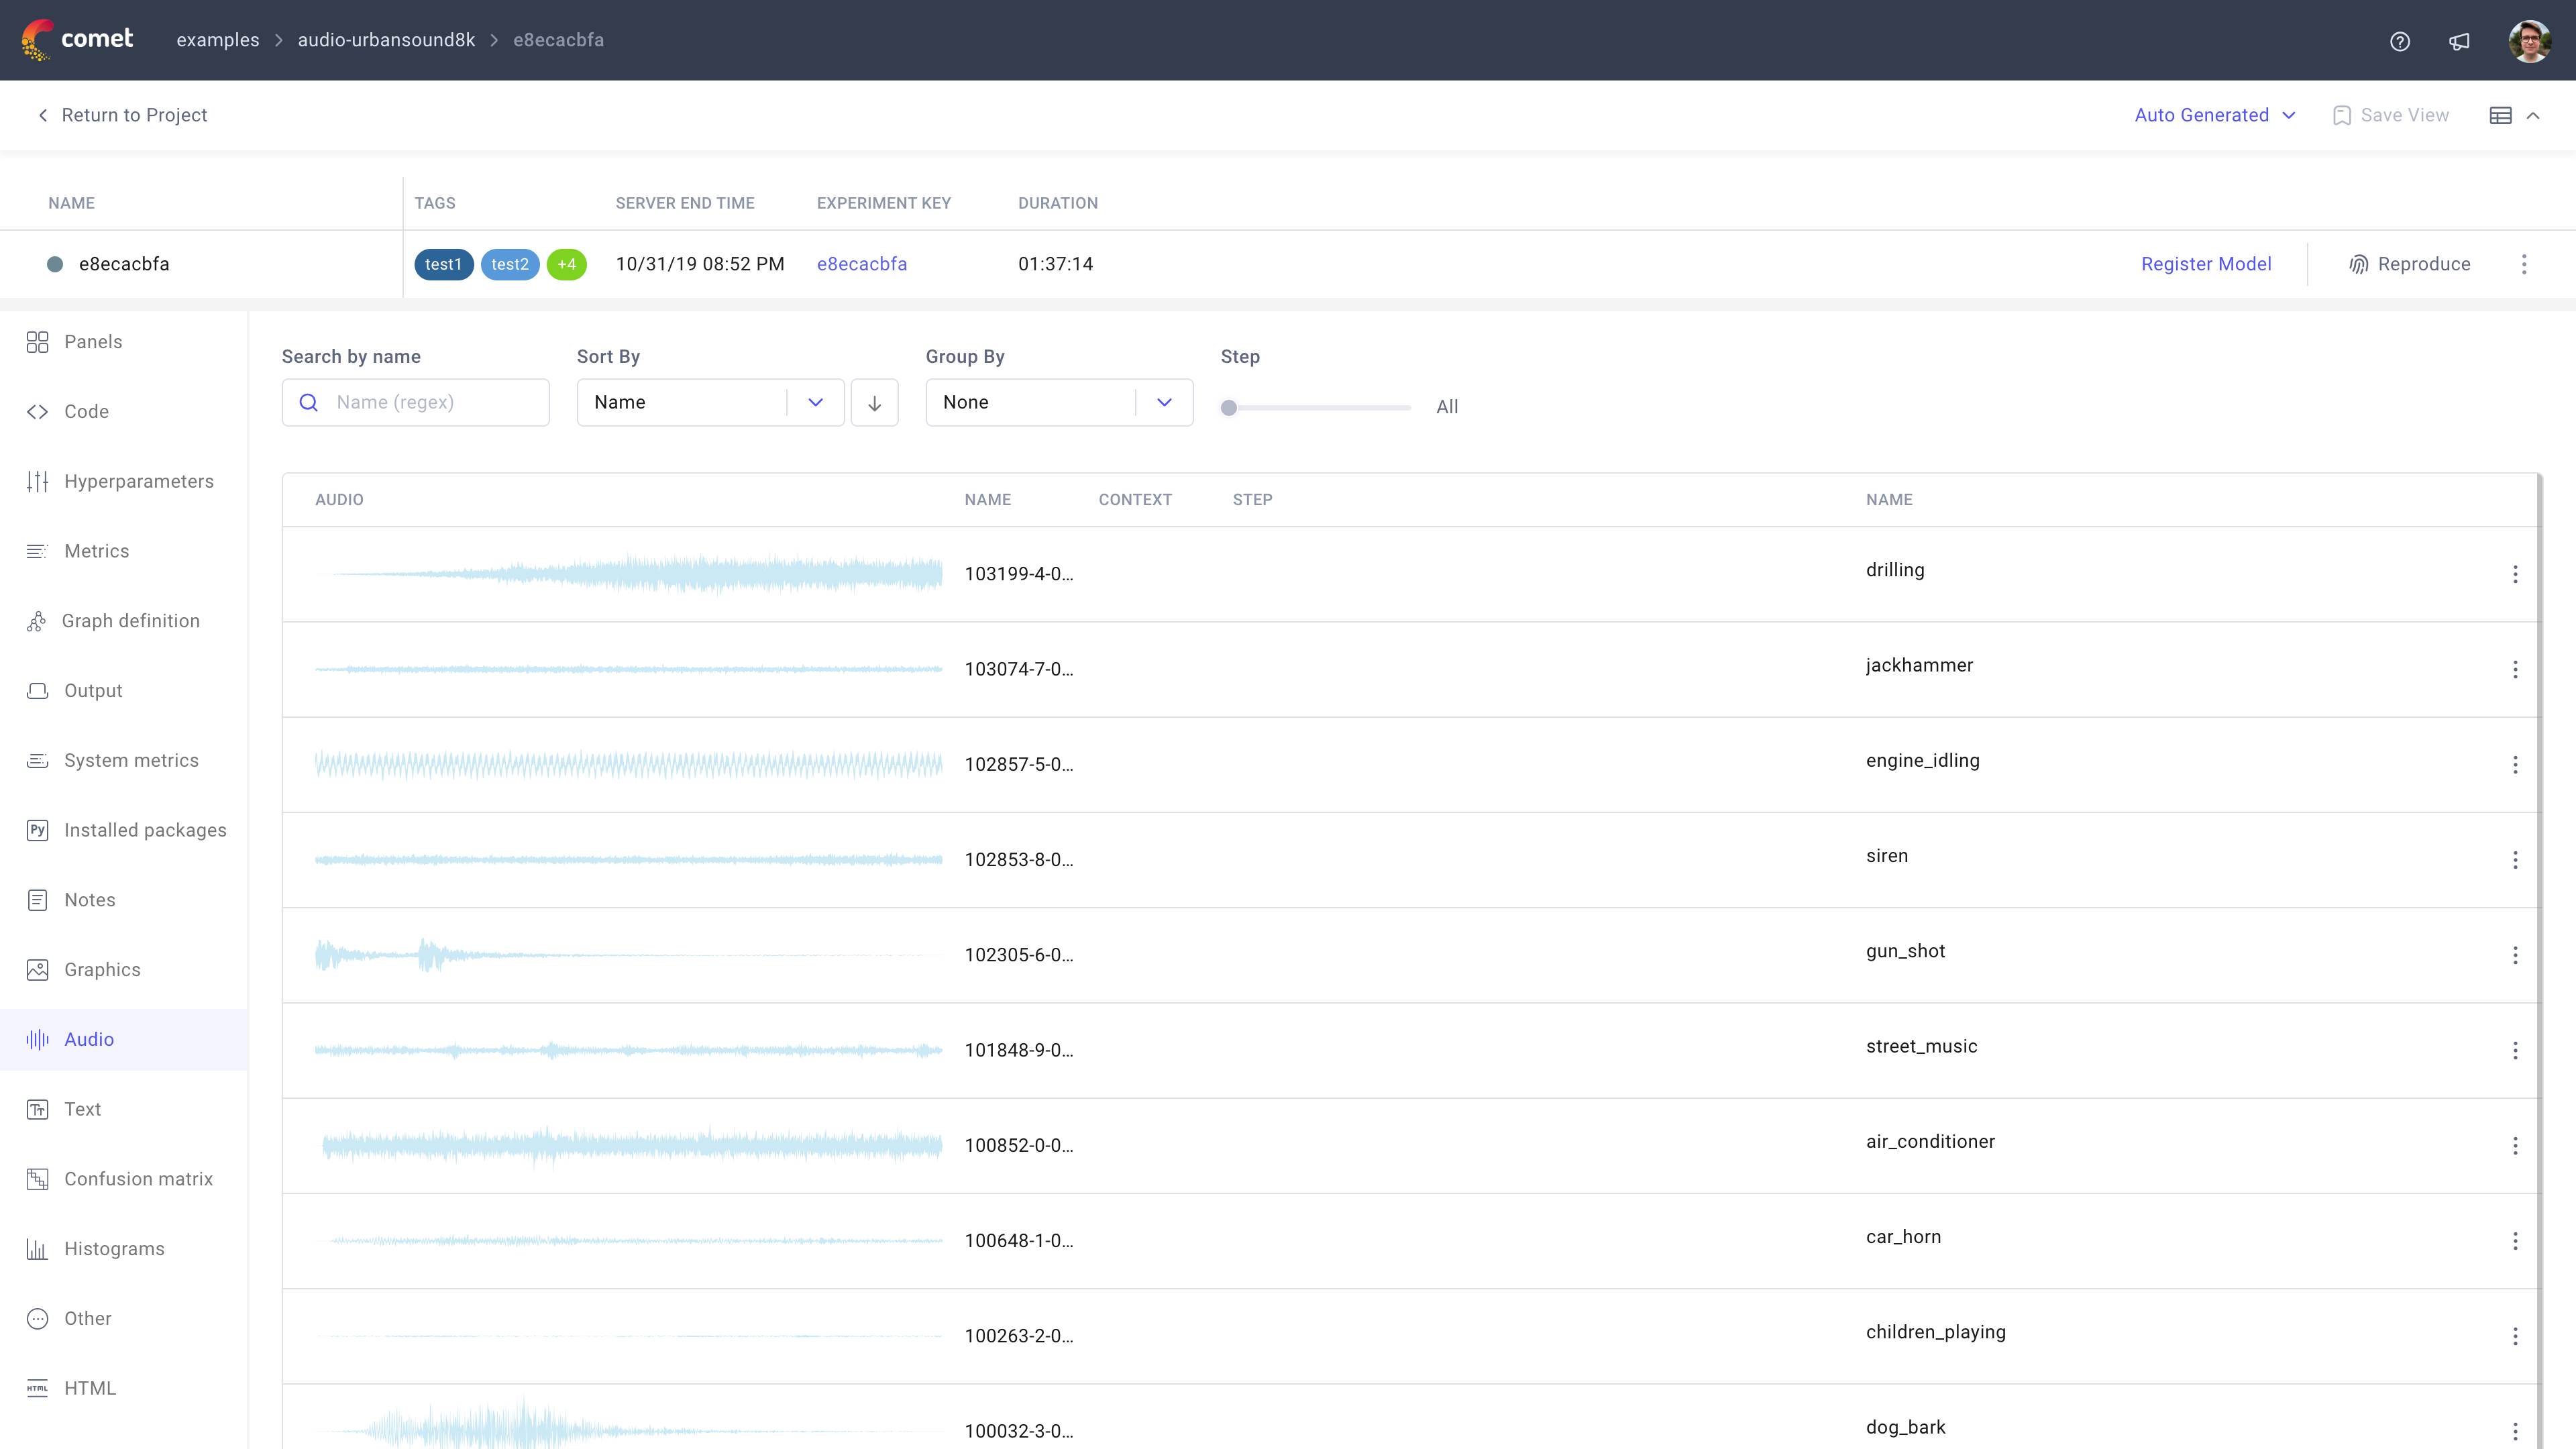
From this tab, you can:
- Search, order, sort, and group logged waveforms.
- Select the step to display the logged waveforms at.
Play any waveform by hovering over the visualization, and pressing the Play icon.
You can also play from any point in the recording by clicking on the desired time before pressing Play.
Text tab
The Text tab shows strings logged with the log_text() method.
The logged text data is displayed in a table format which also provides you with information on the step and any other logged metadata for the text.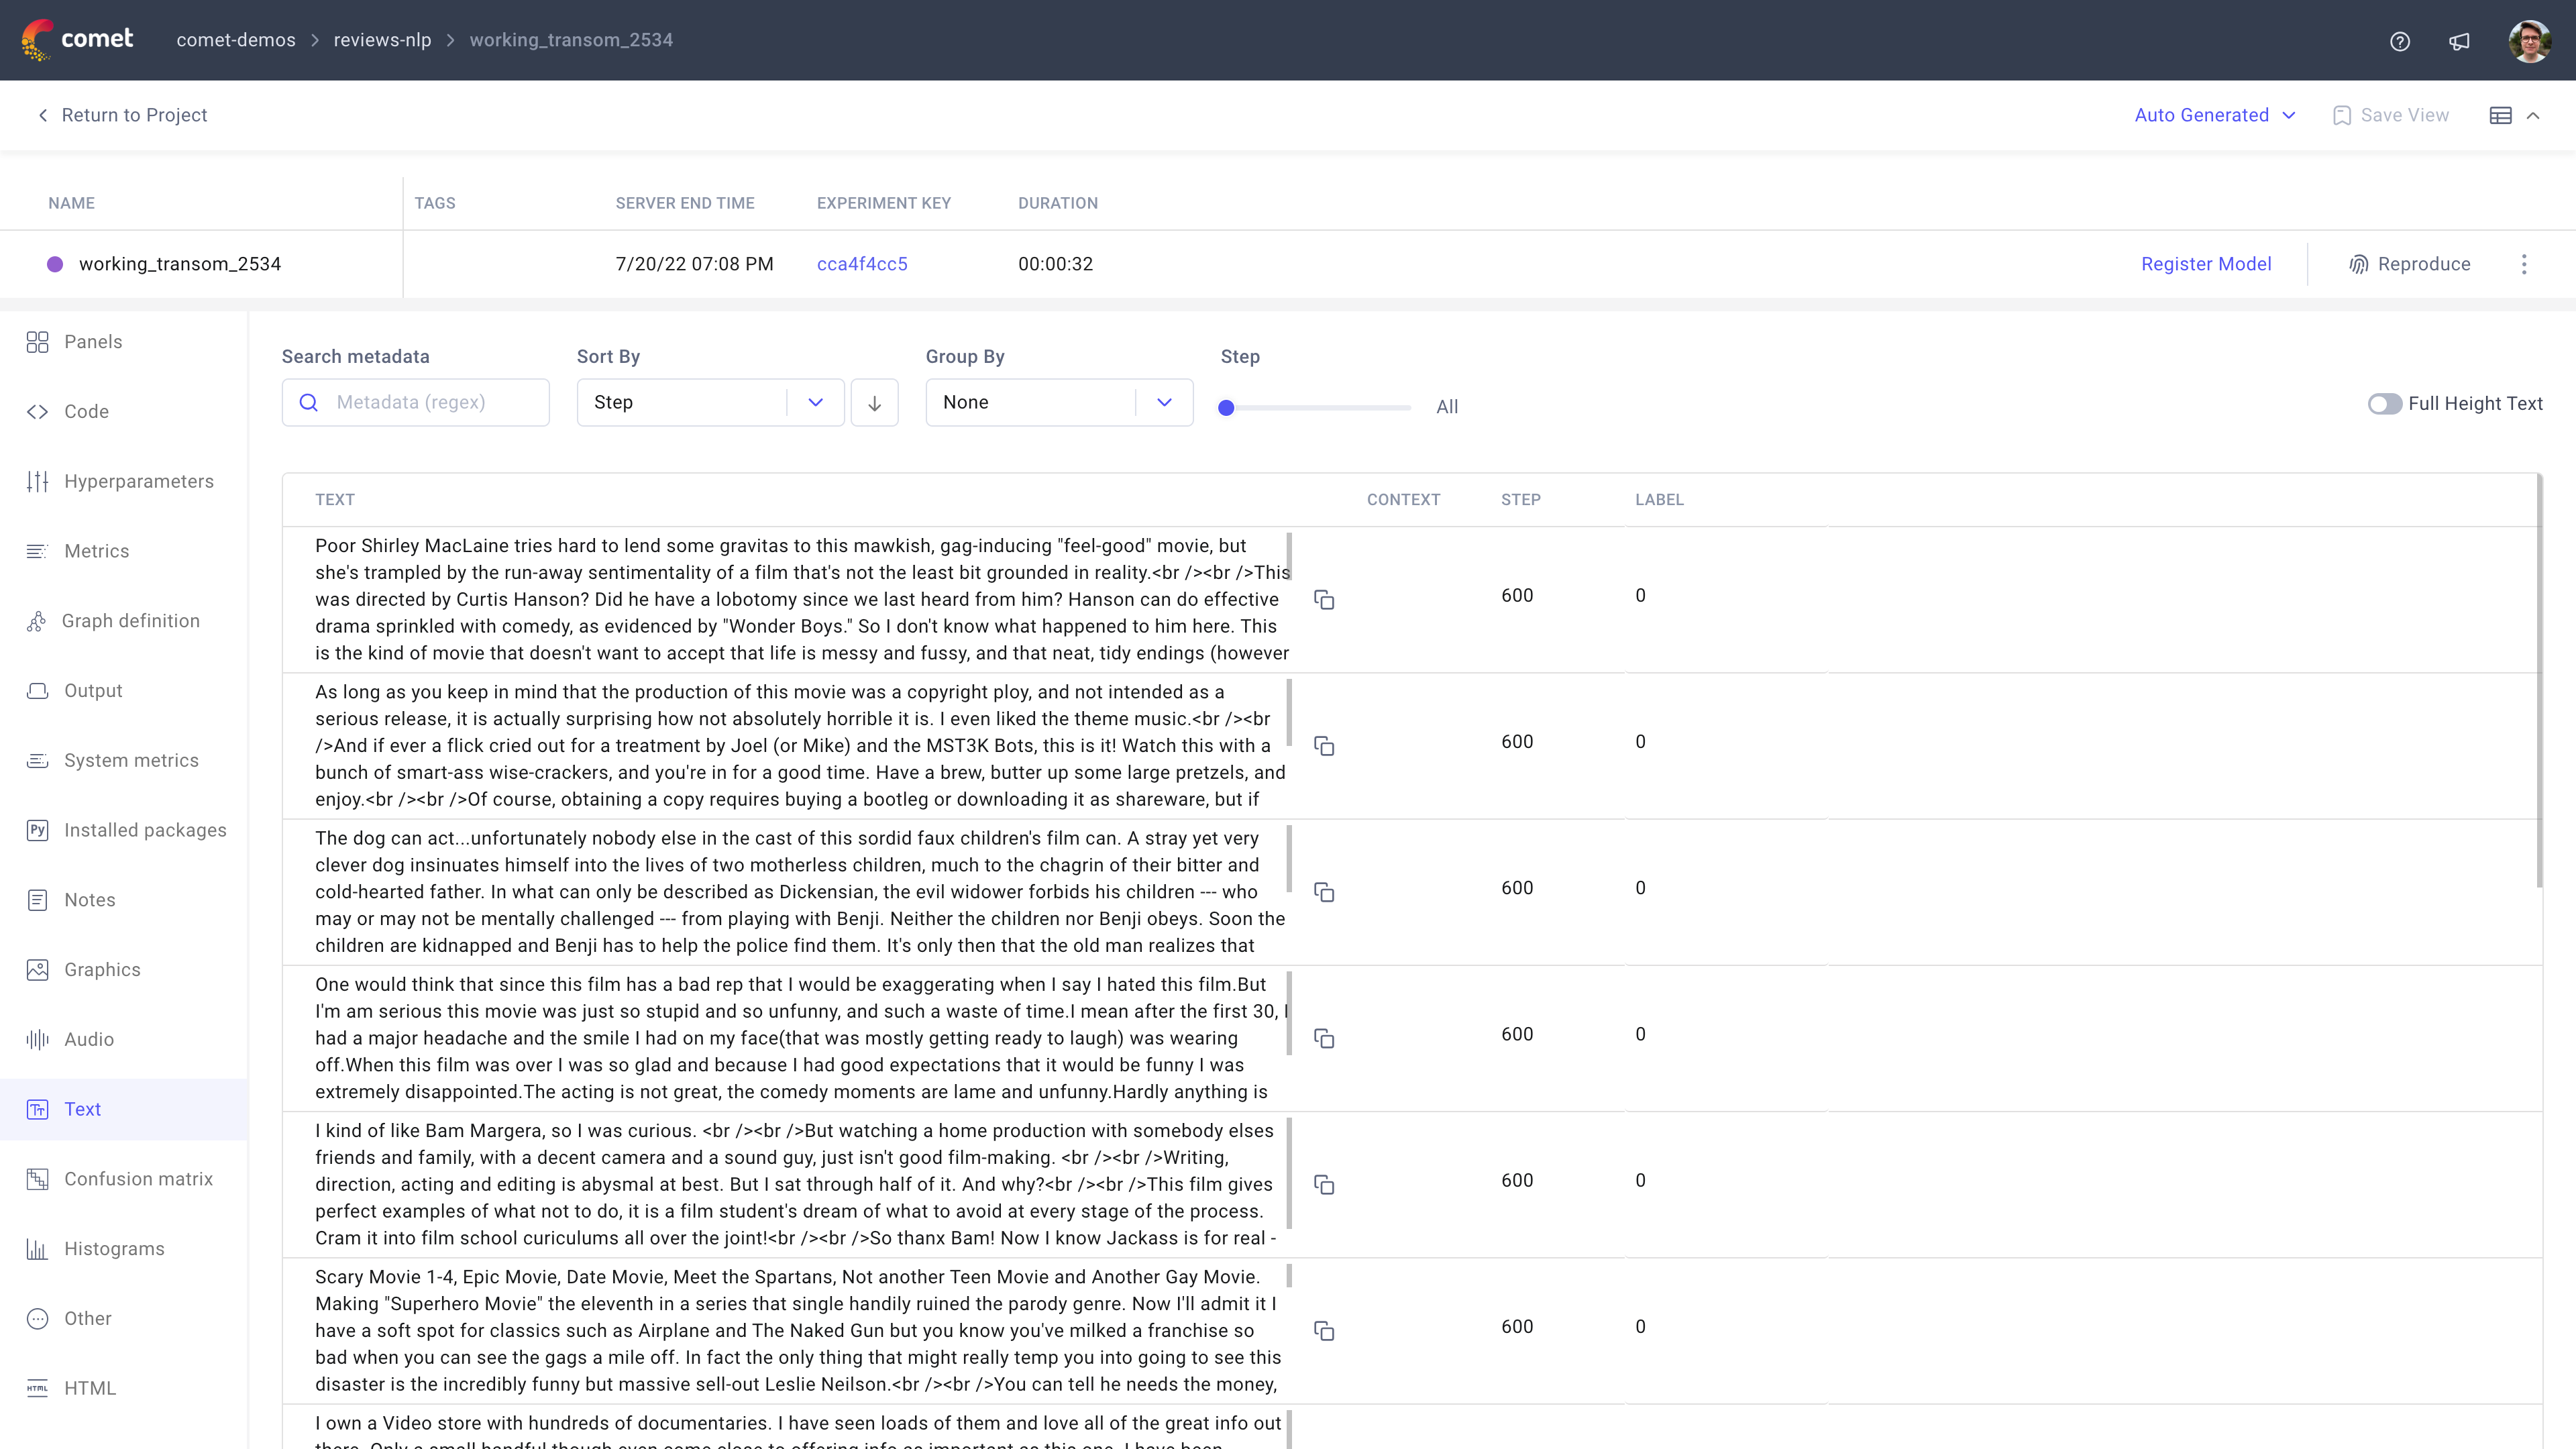
From this tab, you can:
- Search, order, sort, and group logged text data.
- Select the step to display the logged text data at.
Confusion Matrix tab
The Confusion Matrix tab shows confusion matrices logged with the log_confusion_matrix() method.
The confusion matrix is useful for showing the results of categorization problems to clearly discover which categories have been confused with the others (false positives and false negatives).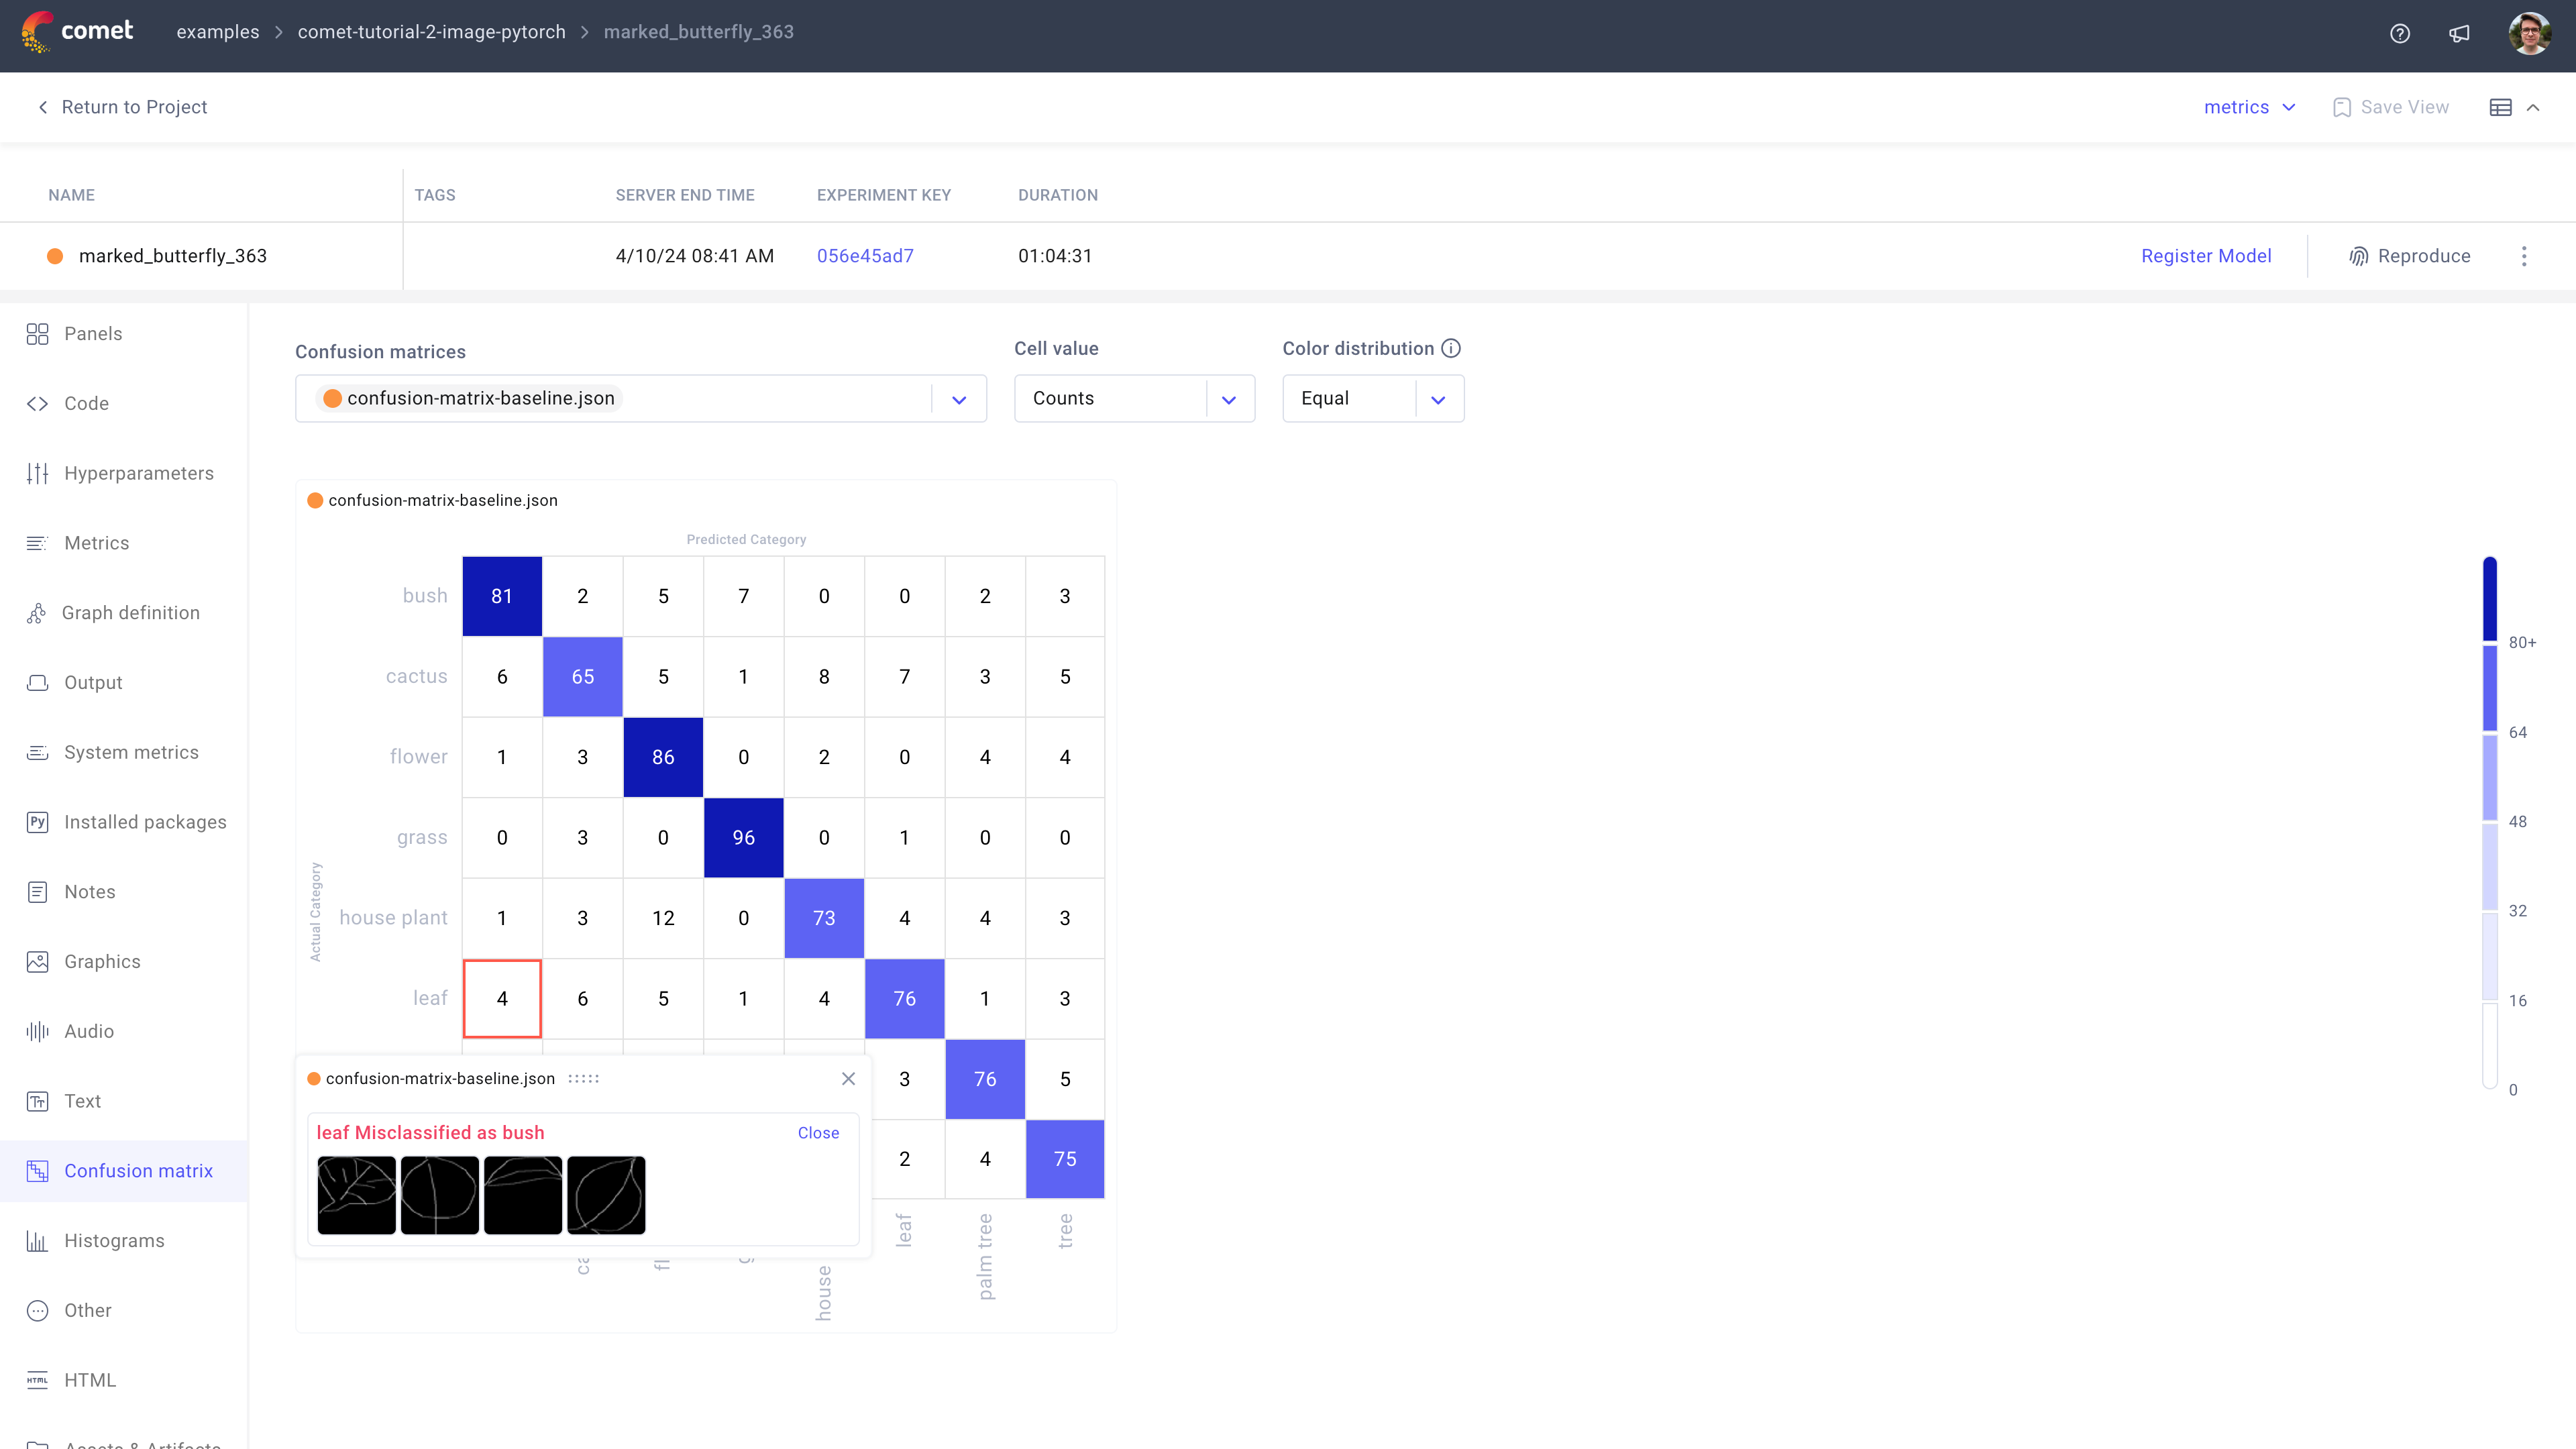
From this tab, you can:
- View the count of true positives, false positives, and false negatives.
Hover over any cell(s) in the confusion matrix to view example instances belonging to that actual vs predicted group.
You can display text, URLs, or images for examples.
Click over an example instance to see its index number (the position in the training or test set).
- Close all open example views by clicking Close all example views in the upper, right-hand corner.
- Move between multiple logged confusion matrices by selecting the name in the upper left corner.
- Display counts (blue), percents by row (green), or percents by column (dark yellow) by changing Cell value.
- Control what categories are displayed (for example, select a subset) using
Experiment.log_confusion_matrix(selected=[...]). - Compute confusion matrices between hundreds or thousands of categories (only the 25 most confused categories will be shown).
For more information and an example, you can read the Debugging Image Classifiers With Confusion Matrices blog post.
Histograms tab
The Histograms tab shows time series histograms logged with the log_histogram_3d() method.
Histograms are typically used for analyzing weights or activations changes over the course of training.
Note
Histograms will not be logged if the step value is not set in the method call. Also, step values should be unique and increasing.
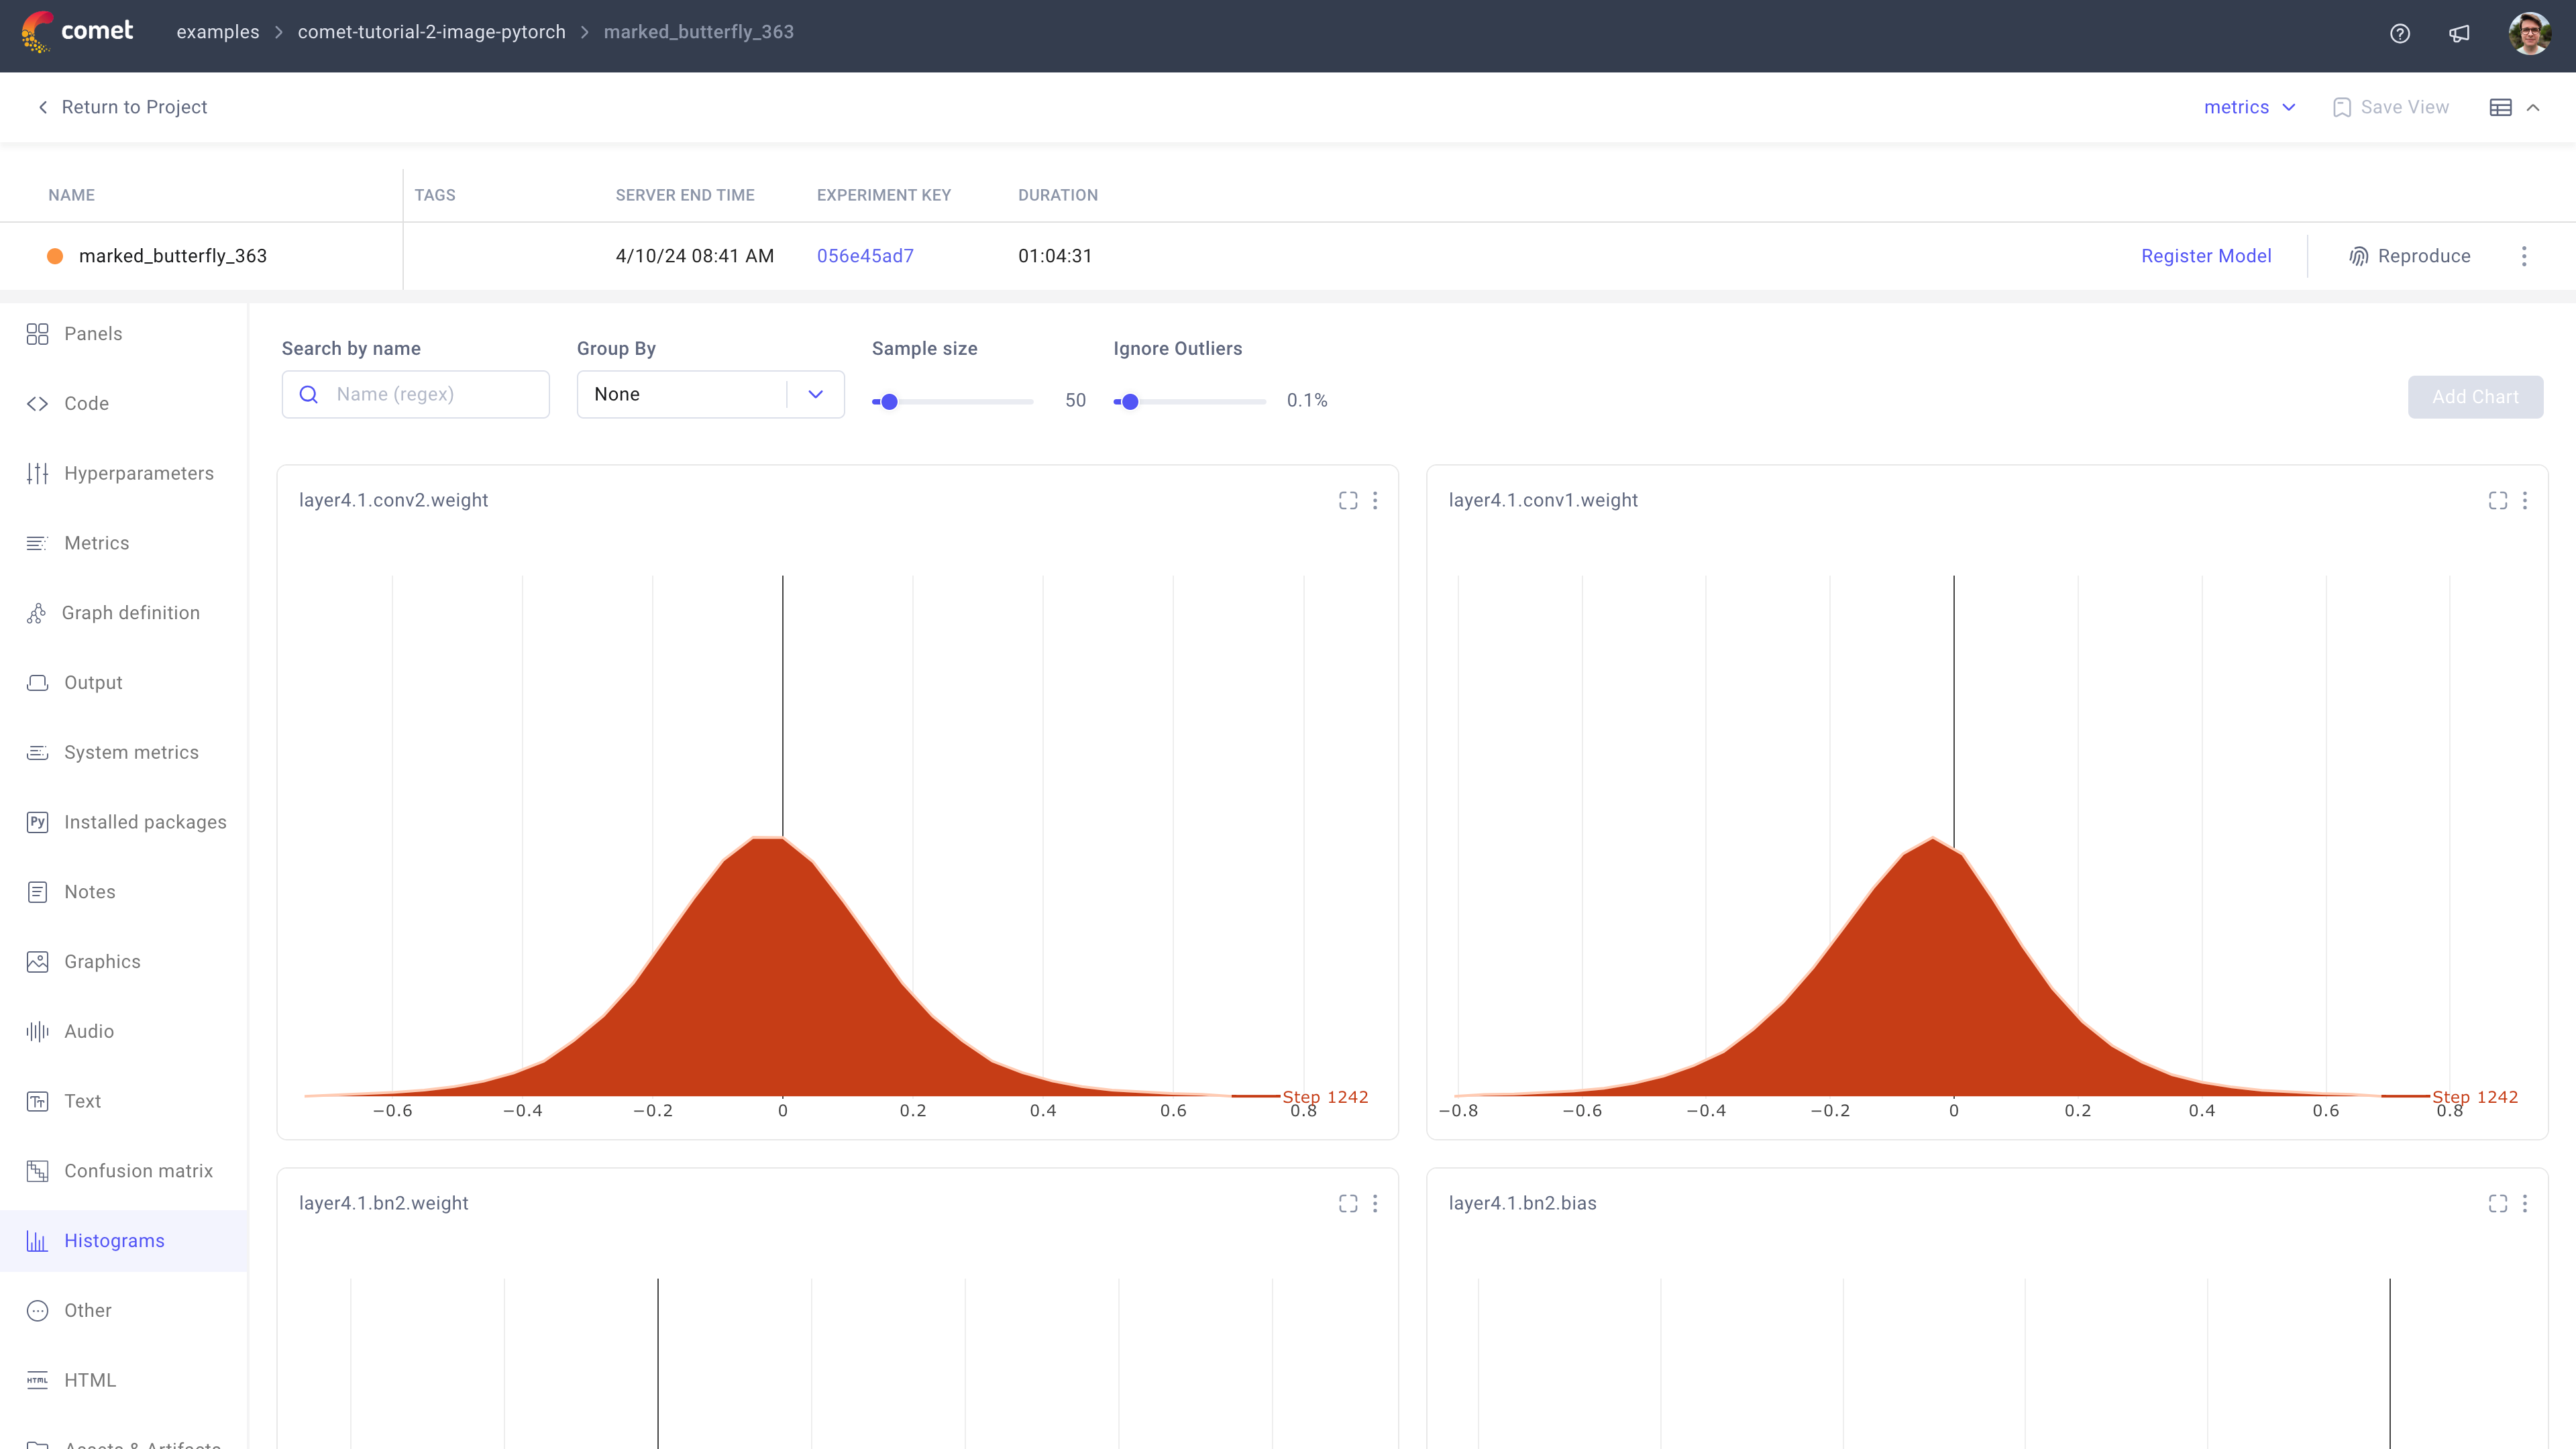
Time series are grouped together by name, and each histogram shows all of the values of a list, tuple, or array (any size or shape). The items are divided into bins, based on their individual values, and the bin keeps a running total. The time series runs from earliest (lowest step) in the back, to early steps in the front.
From this tab, you can:
- Search and group logged histograms.
- Update the sample size.
- Define the percentage of outliers to ignore.
Add a previously deleted chart.
The Add Chart button is displayed if all histograms are displayed, and becomes visible only after at least one histogram has been deleted by clicking on the three dot icon at the top right corner of the histogram plot.
Other tab
The Other tab shows any custom key-value pairs logged with the log_other() or the log_others() methods.
You will typically display here general information which does not fall within metrics and hyperparameters such as datasets attributes, dataset paths, or unique identifiers.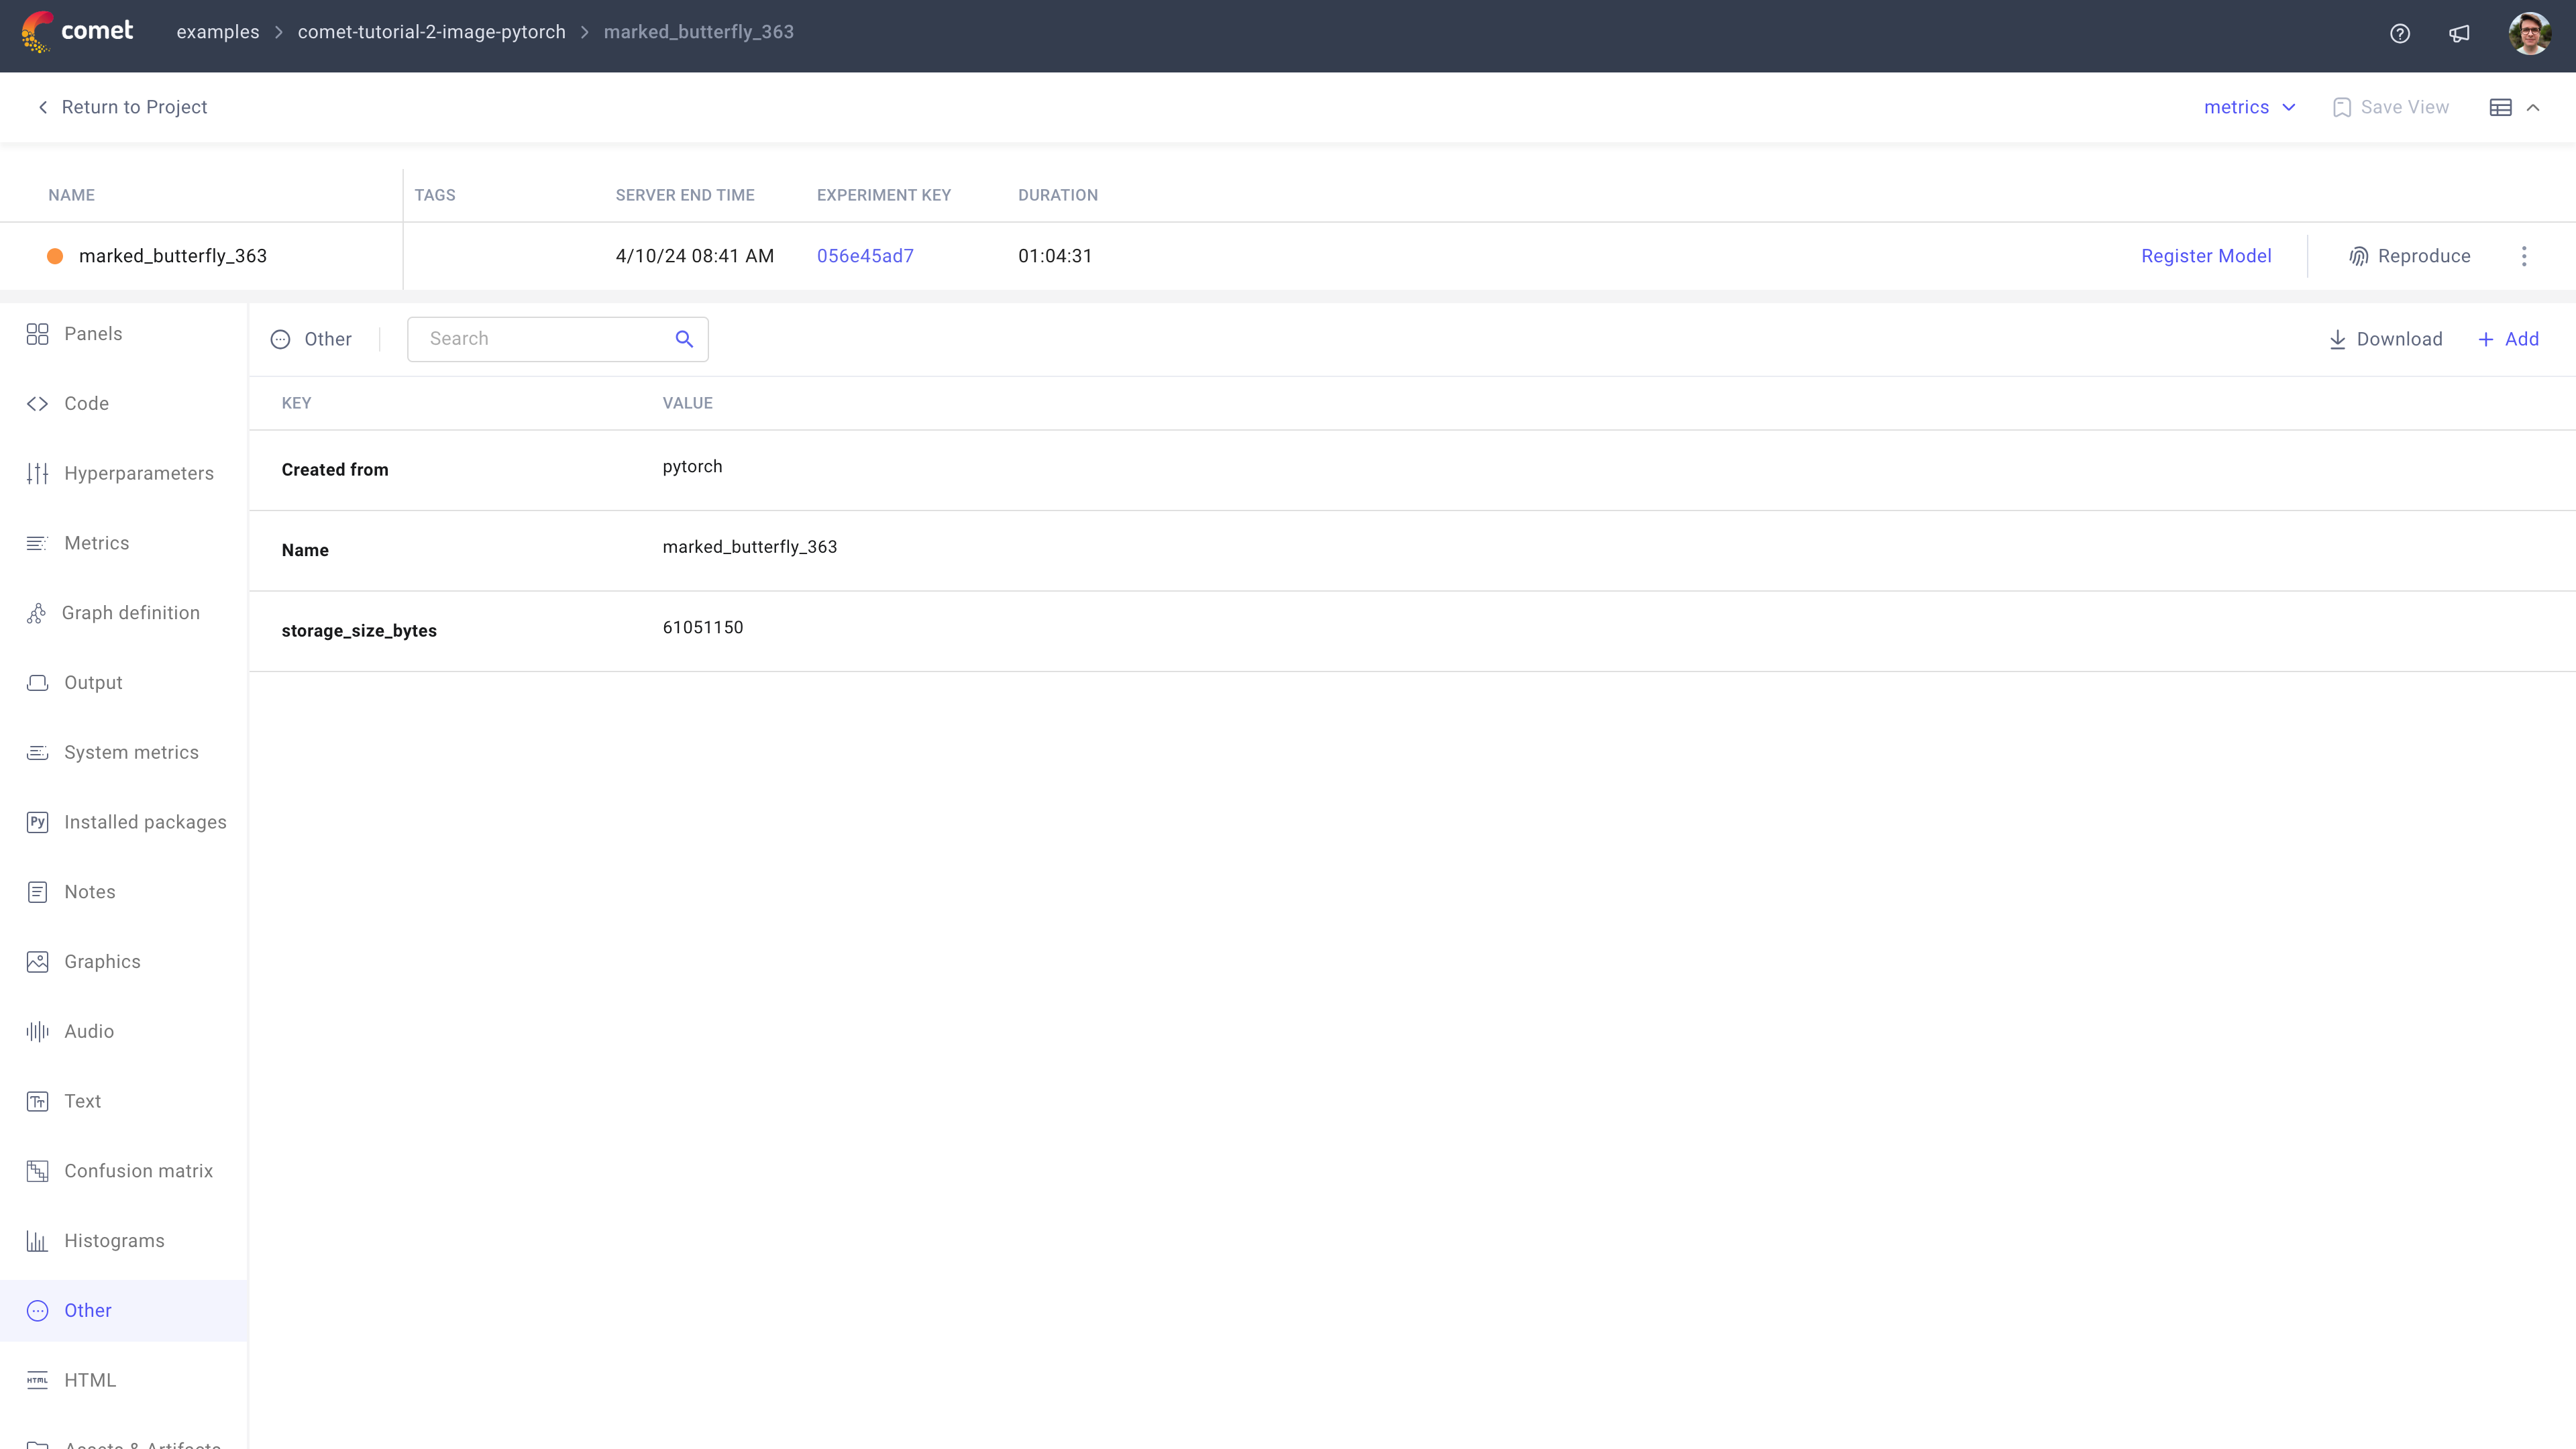
From this tab, you can:
- Search across the logged keys and values.
- Download the key-value pairs as a JSON file.
- If you have read-write access to the experiment, add a key-value pair manually.
HTML tab
The HTML tab displays HTML-based notes logged with the log_html() and log_html_url() methods.
Logging custom HTML can be useful for creating reports.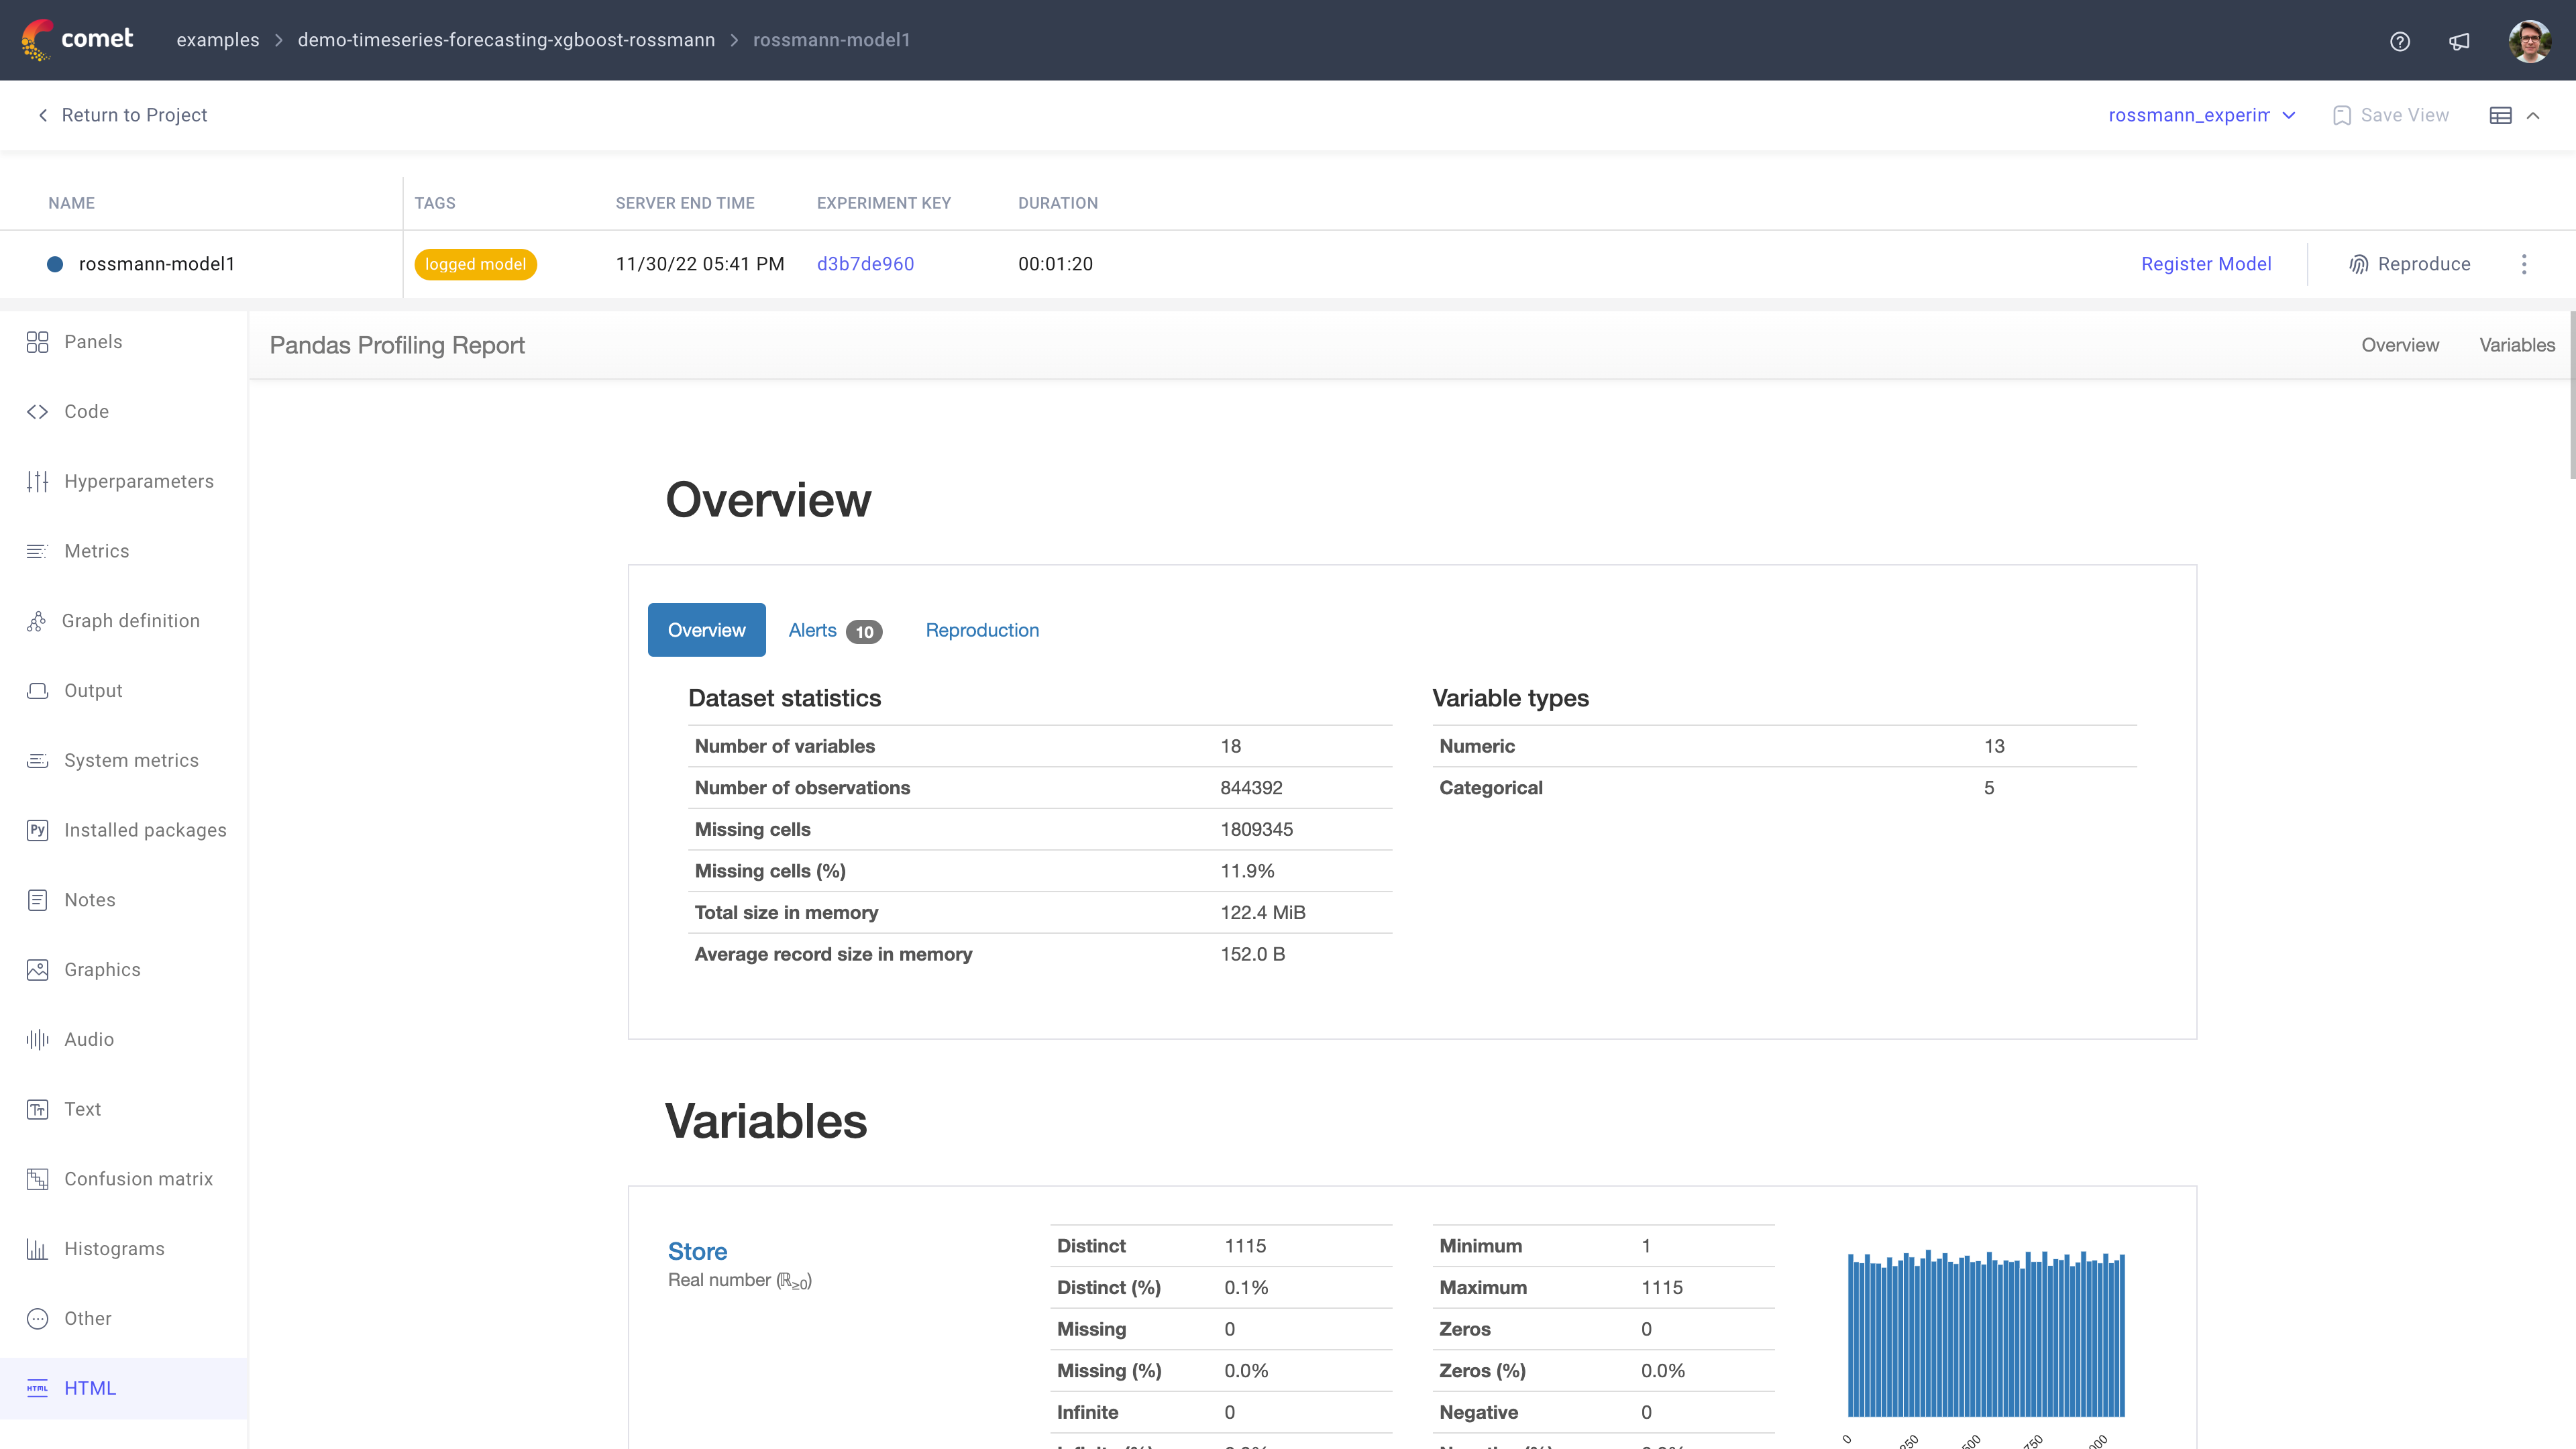
Assets & Artifacts tab
The Assets & Artifacts* tab gives you access to all of the images, models and other assets logged during the experiment.
The assets are organized in folders matching the logging method used: e.g., the confusion-matrixes folder contains assets logged with log_confusion_matrix() method and the models folder contains assets logged with the [log_model()](/docs/v2/api-and-sdk/python-sdk/reference/Experiment/#experimentlog_model] method.
From this tab, you can:
- Search across all logged assets and artifacts.
Click on the asset to open a sidebar on the left from which you can:
- Review asset information: file name, last modified, path, file size, and step.
- Download the asset.
- View the asset.
- If of a supported file extension preview the asset. Supported file extensions for the preview functionalities are:
.csv,.js,.json,.log,.md,.py,.rst,.tsv,.txt,.yaml, and.yml.
Manage the experiment
The experiment row is always displayed at the top of the tabbed experiment attribute views.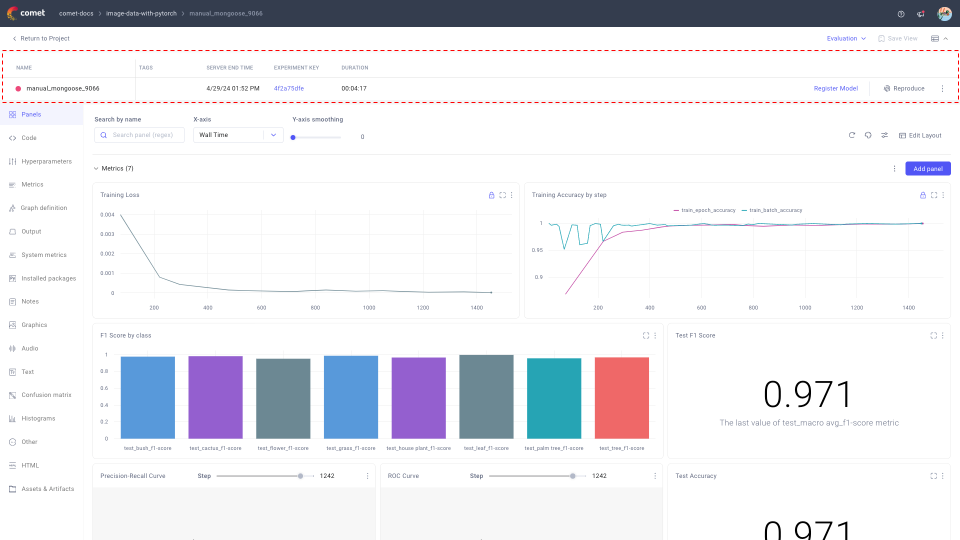
You can hide and show the experiment row by toggling the Table icon in the top right corner of the page.
You may want to hide the experiment row when viewing many panels or analyzing images for example. On the other hand, display the experiment bar to access the management functionalities described below.
Note
The management functionalities are only available if you have read-write access to the project!
View experiment metadata
Hover on the "Name" cell of the experiment row to display the Menu icon, and click on it to show the experiment metadata.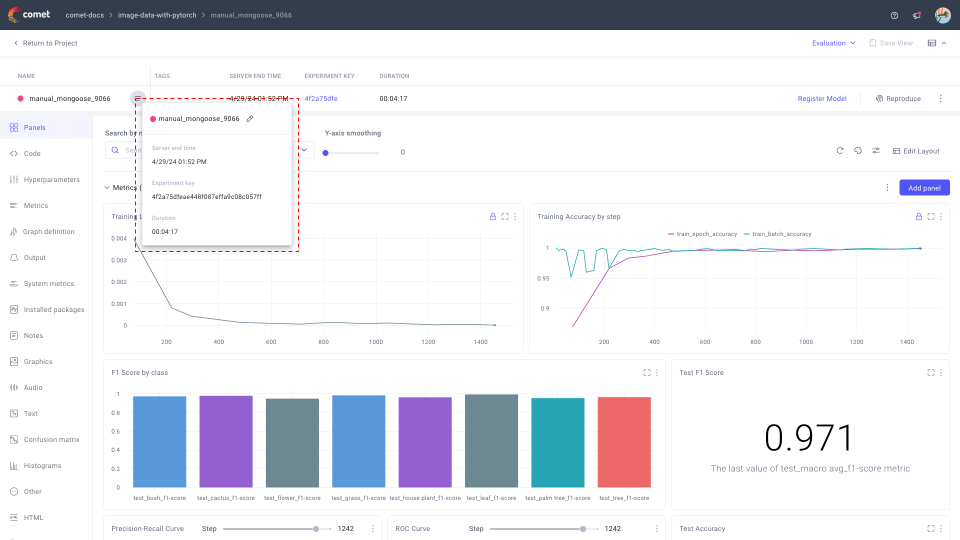
The experiment metadata corresponds to the columns of the experiment row.
Edit an Experiment name
By default, Experiments are given a random ID for a key. You can rename the experiment so that it has a more readable form:
- Hover over the Experiment name.
- Click the Show metadata icon.
- Hover over the Experiment name in the window that opens.
- Click the pencil icon, enter a name, then click the check mark to save the change.
Register Model
Find more information in the [Using Model Registry]/docs/v2/guides/model-registry/using-model-registry/#register-a-model-from-the-ui) page.
Note that, if there are no models logged for the experiment, a sidebar appears that you can follow to learn how to log a model.
Reproduce an Experiment
With Comet, you can always re-run a past experiment using the same code, command, and parameters that were used then. This is particularly useful to build up on previous work as well as to revert to an older model state.
When you click on the Reproduce button, a window is displayed that provides you all the information and instructions you need to re-run the experiment:
- Environment Information: IP, host name, and user name.
- Git Information: Link to the last commit, current branch, and a patch with uncommitted changes.
- Reproduce: The git commands you need to download the codeset locally.
- Run: The command that was used to execute the experiment.

Info
The set of commands checks out the correct branch and commit. In case there were uncommitted changes in your code when the experiment was originally launched, the patch will allow you to include those as well.
Perform more operations on an Experiment
There are buttons across the top of the Experiment details for performing the following actions:
- Reproduce: See the previous section.
- Stop: Stop an experiment that is running on your computer, cluster, or on a remote system, while it is reporting to Comet.
- Archive: Soft-delete Experiments. Navigate to the Project Archive tab to either restore or permanently delete your archived Experiments.
- Move: Move your Experiment to another Project. If you choose, the move can be by symbolic link (symlink). In that case, the Experiment remains in the current Project and a reference is added to the target Project.
- Tag: Add a tag to your Experiment. You can also programmatically populate tags with the
Experiment.add_tag()method. To create a new tag, just enter the text and press Enter.