Overview
The Project page of an ML Experiment Tracking project is composed of six (sub)pages: Panels, Experiments, Notes, Archive, Manage, and Reports.
Together, these pages provide you with all the functionalities and insights necessary for the end-to-end management of your ML experiments.
The Panels and Experiments pages
The Panels and Experiments pages are the core functionalities of an Experiment Management project. They both provide you with a complete list of experiments run in the project, and then:
- The Panels page offers a customizable dashboard that allows you to quickly gauge the performance of your project.
Discover more from the
[Panels page](/docs/v2/guides/comet-ui/experiment-management/panels-page/) page.
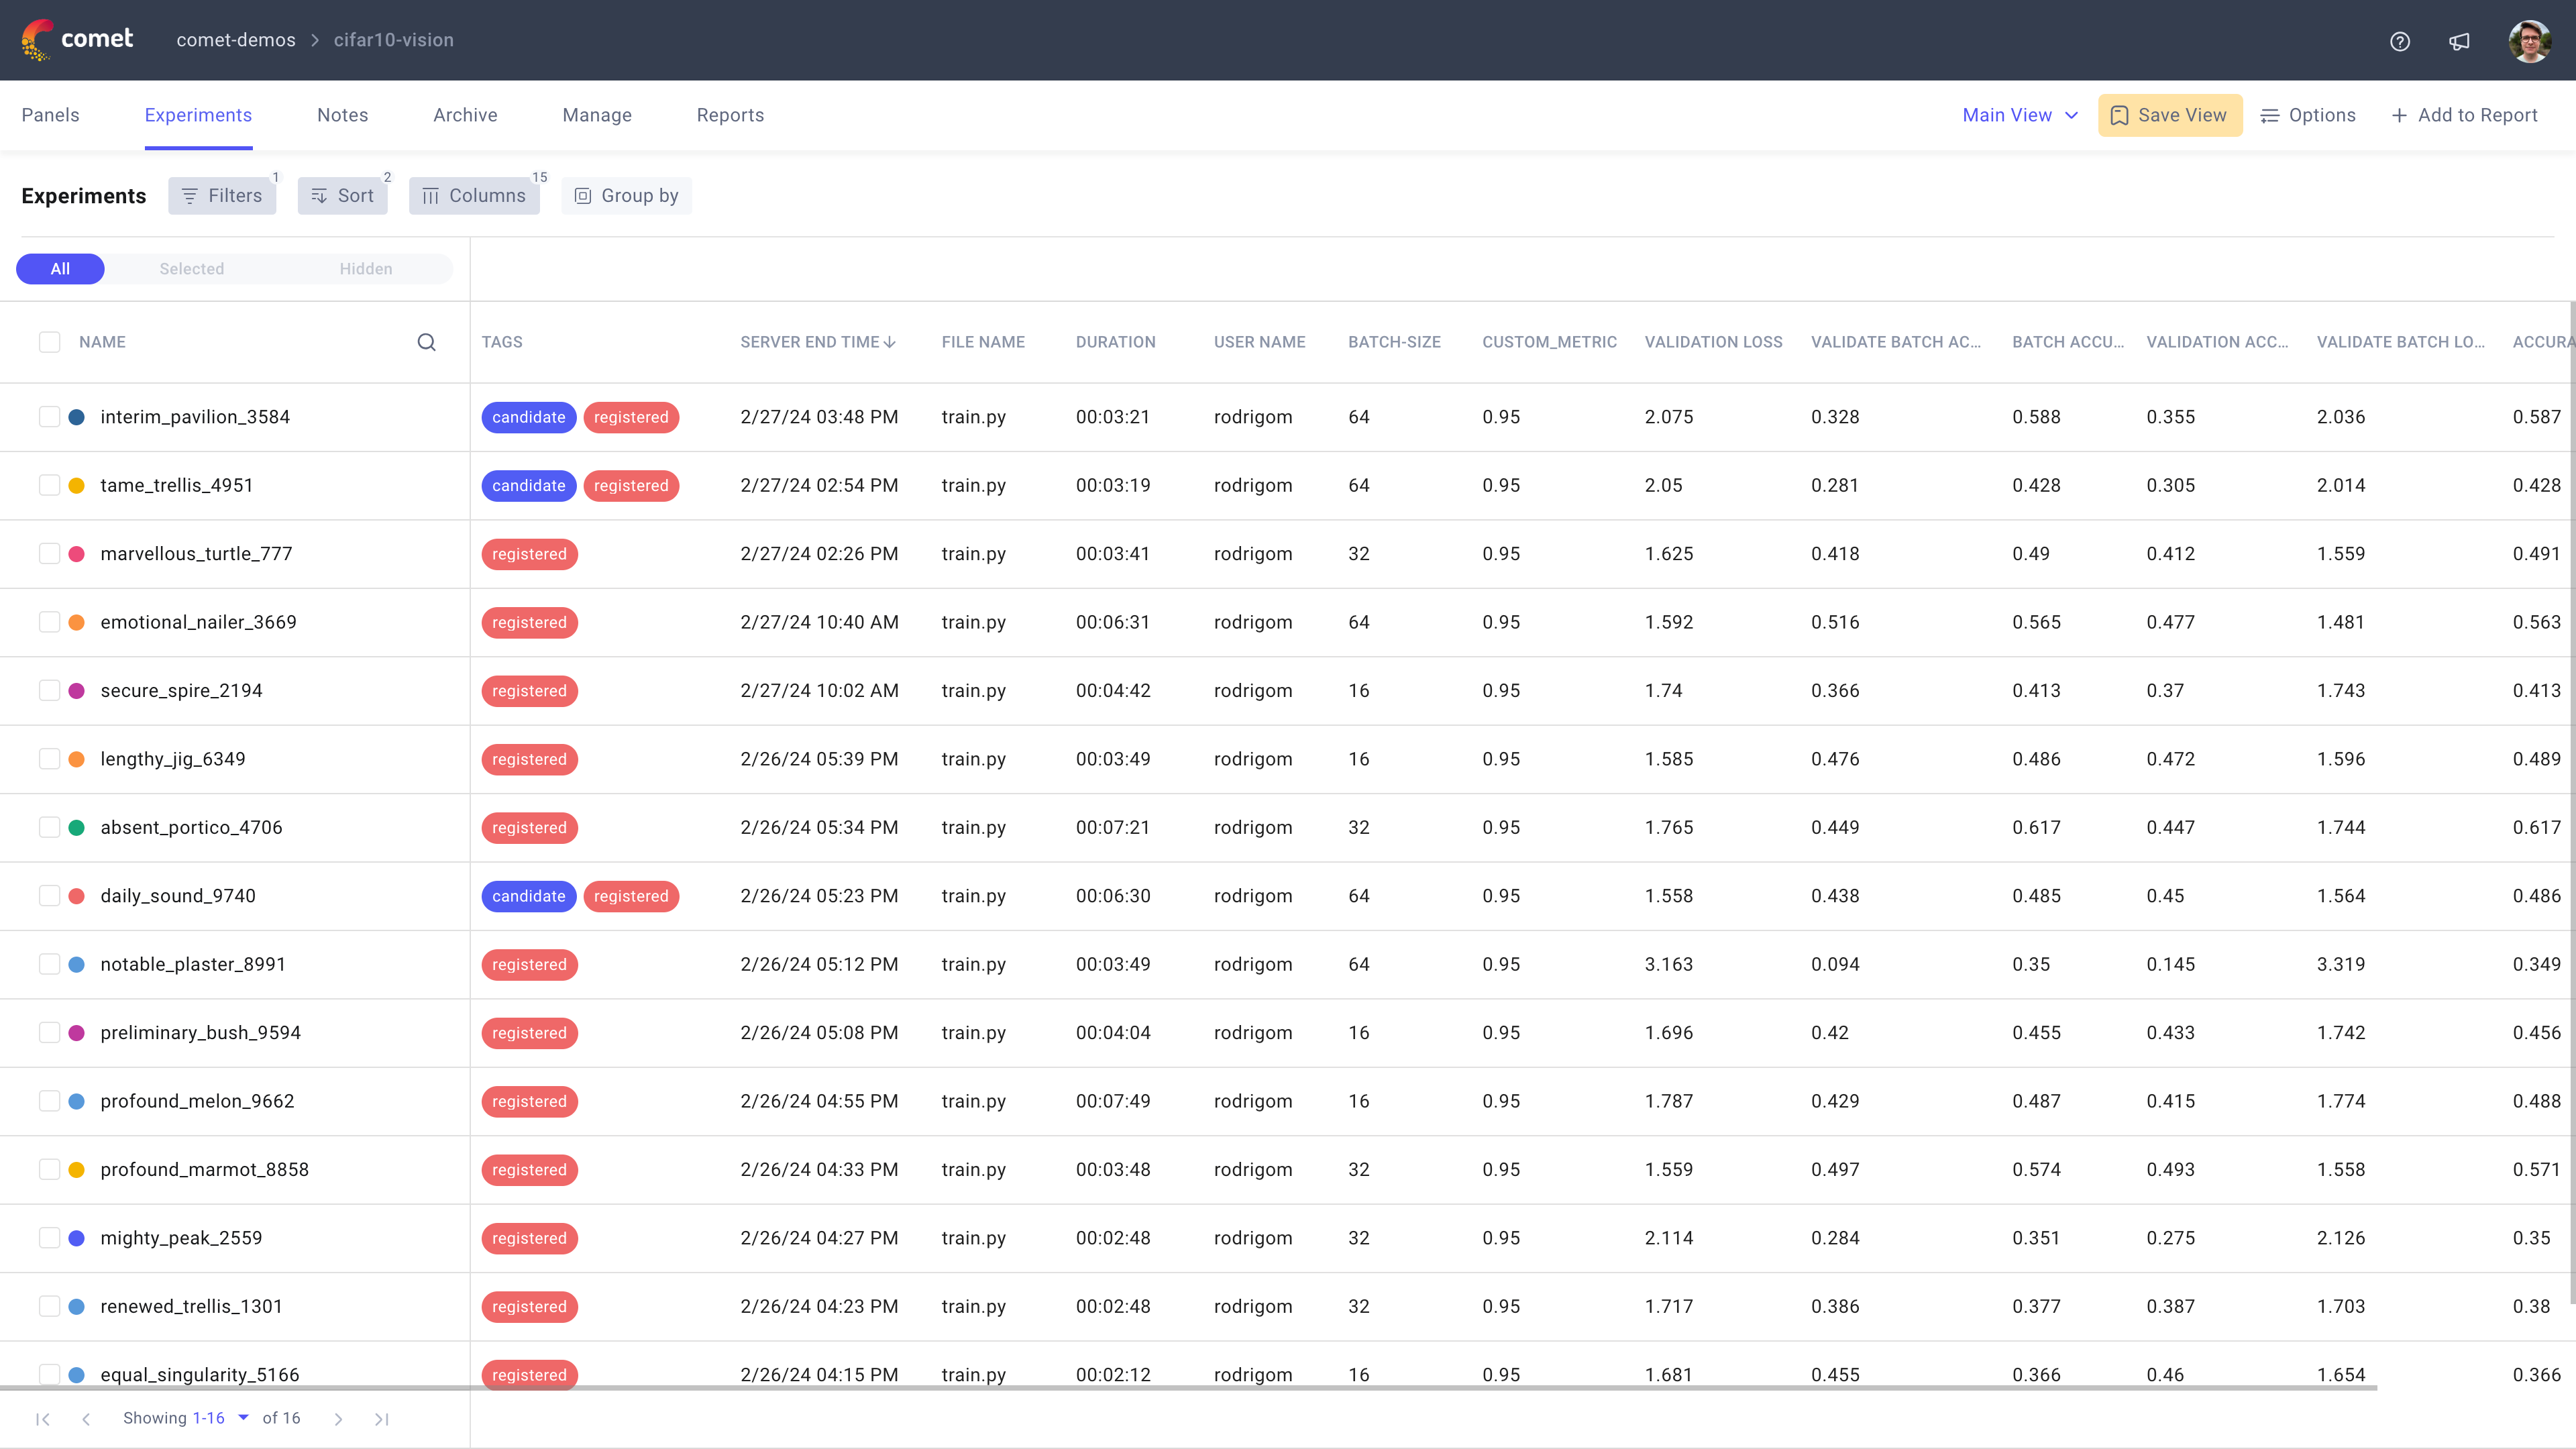
The Experiments page supports detailed analysis of each experiment individually or in comparison to other experiments. Each experiment has its own page which links to all metadata logged for the experiment and also supports a customizable Panels view for an overview of the single experiment performance.
View the Experiment page for one experiment in the demo Comet project
The Panels page provides you with a dashboard that collects a variety of default and user-defined visualizations, where each visualization is called a Panel.
You can refer to the Visualizations section for a complete list and introduction to the supported panels.
Below we introduce functionalities that are shared between the two pages.
Manage displayed experiments
The Panels and Experiments pages share a view of all experiments in the project, respectively as a list and as a table. You can manage the experiments list/table from either page, and updates will be mirrored between the two pages.
You have multiple options to customize the displayed experiments, specifically you can:
- Filter experiments
- Sort experiments
- Customize table columns (only relevant for Experiments page)
- Group experiments
Additionally, the display divides your experiments into three tabbed categories (All, Selected, and Hidden) to aid navigation.
Filter experiments
Filters allow you to select exactly which experiments to keep in display.
To begin with filters:
- Click on the first of the icons to the right of the Experiments title.
- Use the filters sidebar that appears by the right side of the screen to apply and manage filters.
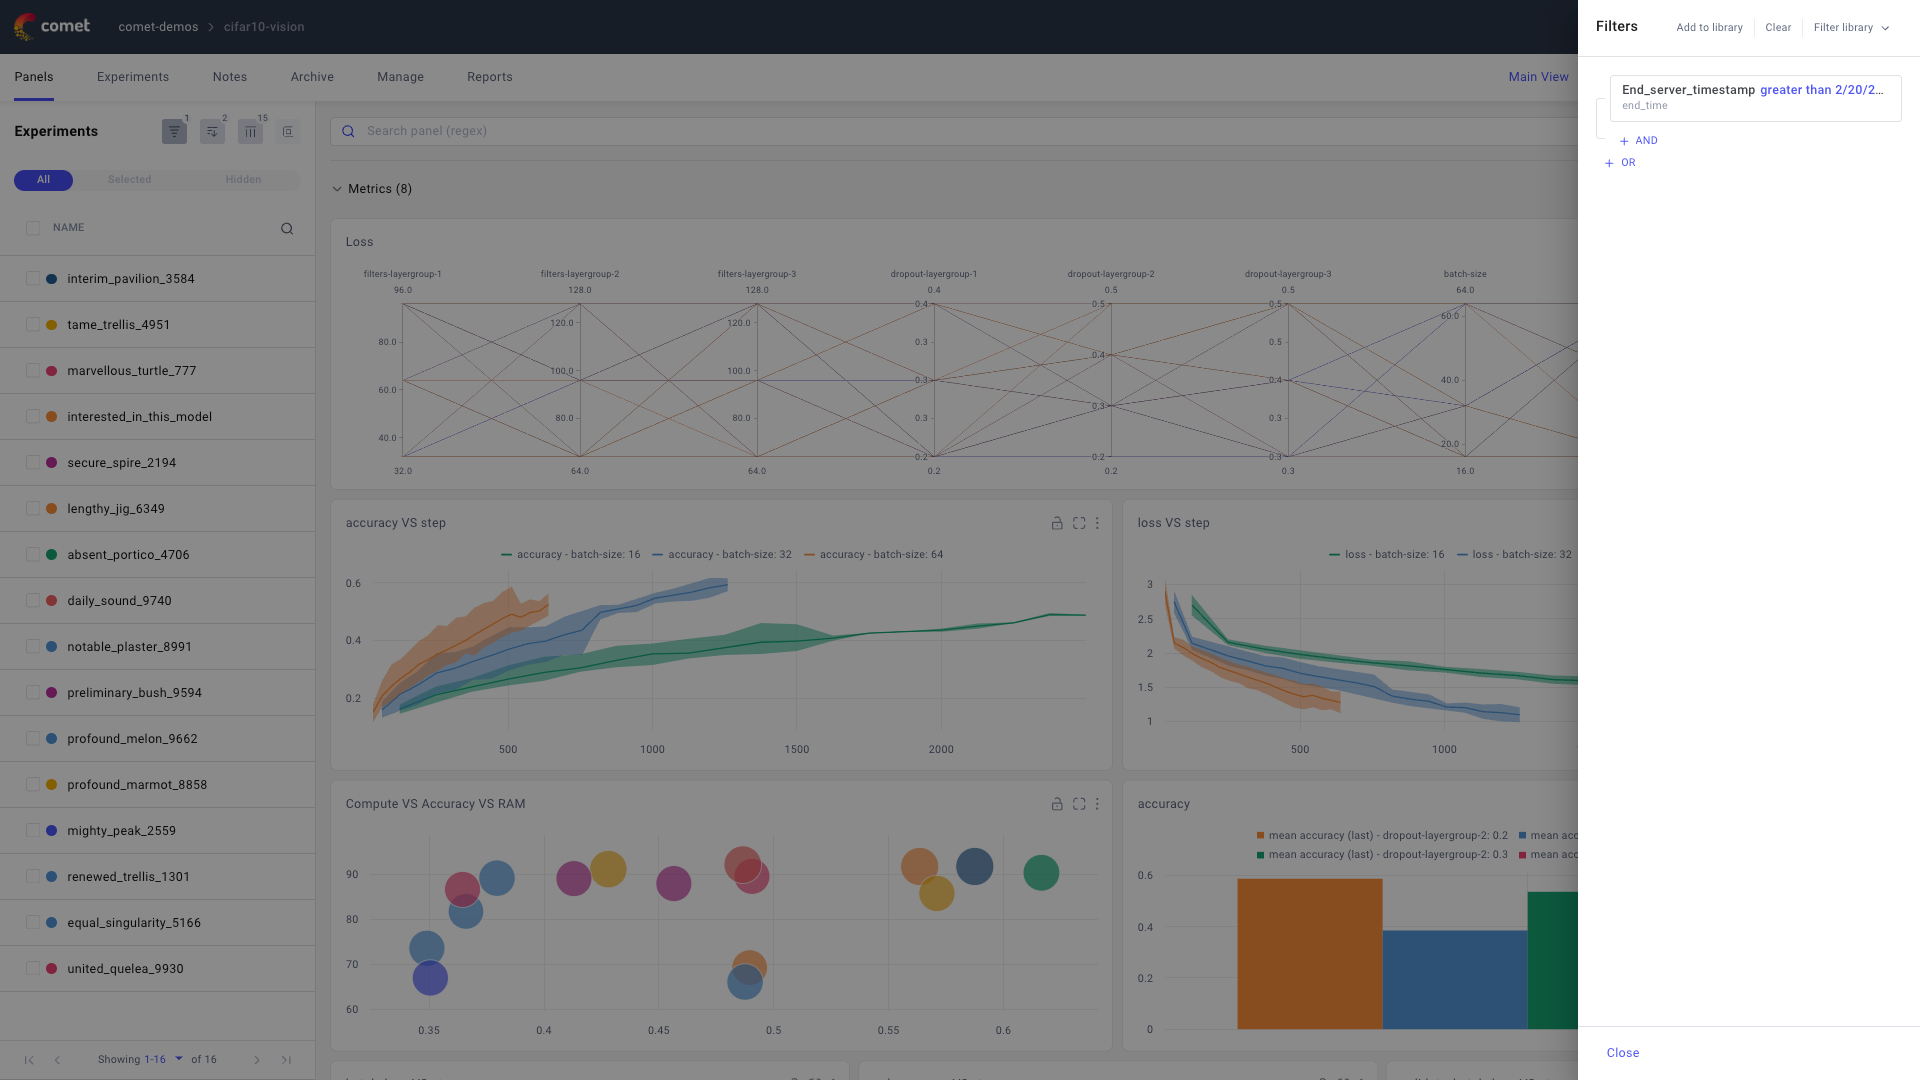
The actions you can perform from the filters sidebar are described below.
Add filters: You can create filters based on any of the attributes logged for the experiment. Each filter is composed of one or multiple conditions that can be combined with both
ANDandORoperators. To add a filter:- Click Add filter.
- Select the experiment attribute you would like to set as the filter condition. Depending on the attribute’s data type, Comet exposes different operators, such as
contains,is null,begins with, boolean values, and more. - (Optional) Create complex filters by combining multiple conditions with the AND and OR operators.
- Filters are then applied automatically when closing the filter sidebar.
Remove filters: To return to a project view with all experiments, click Clear in the filters sidebar.
Save filters to library: You can save any filter to your library for later use. To save a filter:
- Click Add to library from the filters sidebar.
- Enter a filter name in the window that is displayed.
Load filters from library: You can load a filter from the library using:
- Click on Filter library from the filters sidebar.
- Click on the filter of interest.
Remove filters from your library: To remove filters from your library click Filter library, hover on the filters to delete, and click on the bin icon.
Sort experiments
The number of Experiments can grow quickly. Sorting them can help you in better displaying your experiments by placing the most relevant ones at the top of the list/table.
To sort your experiments:
- Click on the second of the icons by the Experiments title.
- From the popup window, select one or more fields to sort with.
The experiments are sorted based on all selected fields, applied from top to bottom, and given the order specified by the arrow (ascending if facing down, descending if facing up).
Customize table columns
The table view of the Experiments page aims to offer you quick insights into the details of multiple experiments.
You can customize the table columns to only display the most relevant experiment attributes, in a desired order:
- Click on the third of the icons to the right of the Experiments title.
Customize the columns:
- Add a new column by using the dropdown to search across experiment attributes and clicking on the desired attribute to add as a column header.
- Delete an existing column by clicking on the X icon by the column name in the list.
- Change the location of an existing column by drag-and-drop.
Note that:
- The Name column is fixed and cannot be updated.
- You can interactively remove entries from the Tags column by clicking on the X icon by the tag to remove. to add a tag to an experiment, you can select the experiments to update and click on Tag.
Group experiments
When grouping experiments, you can quickly visualize which experiments share attributes of interest and use this information to select the most relevant experiments for the dashboard view.
To group your experiments:
- Click on the last icon by the Experiments title.
- From the popup window, select one or more experiment attributes to group by.
The experiments are grouped based on all selected fields, applied from left to right. All experiments without a value for a field are grouped within an "undefined" label.
Note
If you would like to view grouped metrics in the Panels page, you can enable grouping options at a panel level using the Grouping tab.
Perform bulk actions on selected experiments
You can perform bulk actions on a selection of Experiments as follows:
- Select one or more experiments by checking the selection box for the experiment(s).
- Click on the desired action button from the action bar appearing at the bottom of the screen.
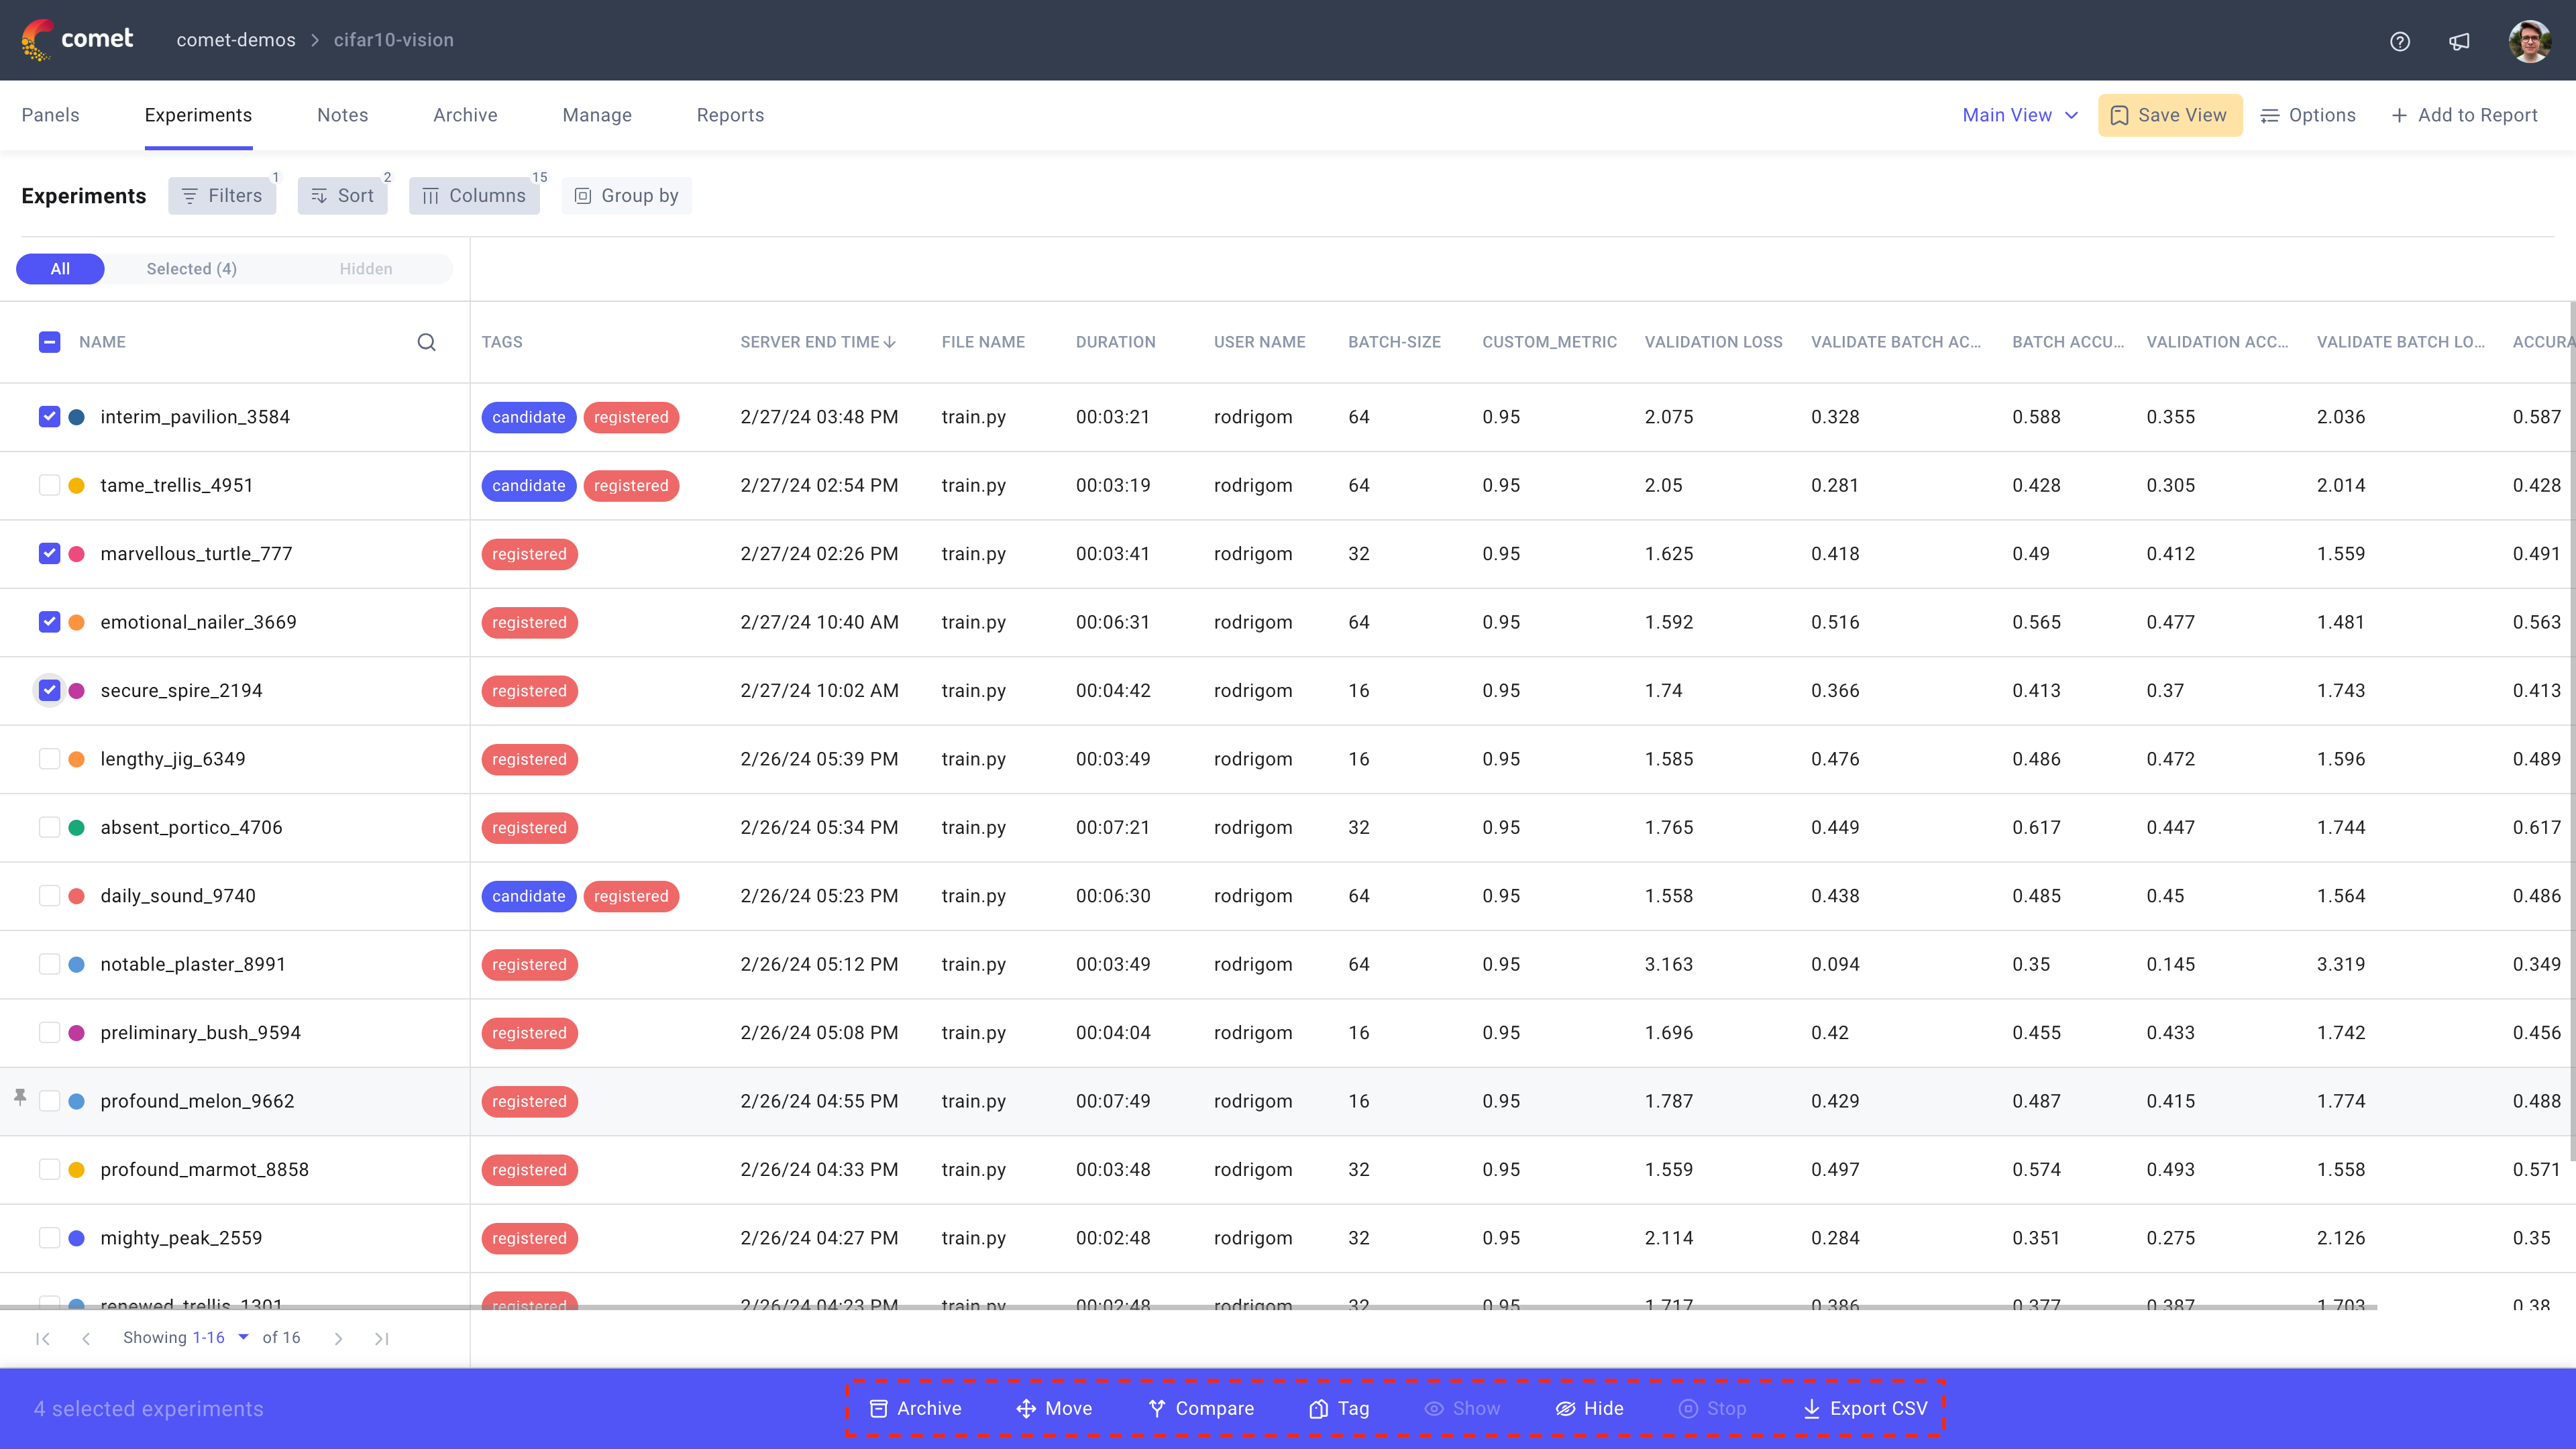
The bulk actions you can perform are described below.
Archive: Archiving an experiments corresponds to soft-deleting the experiment(s). You can navigate to the Project Archive page to either restore or permanently delete your archived experiments.
Move: You can move your experiment(s) to another project in the same workspace or a different workspace, or create a symlink in the specified project.
Diff" Diff allows you to compare up to 4 experiments side by side, you can refer to the Compare experiments page for more details.
Tag: Tags allow you to logically label your experiment(s). You can select any existing tag in the project, or create a new tab by entering the text and pressing Enter.
Show and Hide: You can adjust your experiment’s visibility in the experiments list by showing or hiding an experiment. When an experiment is hidden, it will not be displayed in the metric panels.
Stop You can stop one or more experiments that are running on your computer, cluster, or on a remote system, while they are reporting to Comet. The running experiments receive the message and raise an
InterruptedExperimentexception, within a few seconds (usually less than 10).Handling
Stopping the experiment from UI is the same as letting the script end as usual---just as if you had pressed Ctrl+C. However, if you would like to handle the interrupted script, you can do that as well. Here is an example showing a running experiment and how the exception is caught. You can perform custom code in the except clause, if you wish.
import comet_ml

exp = comet_ml.start()

try:
    model.fit()
except comet_ml.exceptions.InterruptedExperiment as exc:
    # handle exception here
    exp.log_other("status", str(exc))
    # other cleanup

model.save()
exp.log_asset("my_model.hp5")
Export CSV: You can export the data for the selected experiment(s) to a local CSV.
The Notes page
The Notes page allows you to add any custom information to your ML project via Markdown.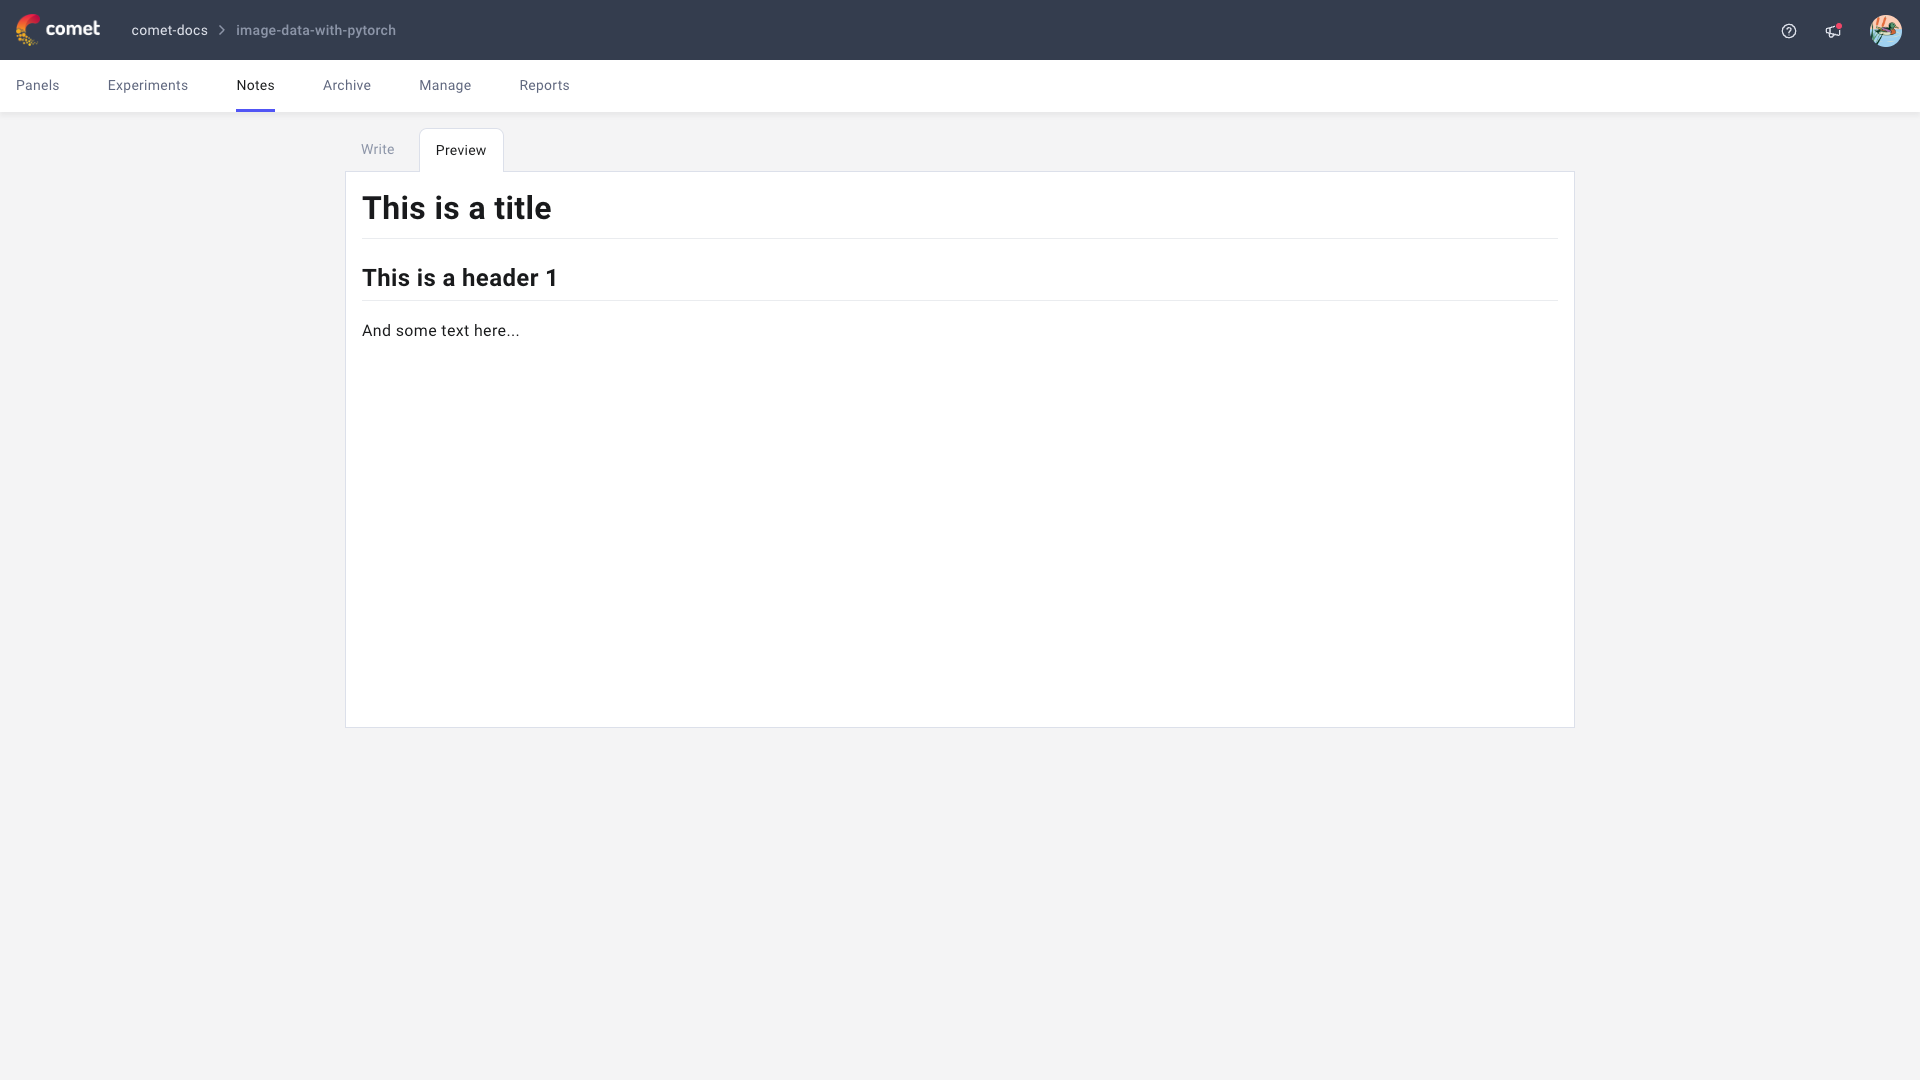
The Notes page is composed of two components:
- Preview displays your notes in a user-friendly way, following the Markdown formatting.
- Markdown provides you with a built-in editor for your notes.
Use this to collect relevant information, instructions, and details that apply to the project at a high-level.
The Archive page
The Archive page provides you with a table view of archived experiments.
The tabke has the same headers as the table in the Experiments page.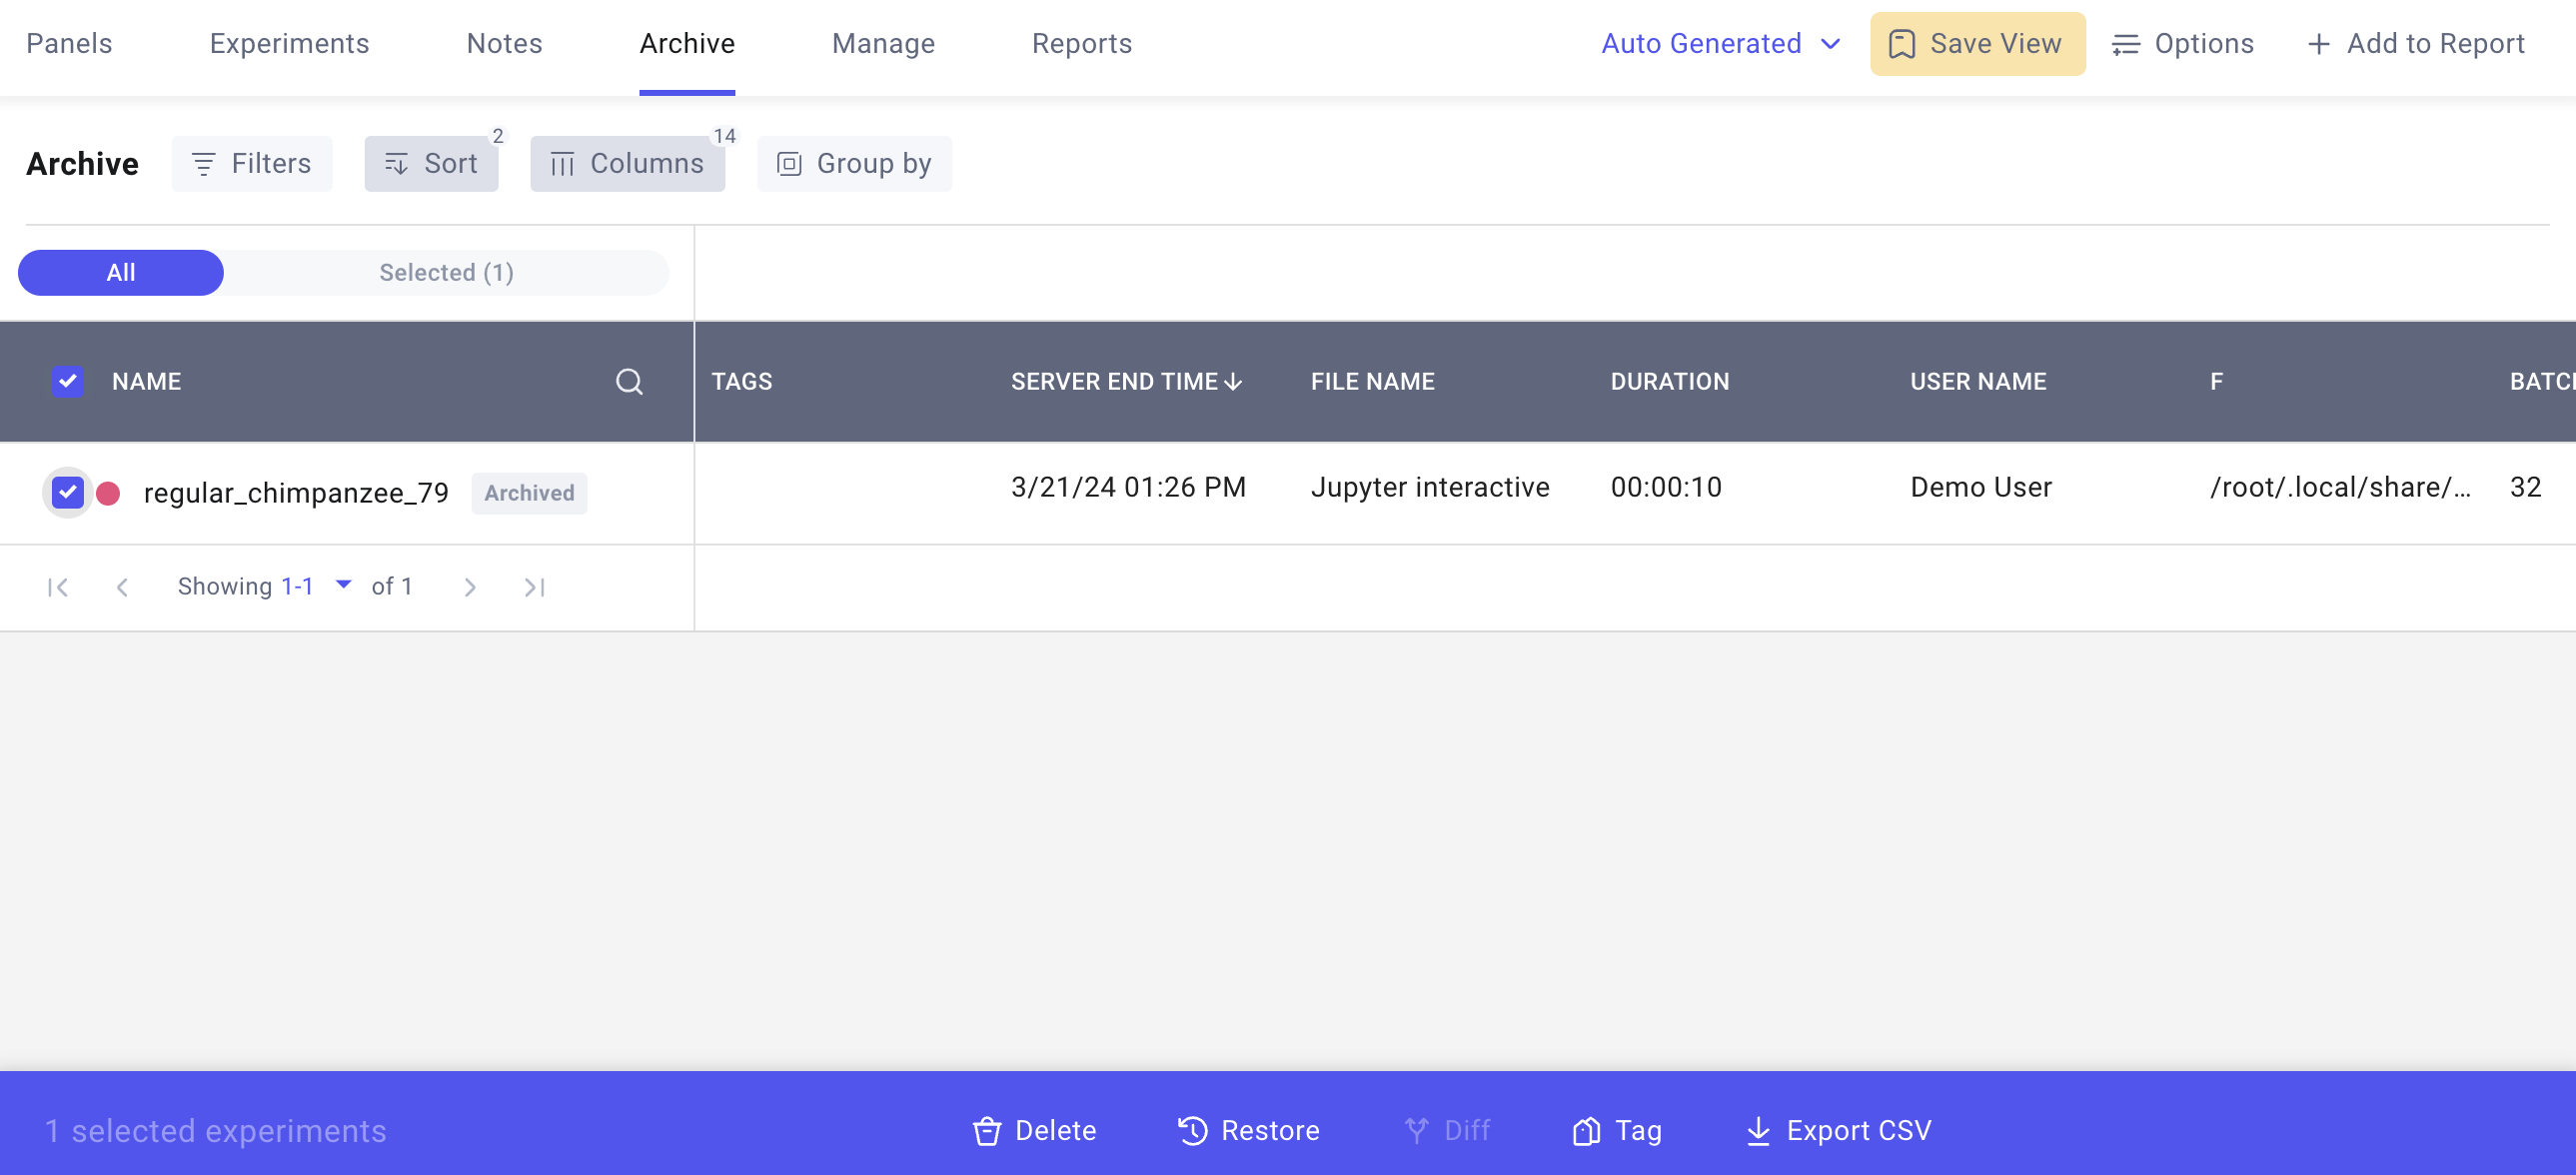
The Archive page supports the following actions on selected archived experiments:
- Delete the experiment, please note that this action is irreversible.
- Restore the experiment.
- (If more than one experiment has been selected) Get the Diff between the selected experiments.
- Tag the experiment with any project tag.
- Export a CSV for the selected experiments in the table.
Note
You can archive an experiment from the Panels or Experiments page by selecting the experiment of interest, and clicking on Archive in the horizontal menu that appears when selecting an experiment at the bottom of the page.
The Manage page
The Manage page allows you to update the project configuration from one place.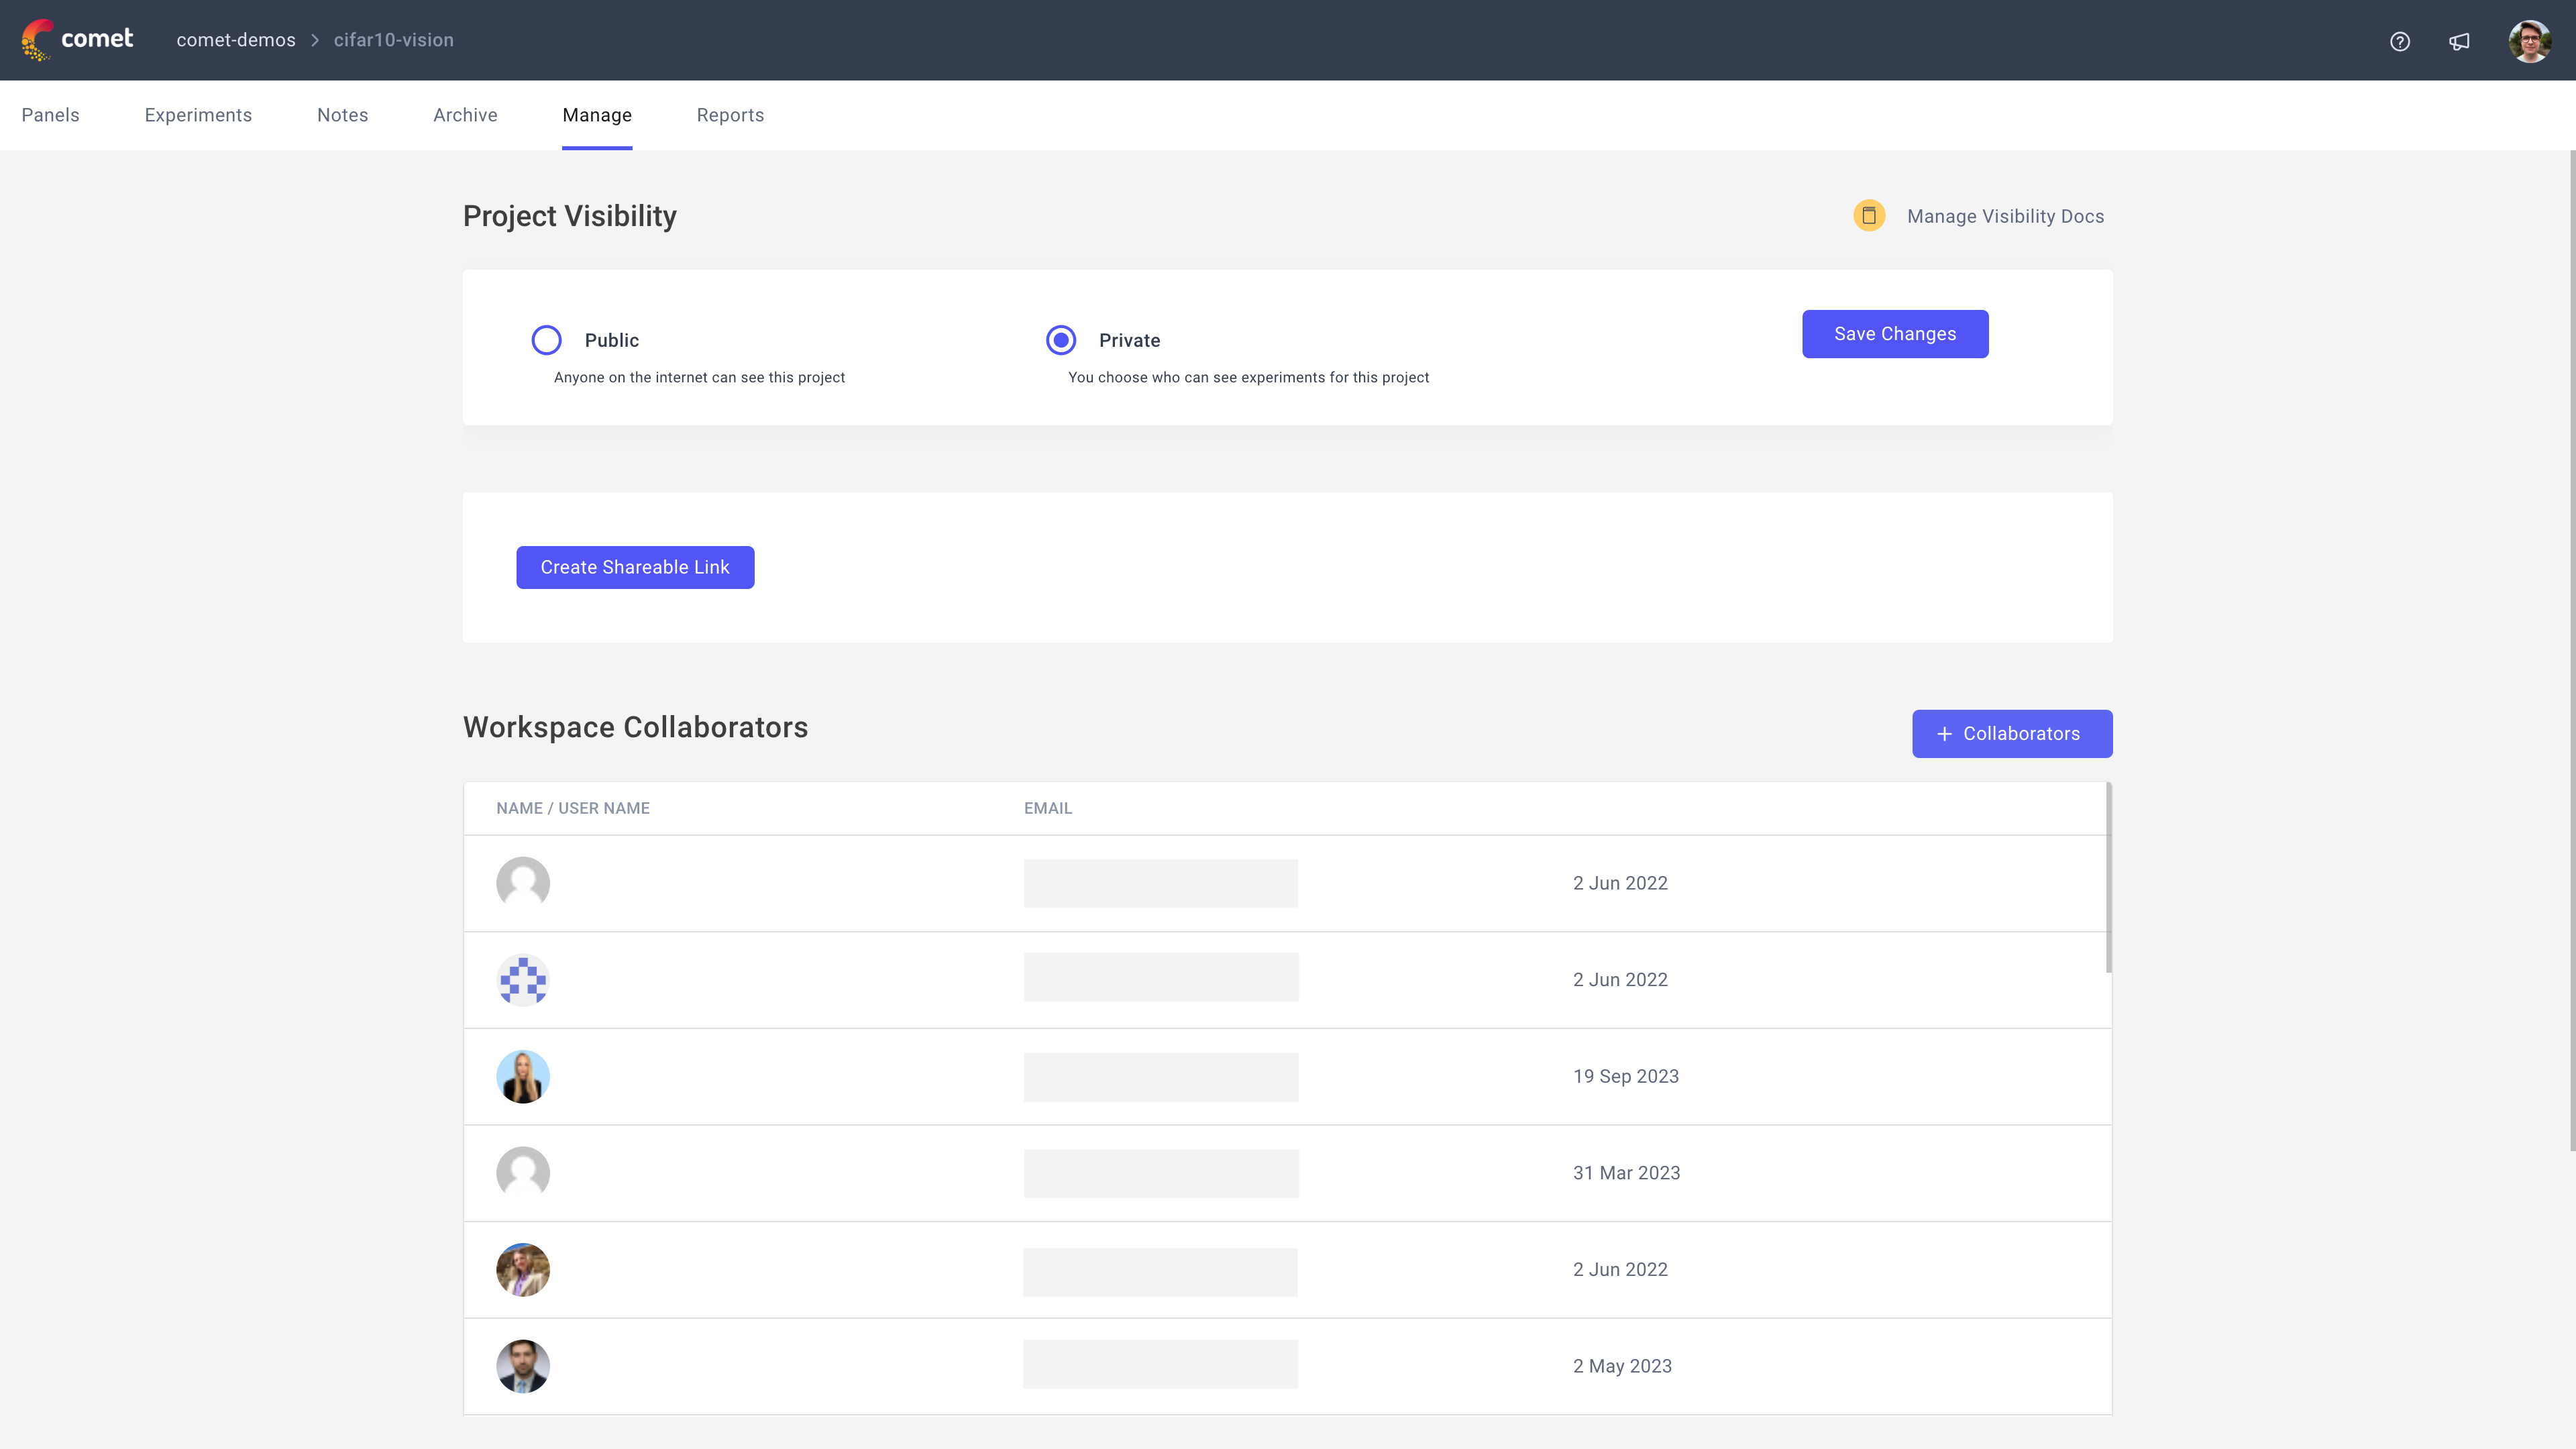
From this page, you can:
- Update the project visibility by selecting either Public or Private.
- (If enabled) Create a shareable link.
- Add collaborators to your workspace.
The Reports page
The Reports page allows you to create and manage interactive reports for your ML project which make it easy to share results with your team.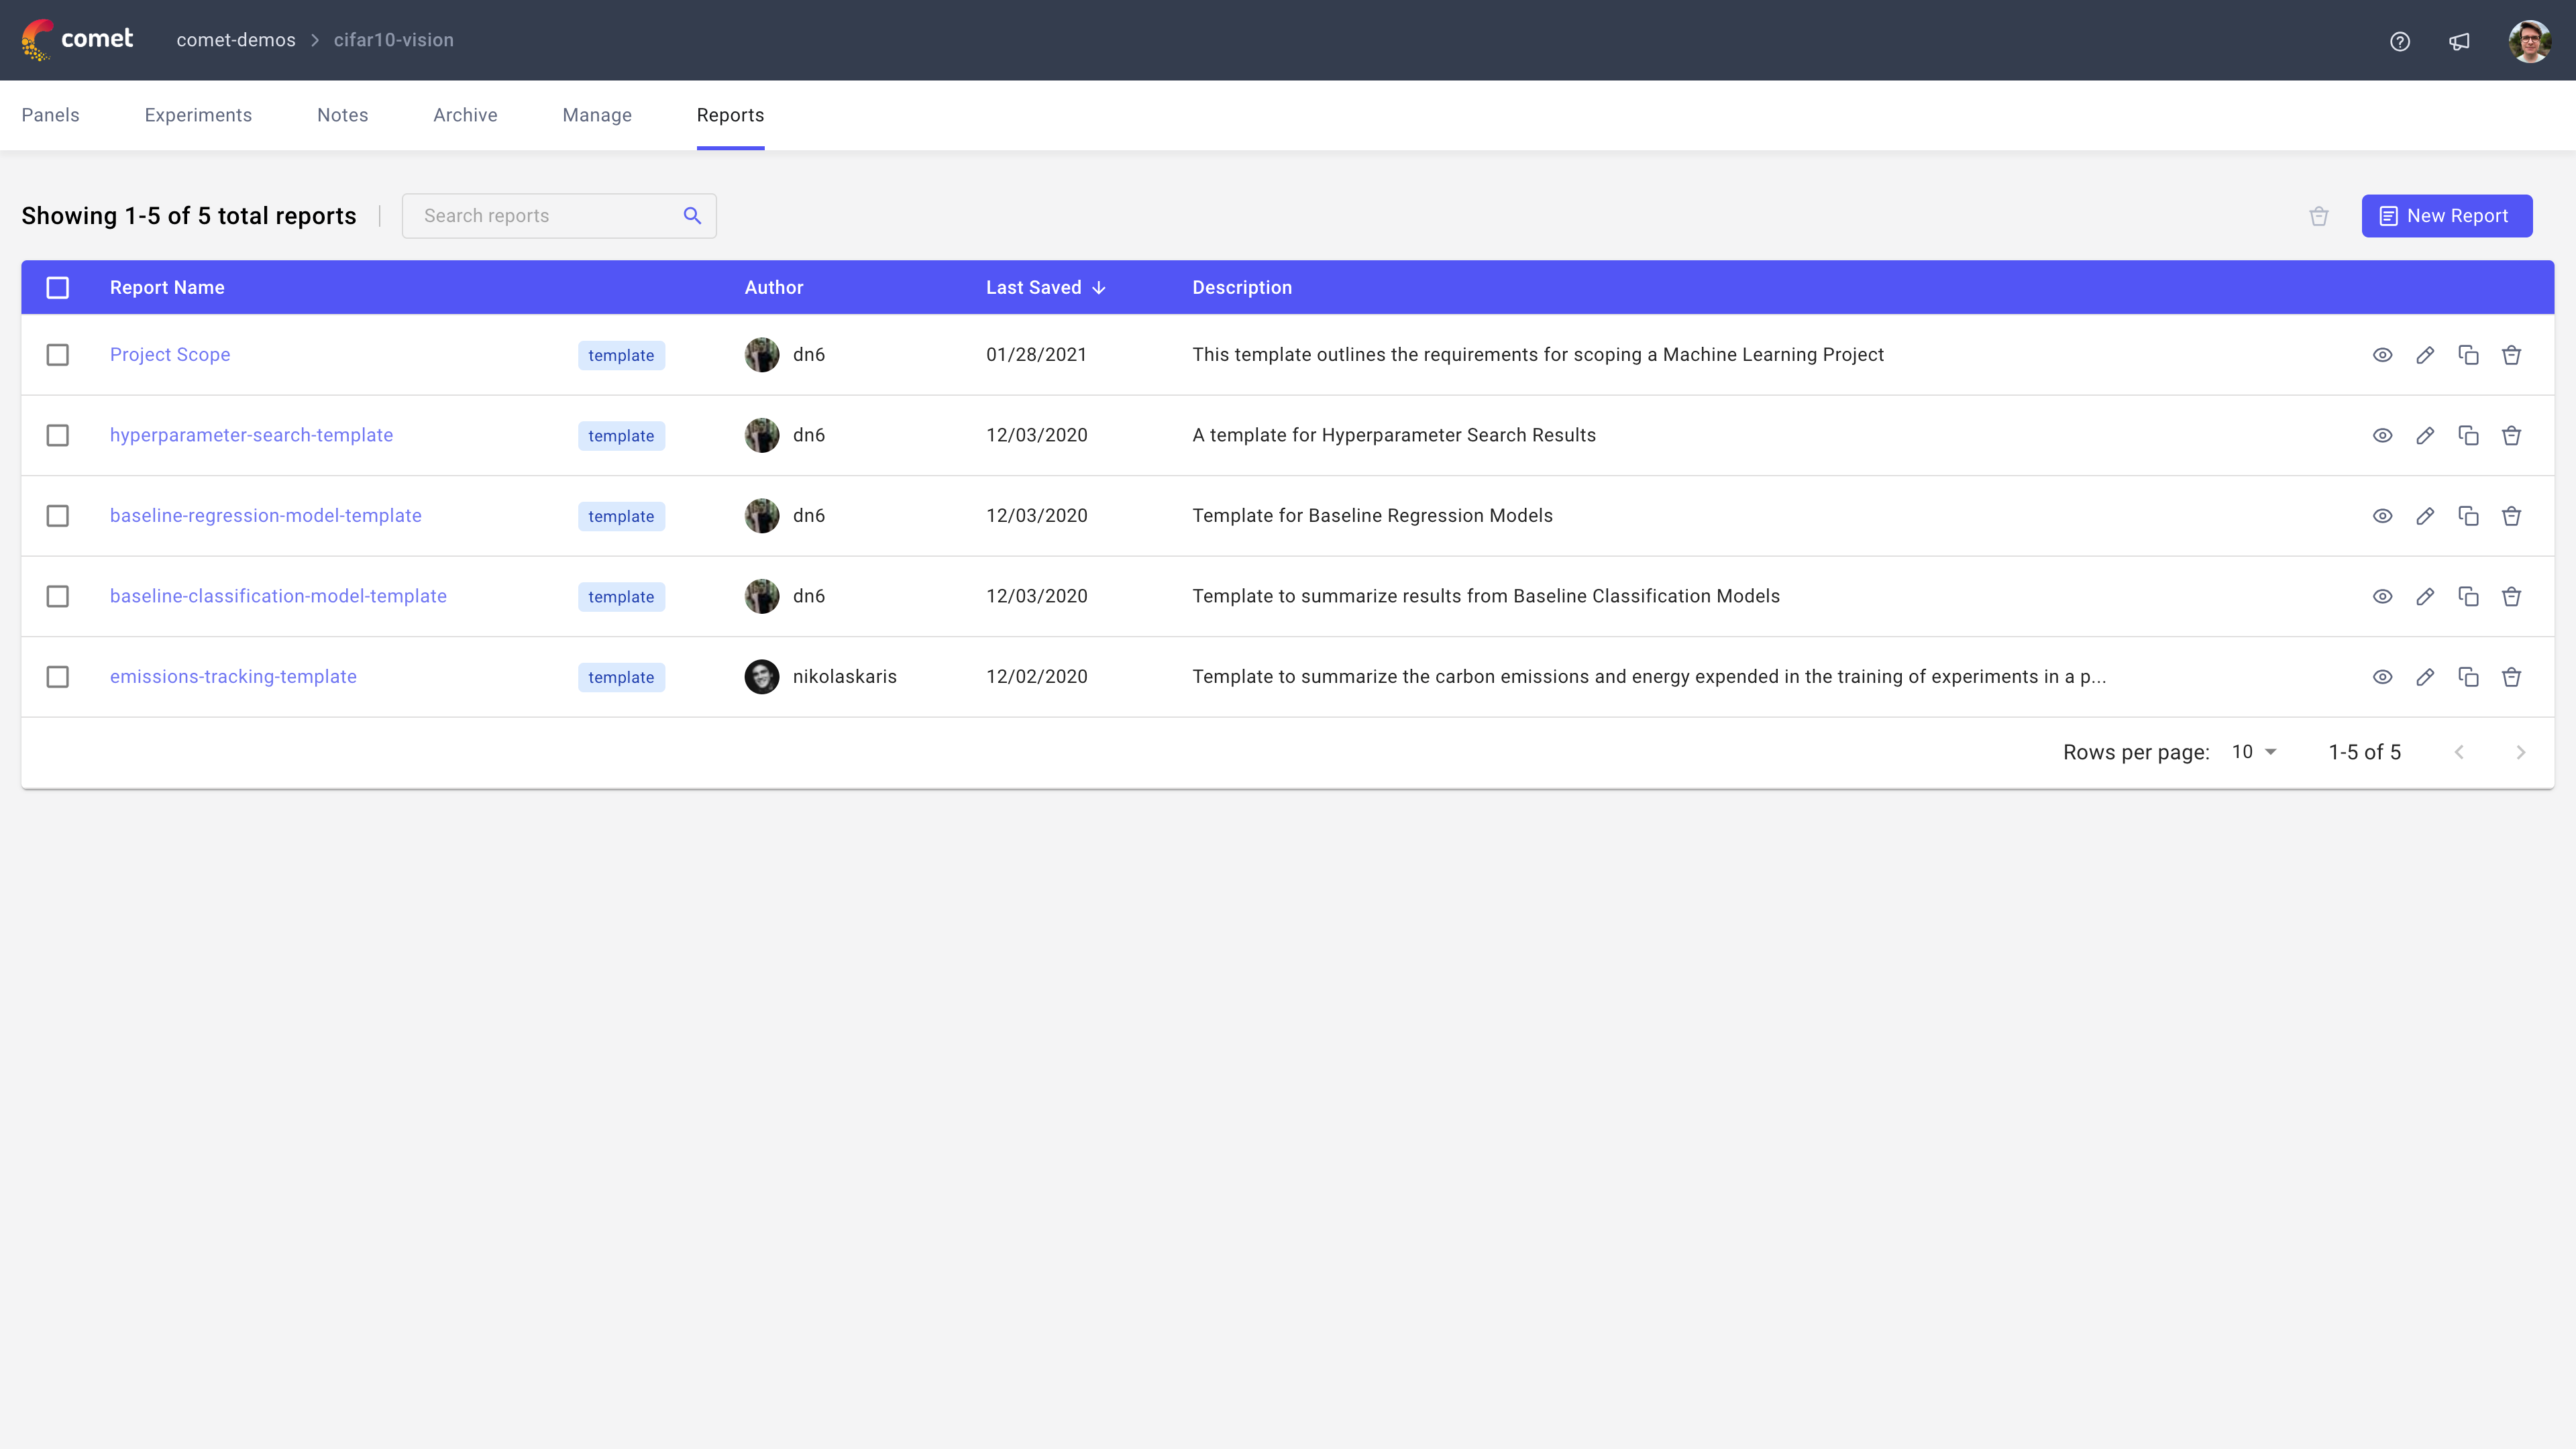
You can create a new report by clicking the New Report button in the top right corner of the page. This will open an interactive editor that allows you to create custom sections by combining free-form text, panels, and experiments.
You can also preview, edit, duplicate, or delete any existing report by selecting it from the table view.
Learn more
- Start managing your ML experiments with Comet Experiment Management
- Explore the Comet Panel Gallery: A marketplace of visualizations, reports, and utilities for many of your ML needs.
- Create custom visualizations via Python panels.