Python Panels - BETA
Welcome to the Comet Python Panel Beta!
Comet Python Code Panels allow you to write custom visualizations the same way that you write all of your other scripts and using the Python modules that you know and love.
When writing a Python Panel, you can use all of the standard data
science Python modules, including: astropy, autograd, biopython,
bokeh, comet_ml, matplotlib, nltk, numpy, pandas, pillow,
scikit-image, scikit-learn, and scipy.
If you would like to jump to the examples, they are here:
Steps to creating a Custom Python Panel
-
Go to a Project or Experiment View.
-
Click on "Add Panel" (either in the panel area on the Project View, or on the Panel Tab of the Experiment View).
-
Click on
+ Create New -
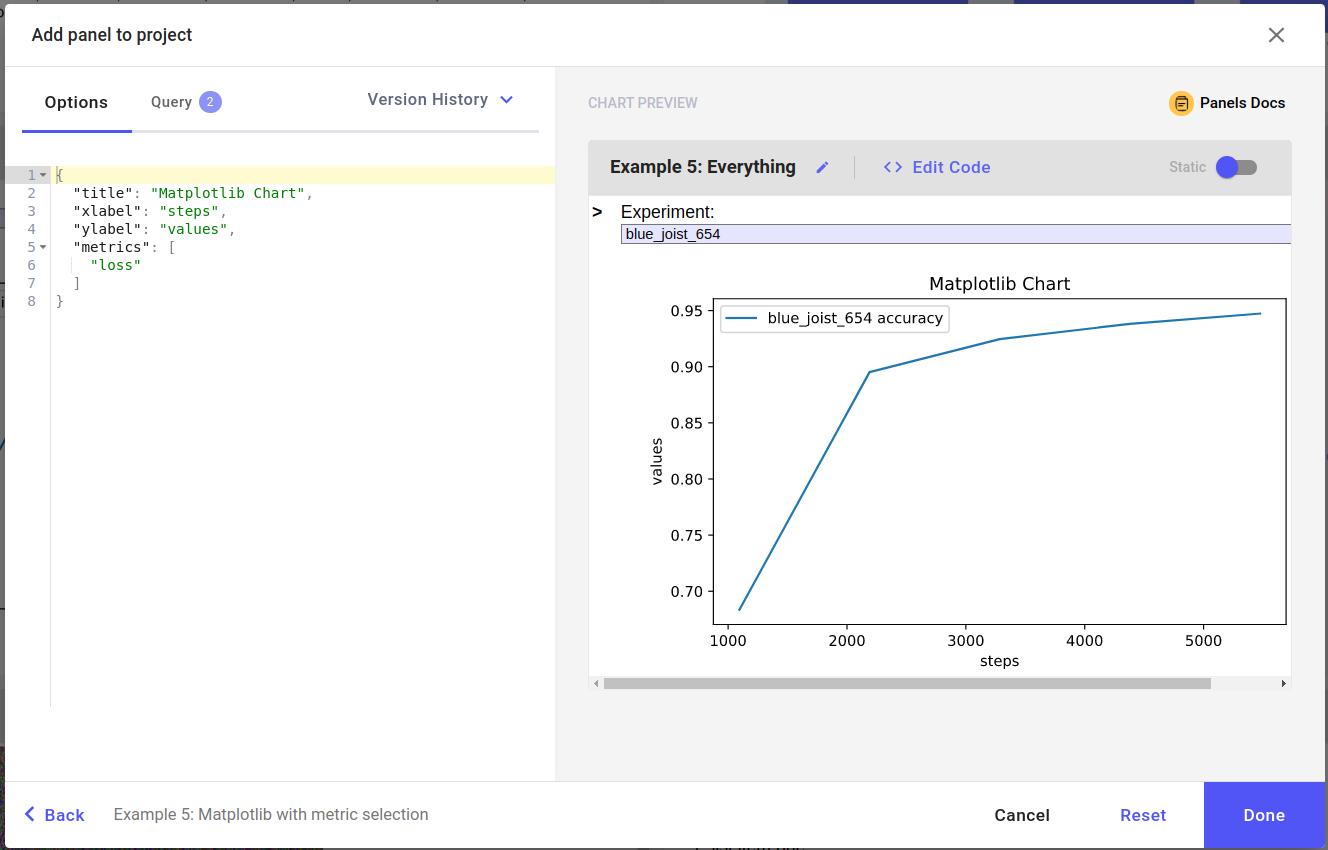
That should display the following screen:
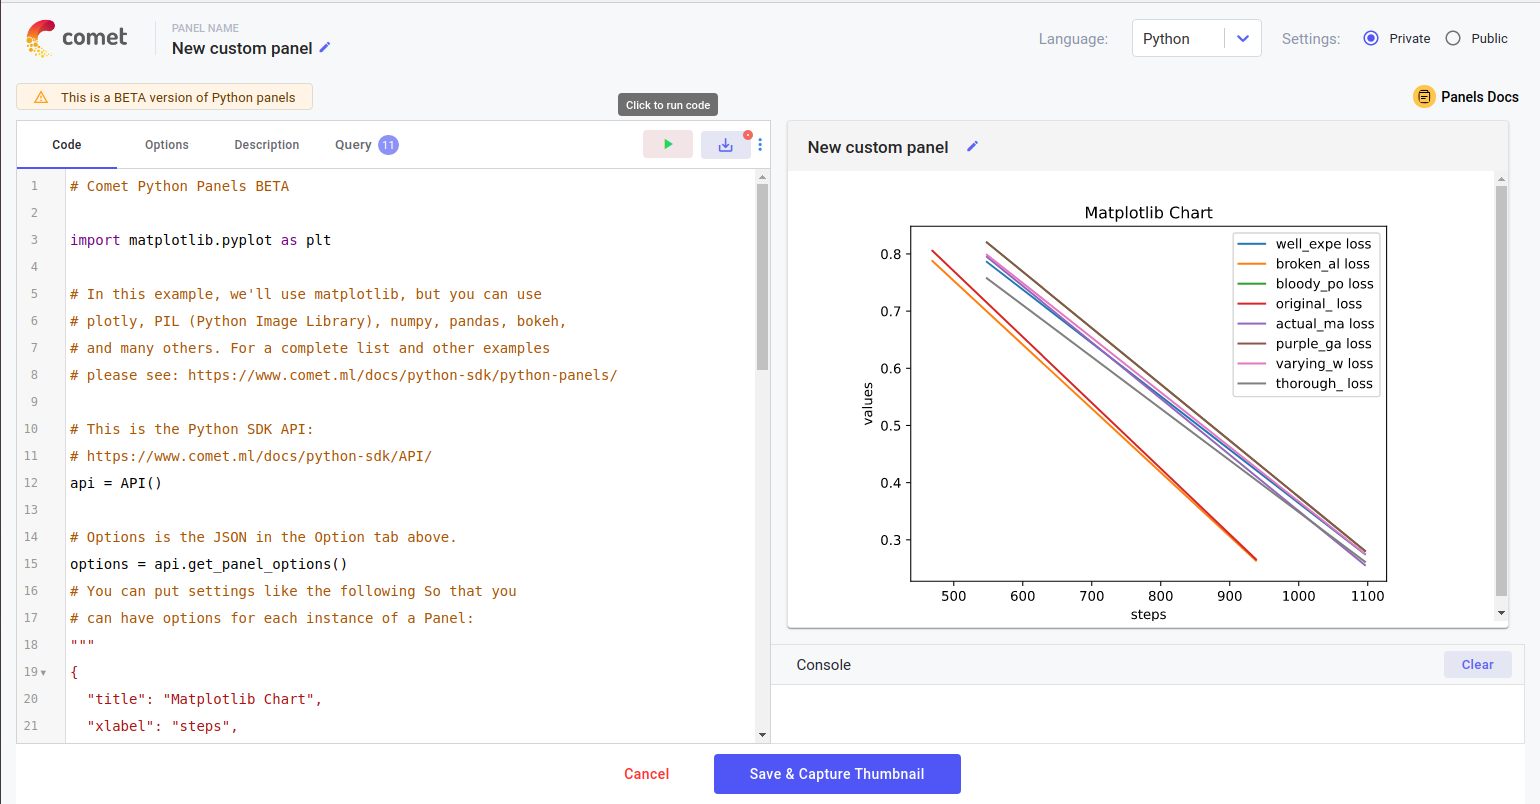
The left-hand portion of the Panel editor contains tabs for:

Code tab
Here you enter on the Python code for this panel. Every saved change creates a new version that you can always revert to at any time.
Keyboard short cuts:
| PC short cut | Mac short cut | Functionality |
|---|---|---|
Ctrl-S |
Cmd-S |
Save |
Ctrl-[ |
Cmd-[ |
Indent |
Ctrl-] |
Cmd-] |
Unindent |
Ctrl-F |
Cmd-F |
Start searching |
Ctrl-G |
Cmd-G |
Find next |
Shift-Ctrl-G |
Shift-Cmd-G |
Find previous |
Shift-Ctrl-F |
Cmd-Option-F |
Replace |
Shift-Ctrl-R |
Shift-Cmd-Option-F |
Replace all |
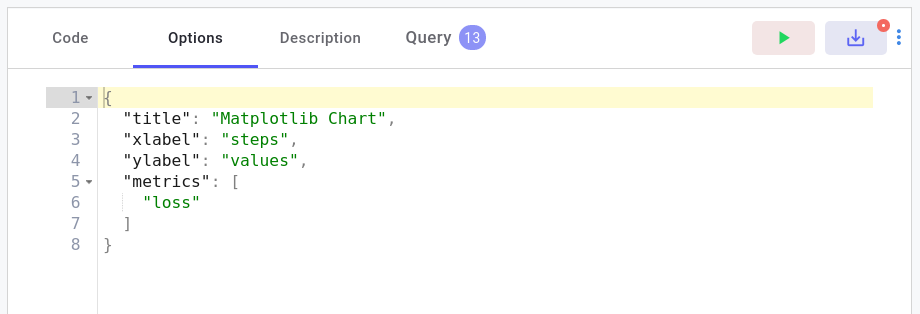
Options tab
These are options that you can set for each instance of a Panel. They are useful for having items that can be varied without having to edit the code. For example, you could have an option for a title of a chart.
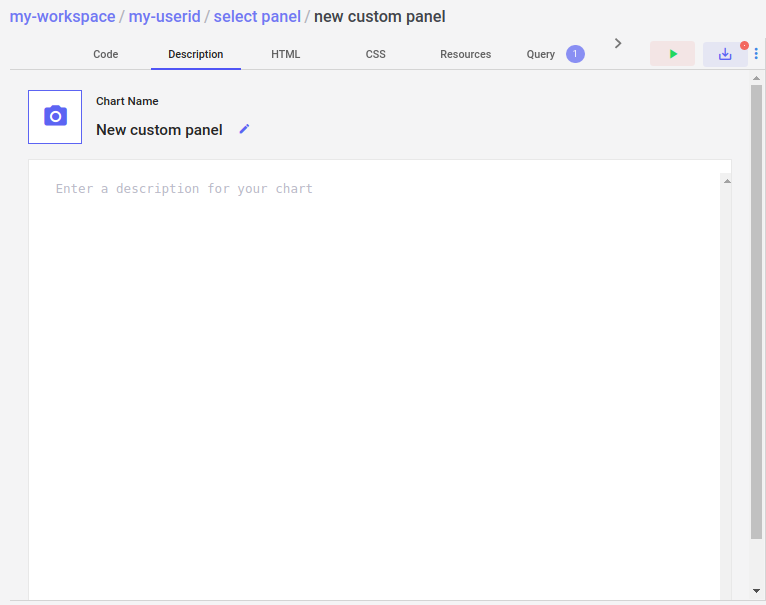
Description tab
A description of the Panel and thumbnail of the Panel. Click the image to create or edit the thumbnail. We suggest putting author, and details about how the Panel works in the description. This is searchable text on the Panel Gallery.
Query tab
You can provide a default query for your Panel. For example, perhaps your Panel only works for experiments with a particular hyperparameter value. You can define the query here. Of course, many Panels will work without setting a specific filter.
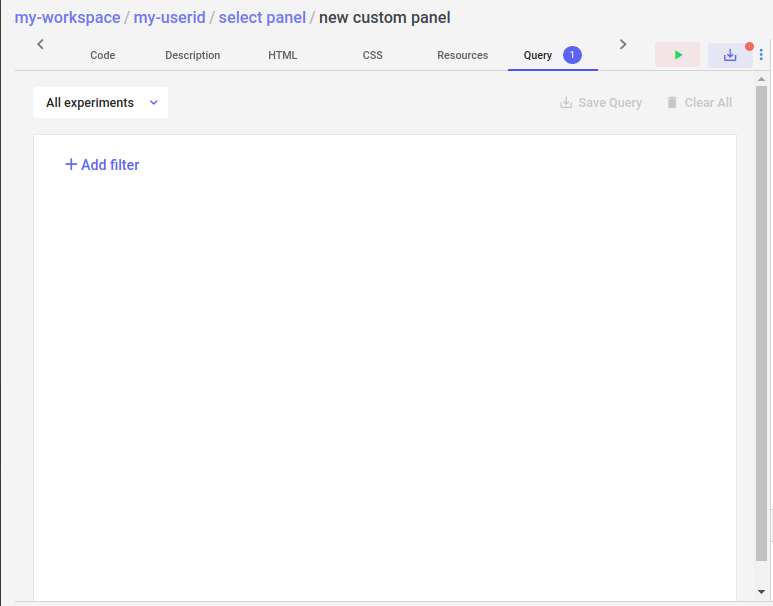
You can override this when you add an instance of the Panel to a Project View.
A Simple Python Panel
Enter the following code in the Code tab:
```python from comet_ml import ui
ui.display("My first Python Panel!") ```
Click on the Run button to display the output in the Panel Preview
area on the right-hand side.
To display items on the Panel canvas, you need to import the
comet_ml.ui library, and call ui.display(). See ui for
addition details on comet_ml.ui.display().
Info
Python Panels do not automatically update with new experiments nor upon receiving new logged metrics. This is by design, as your Python Panel may be expensive to compute, and you may not wish to have it automatically refresh whenever new data is received.
The following sections provides details on accessing Comet-logged data
via the API, details on the User Interface ui and end-to-end
sample panels.
API
To use comet_ml.API, first import it and make an instance of it:
```python from comet_ml import API
api = API() ```
Then you will have access to the following methods. You can find additional documentation on the full Comet Python Panels API SDK.
API Panel Methods
These methods provide functionality related to the current panel.
API.get_panel_options()
Get the JSON Options data as a Python dictionary.
Example:
```python from comet_ml import API
api = API() options = api.get_panel_options() ```
The Panel Options can be edited when in the Options tab of the Panel Code editor, and set when you are adding a Panel instance to a View.
API.get_panel_experiment_keys()
Get the experiment keys selected for this Panel.
Example:
```python from comet_ml import API
api = API() experiment_keys = api.get_panel_experiment_keys() ```
This will return a list containing all of the current experiment keys. Specifically:
- If on a Project View, the experiment keys from the visible experiment table page
- If a filter is set, all of the matching experiments
- If a Query is set for this Panel, the matching experiments
API.get_panel_experiments()
Get the APIExperiments selected for this Panel.
Example:
```python from comet_ml import API
api = API() experiment = api.get_panel_experiments() ```
Like the API.get_experiment_keys()
method, but returns a list of APIExperiments rather than just their
keys.
You can find additional documentation at Python Panels APIExperiment.
API.get_panel_project_id()
Get the project_id for this Panel.
Example:
```python from comet_ml import API
api = API() project_id = api.get_panel_project_id() ```
The project_id can be useful to retrieve other Project-level information.
API.get_panel_project_name()
Get the project_name for this Panel.
Example:
```python from comet_ml import API
api = API() project_name = api.get_panel_project_name() ```
The Project name could be useful in creating report-like Panels.
API.get_panel_workspace()
Get the workspace (name) for this Panel.
Example:
```python from comet_ml import API
api = API() workspace = api.get_panel_workspace() ```
The Workspace name could be useful in creating report-like Panels.
API.get_panel_metrics_names()
Get the names of all metrics logged for all experiments in this Project.
Example:
```python from comet_ml import API, ui
api = API() metrics_names = api.get_panel_metrics_names() metric_name = ui.dropdown("Select a metric name:", metrics_names) ```
As shown, the metrics_names could be useful in creating a dropdown selection for plotting.
Info
Note that this list includes all metrics, and system metrics. If you wish, you could use only those names starting (or not starting) with "sys".
ui
To use comet_ml.ui, you need only import it:
```python from comet_ml import ui
ui.display("Hello") ```
ui contains the following methods:
ui Display methods
- ui.display()
- ui.display_figure()
- ui.display_image()
- ui.display_text()
- ui.display_markdown()
These methods are described below.
ui.display()
The ui.display() method is used to visualize different kinds of
Python objects on the Panel canvas area.
Signature:
python
ui.display(*items, format=None, **kwargs)
You can use ui.display() on one (or more) of any of the following
types of Python items:
PillowPython Images Library (PIL) images- HTML strings (including SVG images)
- Matplotlib figures
- Plotly plots
- Pandas' Dataframes
- Any object that has a
_repr_*_method
In addition, there are specialized display methods for text, markdown, and images represented as raw strings (as logged as image assets, for example). We'll describe each of those methods below.
If you wish to send multiple items to the display area, pass them to
ui.display() or call ui.display() repeatedly:
```python from comet_ml import ui
ui.display("hello") ui.display("world")
or
ui.display("hello", "world") ```
The format argument can be either "text", "markdown", "html" or
None. The default is "html"/None.
kwargs are optional, and varying depending on the type of item being
displayed. For example, if the item is a pandas Dataframe, then you
may also pass in these keyword arguments:
- theme: the name of a color theme (see below)
- font_size: name of the size, eg 'normal'
- font_family: name of the font family
- text_align: which side to align to
- width: the width of table, eg, 'auto'
- index: the index to highlight
- even_color: color of even rows
- even_bg_color: background color of even rows
Theme names: 'yellow light', 'grey light', 'blue light', 'orange light', 'green light', 'red light', 'yellow dark', 'grey dark', 'blue dark', 'orange dark', 'green dark', 'red dark', or 'comet'.
For more details on ui.display(), see the Python Panel Examples.
ui.display_figure()
This method is used to display a matplotlib figure.
python
ui.display_figure(plt)
ui.display_figure(figure)
Displays a matplotlib figure.
Examples:
```python from comet_ml import ui import matplotlib.pyplot as plt
plt commands here
ui.display(plt) ```
Or calling with the figure:
```python from comet_ml import ui import matplotlib.pyplot as plt
fig, ax = plt.subplots()
Figure commands here
ui.display(fig) ```
ui.display_image()
This method is used to display an image, either from a logged asset, or from a PIL Image.
Example from logged asset:
```python from comet_ml import API, ui
api = API()
for experiment in api.get_panel_experiments(): for json in experiment.get_asset_list("image"): if json["fileName"].endswith("jpg"): data = experiment.get_asset(json["assetId"]) ui.display_image(data, format="jpg") ```
Displays image strings in the given format ("jpg", "gif", or "png").
Example from PIL Image:
```python from comet_ml import ui from PIL import Image import random
Create a PIL Image
image = Image.new("RGB", (500, 500))
process image here
ui.display(image) ```
For more details, see the Python Panel Examples.
ui.display_text()
This method is useful for displaying plain text.
python
ui.display_text(text)
Displays text that otherwise would have characters interpreted as HTML.
ui.display_markdown()
This method is useful for displaying text formatted as markdown.
python
ui.display_markdown(*text)
Displays text as markdown, ignoring any indentation.
ui Widget methods
This section describes so-called widgets. These are elements that
have a GUI representation, and trigger a change to re-run your
code. This is best shown through an example.
ui.dropdown()
The ui.dropdown() element does two things at once:
- creates a dropdown (selection) list of options on the Panel canvas
- returns the selected item
Signature:
python
choice = ui.dropdown(label, options, index=0, format_func=None, key=None)
Let's take a look at a specific example.
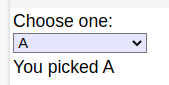
```python from comet_ml import ui
choice = ui.dropdown("Choose one:", ["A", "B", "C"]) ui.display("You picked", choice) ```
When you first run this code, you will see:
Note that this is very different from the usual manner of creating GUI
elements. In this manner, there are no "callbacks" but merely the
above code. By default, the dropdown has been shown on the screen and
the default options (index=0) has been selected. The code continues,
and so you see choice "A" already set as the choice.
If you then select a different item, your code runs again, updating the GUI and the selected item:
If you would like to separate code that should only run once (say, because it is expensive to compute) you can separate the code to run when the GUI is updated by placing it in a main function, like this:
```python from comet_ml import ui
Code that is expensive to run:
choices = ...
async def main(): # The fast GUI-based code:
choice = ui.dropdown("Choose one:", choices)
ui.display("You picked", choice)
```
The argument index is a numeric value representing the row to show
as the initial choice.
The format_func is a function that takes a row from options, and
returns a string to be used in the dropdown selection list. This is
useful if you would like to provide to options something other than
what you would like displayed. For example, consider:
```python from comet_ml import API, ui
api = API()
api_experiments = api.get_panel_experiments()
api_experiment = ui.dropdown( "Choose an experiment by key:", api_experiments, format_func= lambda experiment: experiment.key ) ```
In this example, the experiment's key is used in the dropdown list,
but options is a list of APIExperiments. In this manner, you can
pass in options in any format, but you should then provide a
format_func for easy selection.
ui Utility methods
These are the ui utility functions:
- ui.get_theme_names()
- ui.set_css(css_text)
- ui.add_css(css_text)
These are described below.
ui.get_theme_names()
Get the names of color themes for displaying pandas' Dataframes.
Example:
```python from comet_ml import ui
color_theme_names = ui.get_theme_names() color_theme_name = ui.dropdown.dropdown( "Select a theme:", color_theme_name )
create a draframe here
ui.display(df, theme=color_theme_name) ```
As shown, the color_theme_names could be useful in creating a dropdown selection showing a Dataframe.
ui.set_css()
This method allows you to set additional CSS for items for display.
Warning
This is experimental and may be removed in a future version.
ui.add_css()
This method allows you to add CSS for items for display.
Warning
This is experimental and may be removed in a future version.
Troubleshooting
If a panel is reporting an error, then it could be caused by the following:
-
Using an unsupported browser. Currently Python Panels is known to work under the following browsers:
- Chrome, version 71.0 and greater
- Firefox, version 70.0 and greater
- Edge, version 80 and greater
-
The panel has an error. If this is your panel, you can edit it to fix what is wrong. If it is another user's panel, you can contact them to let them know there is an issue.
Debugging
Note that using print() will display items in the Console area
(bottom, right-hand corner). This is very useful for debugging.
Technical Details
Python Panels also allows you to use many other Python support
modules, including: asciitree, atomicwrites, attrs, beautifulsoup4,
bleach, cloudpickle, cssselect, cycler, cytoolz, decorator, distlib,
docutils, freesasa, future, glpk, html5lib, Jinja2, imageio,
iniconfig, jedi, joblib, kiwisolver, libiconv, libxml, libxslt,
libyaml, lxml, markdown, MarkupSafe, micropip, mne, more-itertools, mpmath,
msgpack, networkx, nlopt, nose, numcodecs, optlang, packaging, parso,
patsy, pluggy, py, Pygments, pyparsing, pyrtl, pytest,
python-dateutil, python-sat, pytz, pywavelets, pyyaml, regex,
retrying, setuptools, six, soupsieve, statsmodels, swiglpk, sympy,
toolz, traits, typing-extensions, uncertainties, webencodings, xlrd,
yt, zarr, and zlib.
What to do if you want to use another Python package?
What should you do if you want to use a Python package not listed above? Let us know! There might be an easy solution.
Python Panels Speed
Python Panels run in the browser rather than from a server. That has a number of implications. First and foremost, there is a bit of an overhead to load the libraries needed in order to execute Python code in the browser. Typically, this delay only happens when required, typcially once per project or experiment view. Note also, that Python Panels can use more memory than usual.
To create responsive Python Panels, it is suggested to:
- limit the number of modules loaded
- limit the number of requests (e.g., api.get_...() calls)
- limit the amount of information displayed
The following Python modules are known to require noticeable load times:
- matplotlib (medium load time)
- pandas (large load time)
- Plotly Express (large load times, as it requires pandas)
Known Limitiations
- Python Panels do not automatically update with new experiments nor upon receiving new logged metrics. This is by design, as your Python Panel may be expensive to compute, and you may not wish to have it automatically refresh whenever new data is received.
- Limited types of widgets: currently, there is only
ui.dropdown(); what else would you like? - Line numbers in Python's tracebacks are off; see your webbrowser's Console for current line numbers
- Pandas'
DataFrame.styleis not available - Vega and Altair not available (under development)
If you find any additional limitations or have a request, let us know:
References for Panel Resources
For more information on Panels, see also: