Stanford Research Series: Making Trading Great Again: Trump-based Stock Predictions via doc2vec Embeddings
Authors: Rifath Rashid (rifath@stanford.edu) and Anton de Leon (aadeleon@atanford.edu)
1 Introduction
The question of how accurately Twitter posts can model the movement of financial securities is one that has had no lack of exploration in the past decade. Some of the first work on this topic was done in 2010, giving rise to an entire marketplace of algorithmic trading based on Twitter sentiment [1]. Notably, the glory of Twitter-based trading behavior met its doom on April 23, 2013 at 1:07 PM, when Syrian hackers posted a tweet via the Associated Press’s account claiming that two explosions in the White House had left President Obama injured. Immediately after this tweet, the Dow Jones Industrial Average dropped 143.5 points and the S&P 500 lost $136 billion. For some, events like this have called to question the fallibility of basing financial decisions off of Twitter sentiment. For others these events have motivated further research into improved models, to prevent re-occurrence of these issues. The work presented in this paper is done in the spirit of the latter school of thought. We seek to understand how more recent advancements in distributed word representations can capture contextually-rich sentences and phrases that pure sentiment analysis might miss. The first work in this space focused on categorical sentiment, yet we have advanced much in our ability to understand contexts since then. Secondly, what’s different about today and three years ago is that in the past we did not have one of the most powerful people in the world using Twitter as their singular platform. This paper seeks to address this new reality with the question: can contextually-rich document representations of Trump tweets successfully predict stock change? This work will attempt to answer this question by using document embeddings of tweets and feeding those embeddings into a neural network to predict stock price change.
2 Literature Review
The first work in this space introduced the idea of utilizing the Twitter platform as an estimator of public mood [1]. Here, researchers used a tool called Google-Profile of Mood States(GPOMS) which takes as input the text content of various tweets and generates a daily time-series of public mood along six predetermined dimensions, and they find that two of these dimensions (‘Calm’ and ‘Happiness’) seem to have predictive power over the Dow Jones Industrial Average (DJIA) when added to existing prediction models of the DJIA. While this study provides evidence for the potential predictive power of public sentiment and makes strides in using Twitter as a measurement tool, categorical sentiment may be too coarse a lens for viewing the sensitivities of financial markets. Recent efforts to address the obstacle of sentence level sentiment analysis of financial news builds on foundational work by Google with doc2vec [3, 4]. On this vertical, researchers have demonstrated the success of distributed representations in identifying the sentence-level sentiment, outperforming both bag-of-words and dictionary-based methods. Interestingly, work by the theory community has claimed that, in the context of transfer learning, methods like doc2vec are outperformed by more baseline approaches such as using the distributed representation of the words of a sentence and taking a weighted average [5]. Thus, it is very possible that the use of distributed representations of phrases that are longer than a single word does not generalize to other bodies of text. However, this generalization is beyond the goal of my work as the focus of this project is entirely on Trump tweets, and the domain-success of sentence-level distributed representations is empirically supported [3].
3 Data
3.1 Twitter Data
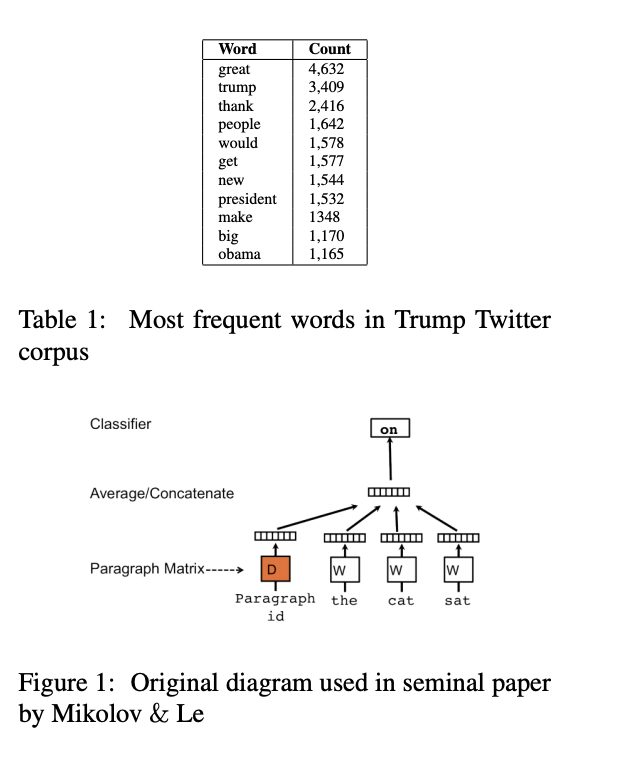
For non-commercial applications, Twitter places limits for how far back developers can access users’ tweets. We use the API for attaining 2019 tweets, but use a publicly available dataset of all tweets of Donald Trump from 2010–2018 (Source: https://github.com/bpb27/trump-tweetarchive/tree/master/data/realdonaldtrump). Specifically, we make use of the raw text and dates of the tweets. In total, we attained 38,471 tweets. Our predictive model considers all tweets on one day as a single training instance, leaving us with 2,139 business days of tweets. Here, we ignore days with no corresponding financial data (i.e. weekends and holidays). The average number of tweets per day is 13.4, and the max number of tweets in one day is 160. Table 1 showcases some of the most common words in tweet corpus (ignoring common stop words and considering only lowercase versions). For our training data, we consider all tweets from 1/1/10 to 5/30/2015, giving us 1,136 days of tweets with matching price change data. For our validation set, we consider all tweets from 5/31/2015 to 10/31/2016, giving us 360 days of tweets. 3.2 Stock Price Data End-of-day stock price was attained from Quandl, which provides financial data for various securities since their IPOs.
4 Experimental Models
4.1 doc2vec Embeddings
As Figure 1 shows, the original learning goal formulated by Mikolov and Le was to observe if one could learn document vectors such that these vectors could contribute to a prediction task about the next word in a sentence [3]. Here, we use the paragraph ID and a fixed-window of words as features and the subsequent word in the window as our target. This is known as the Distributed Memory approach. Mikolov & Le also proposed a distributed bag of words approach that sampled a random window from a paragraph and then formulated the task of predicting a random word from the window given the paragraph ID. While the Distributed Memory approach has a longer training time, we focus on the use of this approach as it preserves the ordering and context of words in ways that the bag-of-words methods might ignore. This ordering may be critical to the financial implication of sentence. We use the gensim library for building our doc2vec model. We remove stop-words using the nltk library and convert all words to lower case. We begin the learning rate at 0.025 and allow it to decay in each epoch by 0.0002 until it reaches 0.00025. We parameter tune on vector size and number of training epochs and present the results in the following section.
4.2 Four layer Neural Network
We use a four-layer neural network that takes a doc2vec embedding as input and outputs a stock price change. We train separately for each financial security. The input is the average embedding vector for all posts on the day for which we are predicting stock change at the end of the day. Here, stock change is the difference in the opening and closing price of a stock in relation to its opening price. The first hidden layer of the neural network contains 128 units and uses a ReLu activation. The second hidden layer contains 16 units and uses a ReLu activation. Both layers are fully connected. We focus our parameter tuning on the doc2vec model, and perform minimal tuning on the neural network. We use mean squared error as our cost function and linear activation for our output. For regularization, we apply L2 penalty of 0.04 and a dropout probability of 0.2 between the two hidden layers. These values were decided by experimentation on the validation set. Finally, we normalize all train, validation, and testing date using the means and standard deviations of the training data.
4.3 Trading Simulation
We perform backtesting with a simply greedy strategy. Our goal here is to place all decision making on the model itself. For a given day, if there are tweets for that day, then our model will predict the price change of the security for that day. If the price change is positive, then we enter a long position for 10 shares. If the price change is predicted to be negative, then we exit our position for this security. Each simulation is done with respect to only one security, but we allude to more complex trading algorithms in our future directions. All portfolios begin with 30, 000 USD. The start date of each simulation is 11/1/16 and the end date is 6/9/19, giving us 653 days of tweets for which we have end-of-day price change data (test set).
5 Results
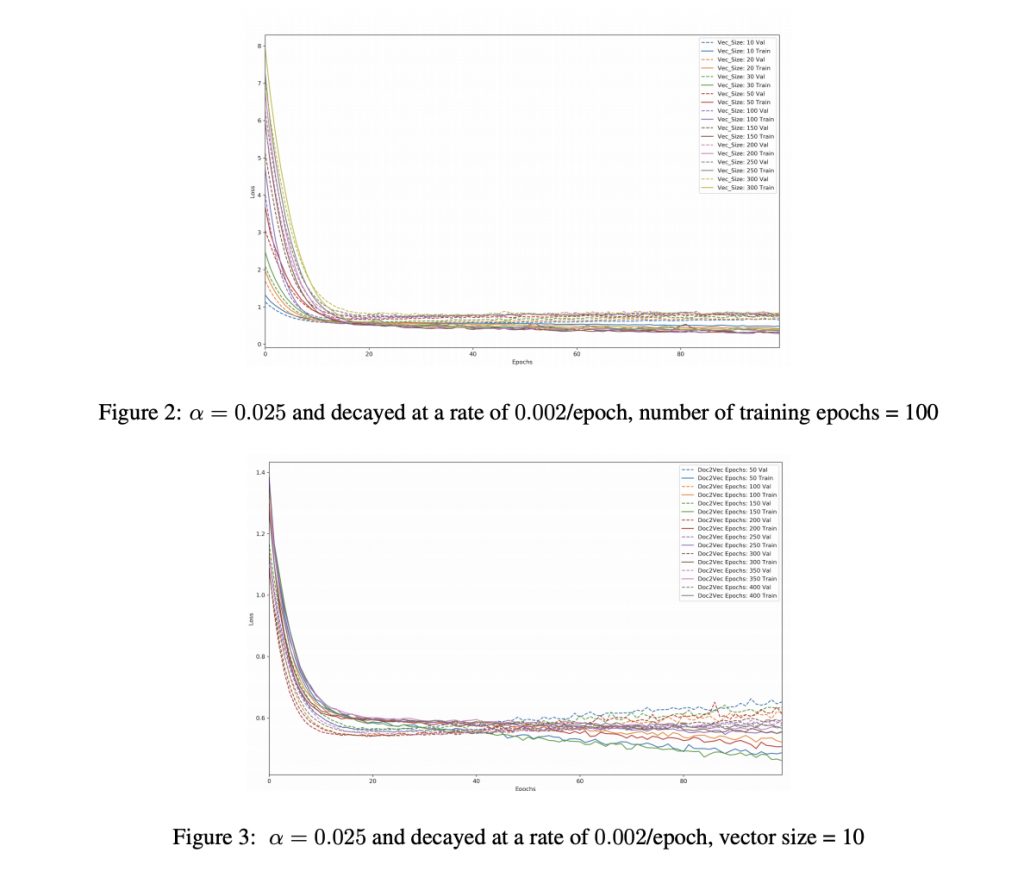
We first begin with a search for the optimal parameters of our doc2vec model. Here, we train on the price change of the RUSSELL 3000, an index representing the 3,000 largest companies by market capitalization that are incorporated in America. The motivation behind this decision was to use a security that represents the wide range of American companies that may be sensitive to Trump tweets. Figures 1 and 2 exhibit our experimental results when varying embedding vector size and number of training epochs. We observe that smaller vector sizes tend to have lower validation loss, with the lowest validation loss belonging to a vector size of 10. We observe the opposite relation with number of training epochs, where training our doc2vec model for 400 epochs resulted in the lowest validation error. Using these optimal parameters, we then tested our model on various financial securities. To respect the brevity of this report, we hold our search to two main sectors: technology companies and companies with government contracts. For each company, we present its final training and testing loss after 100 epochs. We simulate trading for the aforementioned sectors using our algorithm mentioned in section 4.3 and present the results in figures 4 and 5.
![]()
6 Discussion
We observe several trends from our results. To begin, validation loss tends to increase with vector size and this makes sense. Since we’re only considering once person’s lexicon, increasing the dimension of our embedding space likely adds unnecessary noise and makes our model vulnerable to the curse of dimensionality.
By varying number of training epochs for our doc2vec model, we notice that training for more iterations results in lower validation loss. This, too, is unsurprising, yet future research should explore at what point the model begins to overfit. In this work, we are limited in our exploration due to time and compute power. When trained on specific companies, we notice that the final test loss is highly variable, yet the accuracy in direction of price change is relatively constant for all companies (around ∼ 50%). This suggests that our model is reasonable at predicting direction, but suffers with the scale of the change. It is important to note here that the testing labels are evenly distributed and the predictions are also evenly distributed. For instance, in the case of Google, 51.8% of Google price changes in the testing period are non-negative, and 54.8% of our model’s predictions are non-negative. These sorts of distributions are generally the same across companies, and this shows that our model is not naively predicting negative price changes for all instances and thereby trivially earning an accuracy of 0.5 for direction of movement. Our original task is a regression task, and we only discuss accuracy of sign change here to illustrate that much of the loss is due to scaling of price change. We notice that our model generalizes well to the testing data, even though for some companies the train loss is high to begin with. It should be noted that we were only able to achieve this after regularization and normalization of the features (adding L2 regularization and including dropout). Prior to regularization, our validation error remained constant for each epoch. Interestingly, we notice that some companies exhibit lower testing loss than training loss. Research into this phenomena in the Tensorflow threads shows that this is potentially due to the fact that regularization is applied only during train time, resulting in higher training loss in the first few epochs. The final training loss reported by Tensorflow is averaged over all epochs. Finally, we notice a distinction between companies that are contracted by the government and ones that are not. Government-contracted companies consistently have lower loss, whereas general technology companies exhibit varying properties of loss. In our trading simulation, this is showcased by the fact that government-contracted companies consistently earned more profits than general technology companies. This does not necessarily suggest that these companies had better stocks. It suggests that our model was a better decision maker when it came to government-contracted companies. It should be noted that in this time period, the return of the DJIA was 38.4% . Still, the relative trading success of government-contracted companies makes intuitive sense as the success of government-contracted companies is intrinsically tied to the actions of the President. A good example of this is on December 12th 2016, when President Trump tweeted “The F-35 program and cost is out of control. Billions of dollars can and will be saved on military (and other) purchases after January 20th.” A statement like this had immediate effect with Lockheed Martin shares dropping 4%, Boeing shares dropping 0.72%, and General Dynamics shares dropping 2.87% (Source: https://www.fxcm.com/uk/insights/presidenttrumps-twitter-impact-forex-markets-stocks/footnote-7).
7 Conclusion and Future Research
The main accomplishment of this work is as a proof-of-concept that trading based on Trump twitter posts is grounded in reasoning. This is supported by the consistent non-negative returns obtained via only a simple trading strategy for various public companies. We learn that our model has variable success with different companies, and future research might explore company-specific information extraction from tweets. Pre-trained distributed word representations, such as BERT and GloVe, have proven their success in various domains, and these claims are theoretically and empirically supported [5, 6]. We relied on document embeddings for their empirical success in the financial domain [3], but future work may strongly consider trying a weighted average of word embeddings. Finally, projects with access to microscale stock information should look deeper into the lag times in minutes and seconds on stock price movements. For this paper, we were limited to end-of-day prices. Minor explorations with lag times in days showed little change. Given the sensitivity of financial markets, future work should indeed focus on the very immediate effects of Trump tweets.
8 Contributions
I, Rifath Rashid, am responsible for the design, coding, and reporting of this project. I thank Atharva Parulekar for advice and guidance along the way. Anton helped survey the literature and prepare the review. He also looked into ways of building neural nets via TensorFlow”
9 References
[1] Bollen, J., Mao, H. & Zeng, X. (2010) Twitter mood predicts the stock market. Journal of Computer Science 2(1), pp. 1–8. [2] Nisar, T.M. & Yeung, M. (2018) Twitter as a tool for forecasting stock market movements: A short-window event study. Journal of Finance and Data Science 4(2), pp. 101–119. [3] Lutz, Bernhard & Prllochs, Nicolas& Neumann, Dirk. (2019). Sentence-Level Sentiment Analysis of Financial News Using Distributed Text Representations and Multi-Instance Learning. 10.24251/HICSS.2019.137. [4] Q. Le and T. Mikolov, Distributed representations of sentences and documents, in Proceedings of the 31st International Conference on Machine Learning (ICML), pp. 11881196, 2014. [5] Sanjeev Arora, Yingyu Liang, and Tengyu Ma. 2017. A simple but tough to beat baseline for sentence embeddings. In International Conference on Learning Representations (ICLR 2017). [6] Jey Han Lau and Timothy Baldwin, ”An Empirical Evaluation of doc2vec with Practical Insights into Document Embedding Generation.” CoRR. 2016.10 Code
Related Articles